Is the Market Overvalued? - Investment Ideas
March 18 2013 - 9:47PM
Zacks
Valuation Lessons From Shiller’s CAPE Model
Yale Professor Robert Shiller’s price-earnings ratio is getting
fresh press these days. U.S. stock markets (tickers: SPY,
QQQ, DIA) have all hit multi-year highs. They recorded their
best quarter in 15 years.
The question the stock market highs raise: Is this market
overvalued?
Robert Shiller’s valuation ratio provides us one avenue to address
the current valuation concern. His price to earnings (P/E)
ratio is based on average inflation-adjusted earnings from the
previous 10 years. This P/E ratio gives investors a view on
stock market valuation over a full business cycle, smoothing out
both recessions and booms in corporate earnings.
This P/E ratio is also known as the Cyclically Adjusted P/E Ratio
(the CAPE Ratio), the Shiller P/E Ratio, or the P/E 10.
How to Compute Shiller’s CAPE
- Look at yearly earnings on the S&P 500 for each of the past
ten years.
- Adjust earnings for inflation, using the CPI. In other
words, quote each earnings figure in 2012 dollars.
- Average these values. In other words, add them up and
divide by ten. This gives us “e10.”
- Then, take the current price of the S&P 500 and divide by
e10.
The chart below shows Shiller’s CAPE Ratio over the last 160 years
of U.S. stock market data.
Bob Shiller likes to look over the long sweep of history.
Interestingly, this chart included long-term interest rate data
from fixed income markets over the same 160-year period.
That is what attracted me.

What History Shows
Note: long-term interest rates hit a major high in 1921.
At the same time, the stock market Shiller valuation hit a major
low.
Then, long-term interest rates declined. As rates
declined, stock market Shiller valuations rushed up into the Crash
of 1929. Rates continued their decline until 1940.
When interest rates reversed upwards after WWII, the long-term
valuation of the stock market went with it.
Until 1966…
Then, the Vietnam War and Arab Oil Embargo squelched a 25-year
stock market valuation rally, and gave the U.S. economy a battle
with high consumer price inflation.
From 1940 to 1980, forty years in a rising rate formation
materializes. A historic high in long-term U.S.
interest rates is placed in 1981.
Again, once interest rates hit a major high in 1981, the U.S.
stock market hit a major Shiller valuation low.
This may be the key insight of this valuation model: History
shows us that Shiller CAPE valuation lows in stock markets tie
directly into the major highs in long-term interest rates.
Stock market valuation bulls ran for the next 20 years, all the way
to a peak in the Shiller P/E Ratio in 2000.
What About Today?
Long-term interest rates have been declining since 1981. This
long run down in rates is now over 30 years old. Pundits keep
calling for a turn upwards in long-term rates. It has not
materialized.
Lesson #1
The Fed is working overtime to manage down the long-term 10-year
U.S. Treasury rate to 2.0%. This chart tells us one reason
why. Keeping long-term interest rates near historic lows
makes stock valuations relatively more attractive. A
risk trade is made better.
The long sweep of history confirms the simple logic in that
policy.
If long-term rates rise, history also says that is NOT the end of
the bull market in terms of Shiller valuations. Stock
valuations can keep going up for years, as long as the rise in
long-term rates is modest and steady.
However, if inflation blasts upwards like in the late 1970s to
early 1980s, as some predict, this model says the results for
stocks would not be so simple. It would be disastrous.
Lesson #2
Today’s stock market trades at 23.40 on the Shiller CAPE.
That looks high in historic terms. This is Bob Shiller’s big
point.
However, remember the past 10 years of earnings data include the
2008 and 2009 years. There was a deep, leveraged collapse in
earnings here. Take those earnings years out, and the current
valuation alarm falls away.
The lesson here is to look out for a major market event to derail
market matters, like an Oil Embargo, or an Over-Leveraged Housing
Crash. Something in broader Europe looks appropriate today.
A future valuation trip up, with the Shiller CAPE ratio rising
above 30, would be the zone for concern. That is a +30%
valuation-only move from here.
Lesson #3
For a competing valuation perspective, consider this.
Trailing 12-month P/E ratios for the S&P 500 index show us a 15
valuation. The forward 12-month S&P 500 valuation is
around 14.5 at the moment.
The former is valued in line with its historic 160-year norm.
The latter is slightly undervalued. The final lesson is
this. The trailing-forward 12-month P/E gap is constructive
-- as long as the +3% to +5% earnings growth this gap predicts
materializes this year.
As long as we stay away from valuation extremes, we are good to
go.
SPDR-DJ IND AVG (DIA): ETF Research Reports
NASDAQ-100 SHRS (QQQ): ETF Research Reports
SPDR-SP 500 TR (SPY): ETF Research Reports
To read this article on Zacks.com click here.
Zacks Investment Research
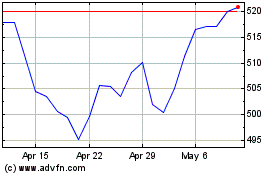
SPDR S&P 500 (AMEX:SPY)
Historical Stock Chart
From Jul 2024 to Aug 2024

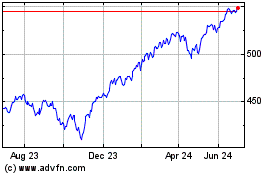
SPDR S&P 500 (AMEX:SPY)
Historical Stock Chart
From Aug 2023 to Aug 2024
