Caterpillar Down Over 9%, on Pace for Largest Percent Decrease Since March 2009 -- Data Talk
October 23 2018 - 11:09AM
Dow Jones News
Caterpillar Inc. (CAT) is currently at $116.83, down $11.88 or
9.23%
-- Would be lowest close since Aug. 29, 2017 when it closed at
$116.01
-- On pace for largest percent decrease since March 30, 2009
when it fell 9.29%
-- Earlier Tuesday, Caterpillar reported adjusted earnings of
$2.86 a share in its third quarter, above last year's $1.95 and
analyst expectations of $2.85. Though Caterpillar narrowly beat
expectations for profit and warnings in the quarter, the outlook
for more rising costs spooked investors. Caterpillar reaffirmed its
adjusted earnings per share guidance for the year of $11 to $12
-- Down 25.86% year-to-date; on pace for worst year since 2015
when it fell 25.75%
-- Down 31.63% from its all-time closing high of $170.89 on Jan.
22, 2018
-- Down 15.49% from 52 weeks ago (Oct. 24, 2017), when it closed
at $138.24
-- Would be a new 52 week closing low
-- Traded as low as $116.28; lowest intraday level since Aug.
30, 2017 when it hit $115.88
-- Down 9.66% at today's intraday low; largest intraday percent
decrease since May 6, 2010 when it fell as much as 12.07%
-- Worst performer in the DJIA today
-- Worst performer in the S&P 500 today
-- Subtracted 80.55 points from the DJIA so far today
All data as of 10:30:38 AM
Source: Dow Jones Market Data, FactSet
(END) Dow Jones Newswires
October 23, 2018 10:54 ET (14:54 GMT)
Copyright (c) 2018 Dow Jones & Company, Inc.
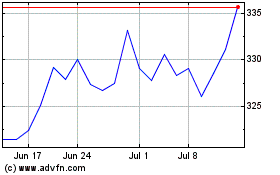
Caterpillar (NYSE:CAT)
Historical Stock Chart
From Apr 2024 to May 2024

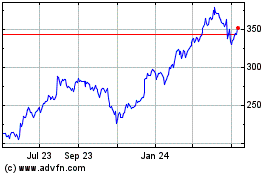
Caterpillar (NYSE:CAT)
Historical Stock Chart
From May 2023 to May 2024
