Premier Miton Global Renewables Trust Plc - Portfolio Update
December 03 2024 - 6:02AM
UK Regulatory
Premier Miton Global Renewables Trust Plc
- Portfolio Update
PR Newswire
LONDON, United Kingdom, December 03
Premier
Miton Global Renewables Trust PLC announces that at close of
business on 29 November 2024 its
investments were as follows:
|
Company
|
% of total
net assets
|
|
Clearway
Energy A Class
|
7.4%
|
|
Greencoat
UK Wind
|
7.1%
|
|
Drax
Group
|
6.3%
|
|
Bonheur
|
5.8%
|
|
Octopus
Renewables Infrastructure Trust
|
5.3%
|
|
Cadeler
|
5.0%
|
|
Grenergy
Renovables
|
4.8%
|
|
RWE
|
4.6%
|
|
NextEnergy
Solar Fund
|
4.4%
|
|
SSE
|
4.3%
|
|
National
Grid
|
3.8%
|
|
Foresight
Solar Fund
|
3.6%
|
|
Northland
Power
|
3.2%
|
|
Aquila
European Renewables Income Fund
|
3.0%
|
|
Gore
Street Energy Storage Fund
|
2.9%
|
|
AES
|
2.6%
|
|
Enefit
Green
|
2.3%
|
|
SDCL
Energy Efficiency Income Trust
|
2.1%
|
|
Greencoat
Renewable
|
1.9%
|
|
Corporacion
Acciona Energias Renovables
|
1.8%
|
|
GCP
Infrastructure Investments
|
1.7%
|
|
Cloudberry
Clean Energy
|
1.7%
|
|
Harmony
Energy Income Trust
|
1.6%
|
|
US Solar
Fund
|
1.6%
|
|
Polaris
Renewable Energy
|
1.5%
|
|
Orsted
|
1.5%
|
|
Fastned
|
1.2%
|
|
MPC Energy
Solutions
|
1.0%
|
|
7C
Solarparken
|
0.9%
|
|
VH Global
Sustainable Energy Opportunities
|
0.7%
|
|
Serena
Energia
|
0.6%
|
|
Boralex
|
0.5%
|
|
Scatec
Solar
|
0.5%
|
|
Innergex
Renewable
|
0.4%
|
|
Clean
Energy Fuels
|
0.3%
|
|
Atrato
Onsite Energy
|
0.2%
|
|
Cash/Net
Current Assets
|
2.0%
|
At close
of business on 29 November 2024 the
total net assets of Premier Miton Global Renewables Trust PLC
amounted to £37.2 million. The sector breakdown and geographical
allocation were as follows:
|
Sector
Breakdown
|
% of total
net assets
|
|
Yieldcos
& investment companies
|
34.9%
|
|
Renewable
energy developers
|
31.3%
|
|
Renewable
focused utilities
|
6.9%
|
|
Energy
storage
|
4.5%
|
|
Biomass
generation and production
|
6.3%
|
|
Electricity
networks
|
3.8%
|
|
Renewable
technology and service
|
5.0%
|
|
Renewable
financing and energy efficiency
|
3.8%
|
|
Renewable
Fuels and Charging
|
1.5%
|
|
Cash/Net
Current Assets
|
2.0%
|
|
Geographical
Allocation
|
% of total
net assets
|
|
United
Kingdom
|
29.2%
|
|
Europe (ex
UK)
|
34.9%
|
|
Global
|
18.7%
|
|
North
America
|
12.2%
|
|
Latin
America
|
3.0%
|
|
|
|
|
Cash/Net
Current Assets
|
2.0%
|
|
|
100%
|

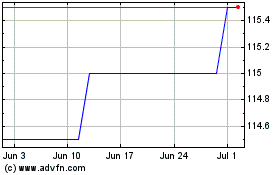
Pmgr Secs 2025 (LSE:PMGZ)
Historical Stock Chart
From Nov 2024 to Dec 2024

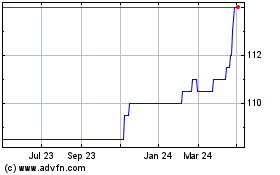
Pmgr Secs 2025 (LSE:PMGZ)
Historical Stock Chart
From Dec 2023 to Dec 2024
