Intermediate Capital Group plc: Q3 trading statement for the nine months ended 31 December 2024
January 22 2025 - 2:00AM
UK Regulatory
Intermediate Capital Group plc: Q3 trading statement for the nine
months ended 31 December 2024
| |
ICG
plc
22 January 2025
Q3 update for the nine months ended 31 December
2024
|
|
| |
$22bn raised in the last twelve months |
|
| |
Highlights
- Strong fundraising
of $7.2bn in the quarter resulting in $22bn raised in the last
twelve months, more than twice as much as raised in calendar 2023
and supporting long-term growth in client capital and management
fees
- Client commitments
included $1.8bn to Strategic Equity and $1.8bn to Europe IX. Europe
IX expected to be activated and fee-earning by March 2025
- AUM of $107bn
(+5.1% q-o-q1); fee-earning AUM of $71bn (+2.8%
q-o-q1); AUM not yet earning fees of $20bn
- Investment
environment remains in line with recent quarters
- Balance sheet
investment portfolio during the quarter generated positive NIR in
all asset classes and net cash realisations
- AAA ESG rating
awarded by MSCI for the fourth consecutive year, membership of the
Dow Jones Sustainability Index (Europe) for the second consecutive
year
- Shareholder
seminar on ICG Strategic Equity to be held online on 5 March 2025
at 5pm GMT. Register here
- Sonia Baxendale
joined the Board as a Non-Executive Director in January
20252
Unless otherwise stated the financial results discussed herein are
on the basis of alternative performance measures (APM) basis; see
full year results
1 On a constant currency basis; 2 As previously announced. |
|
PERFORMANCE REVIEW
| |
AUM |
|
|
|
|
| |
|
|
Growth1 |
| |
|
31 December 2024 |
Last three months |
Year-on-year |
Last five years (CAGR) |
| |
AUM |
$107bn |
5.1% |
27.5% |
19.3% |
| |
Fee-earning
AUM |
$71bn |
2.8% |
8.1% |
14.7% |
| |
|
|
|
|
|
| |
1 On a constant currency basis
Note: historical AUM has not been updated to reflect AUM policy
change effective March 2024. This does not impact fee-earning
AUM |
| |
Business
activity |
|
|
|
|
|
|
|
|
| |
|
|
|
|
|
|
|
|
|
| |
$bn
|
Fundraising |
|
Deployment1 |
|
Realisations1,2 |
| |
Q3 FY25 |
LTM |
|
Q3 FY25 |
LTM |
|
Q3 FY25 |
LTM |
| |
Structured and Private Equity |
5.3 |
10.1 |
|
1.0 |
7.4 |
|
0.2 |
1.0 |
| |
Private Debt |
0.2 |
6.6 |
|
1.2 |
3.3 |
|
1.7 |
4.4 |
| |
Real Assets |
0.7 |
1.5 |
|
0.8 |
2.0 |
|
0.5 |
1.4 |
| |
Credit |
1.0 |
3.6 |
|
|
|
|
|
|
| |
Total |
7.2 |
21.8 |
|
3.0 |
12.7 |
|
2.4 |
6.8 |
| |
|
|
|
|
|
|
|
|
|
| |
1 Direct investment funds; 2 Realisations of fee-earning AUM |
PERIOD IN REVIEW
AUM and FY25 fundraising
At 31 December 2024, AUM stood at $107bn and
fee-earning AUM at $71bn. The bridge between AUM and fee-earning
AUM is as follows:
|
$m |
Structured and Private Equity |
Private Debt |
Real Assets |
Credit |
Seed investments |
Total |
|
Fee-earning AUM |
31,932 |
14,353 |
7,401 |
17,451 |
— |
71,137 |
|
AUM not yet earning fees |
4,449 |
13,956 |
751 |
356 |
— |
19,512 |
| Fee-exempt
AUM |
8,365 |
1,318 |
3,035 |
— |
— |
12,718 |
|
Balance sheet investment portfolio1 |
2,329 |
148 |
458 |
(183) |
452 |
3,204 |
|
AUM |
47,075 |
29,775 |
11,645 |
17,624 |
452 |
106,571 |
|
1 Includes elimination of $634m (£507m) within Credit due to how
the balance sheet investment portfolio accounts for and invests
into CLO's managed by ICG and its affiliates |
At 31 December 2024 we had $30bn of AUM
available to deploy in new investments ("dry powder"), of which
$20bn was not yet earning fees.
The stronger US Dollar at 31 December 2024
compared to 30 September 2024 impacted the US Dollar value of our
non-US Dollar (predominantly Euro) funds. We receive management
fees in the fund currency.
AUM
|
AUM ($m) |
Structured and Private Equity |
Private Debt |
Real Assets |
Credit |
Seed investments |
Total |
|
At 1 October 2024 |
43,453 |
31,906 |
12,266 |
18,106 |
527 |
106,258 |
|
Fundraising |
5,350 |
181 |
680 |
1,029 |
|
7,240 |
| Other
additions |
8 |
155 |
219 |
3 |
|
385 |
| Realisations |
(168) |
(848) |
(427) |
(852) |
|
(2,295) |
| Market and other
movements |
(1,518) |
(1,612) |
(1,082) |
(688) |
|
(4,900) |
|
Balance sheet movement |
(50) |
(7) |
(11) |
26 |
(75) |
(117) |
|
At 31 December 2024 |
47,075 |
29,775 |
11,645 |
17,624 |
452 |
106,571 |
|
Change $m |
3,622 |
(2,131) |
(621) |
(482) |
(75) |
313 |
| Change % |
8% |
(7%) |
(5%) |
(3%) |
(14%) |
—% |
|
Change % (constant exchange rate) |
13% |
(2%) |
2% |
2% |
(8%) |
5% |
Fee-earning AUM
|
Fee-earning AUM ($m) |
Structured and Private Equity |
Private Debt |
Real Assets |
Credit |
Total |
|
At 1 October 2024 |
31,184 |
15,685 |
7,731 |
17,957 |
72,557 |
|
Funds raised: fees on committed capital |
1,941 |
— |
543 |
— |
2,484 |
|
Deployment of funds: fees on invested capital |
52 |
1,148 |
309 |
1,064 |
2,573 |
| Total
additions |
1,993 |
1,148 |
852 |
1,064 |
5,057 |
| Realisations |
(159) |
(1,683) |
(529) |
(872) |
(3,243) |
| Net
additions / (realisations) |
1,834 |
(535) |
323 |
192 |
1,814 |
|
FX and other |
(1,086) |
(797) |
(653) |
(698) |
(3,234) |
|
At 31 December 2024 |
31,932 |
14,353 |
7,401 |
17,451 |
71,137 |
|
Change $m |
748 |
(1,332) |
(330) |
(506) |
(1,420) |
| Change % |
2% |
(9%) |
(4%) |
(3%) |
(2%) |
|
Change % (constant exchange rate) |
7% |
(4%) |
2% |
2% |
3% |
FY25 fundraising
At 31 December 2024, funds that were actively
fundraising included Strategic Equity V; Europe Mid-Market II;
Europe IX; Core Private Equity; European Infrastructure II; and
various Real Estate strategies. We anticipate having final closes
for Strategic Equity V and Europe Mid-Market II before the end of
FY25, although the size and timing of such closes remains dependent
on market conditions.
Balance sheet
- The balance sheet investment
portfolio generated positive NIR across all asset classes and net
cash realisations during the quarter. We remain confident our
balance sheet will continue to deliver in line with our guidance.
At 31 December 2024 it was valued at £3,067m:
|
£m |
30 September 2024 |
31 December 2024 |
|
Structured and Private Equity |
1,778 |
1,861 |
|
Private Debt |
116 |
119 |
|
Real Assets |
350 |
365 |
|
Credit |
319 |
361 |
|
Seed investments |
394 |
361 |
|
Balance sheet investment portfolio |
2,957 |
3,067 |
- At 31 December 2024 the Group had total
available liquidity of £1.1bn (H1 FY25: £0.9bn)
FOREIGN EXCHANGE RATES
| |
Average rate |
Period end |
|
|
Q3 FY24 |
Q3 FY25 |
30 September 2024 |
31 December 2024 |
|
GBP:EUR |
1.1539 |
1.1992 |
1.2012 |
1.2086 |
| GBP:USD |
1.2503 |
1.2717 |
1.3375 |
1.2516 |
|
EUR:USD |
1.0835 |
1.0740 |
1.1135 |
1.0356 |
COMPANY TIMETABLE
Shareholder
seminar (online):
ICG Strategic Equity
|
5 March 2025, 5pm GMT
Register here |
| Full year results
announcement |
21 May 2025 |
ENQUIRIES
| Shareholders and
debtholders / analysts: |
|
| Chris Hunt,
Head of Corporate Development and Shareholder Relations, ICG |
+44(0)20 3545 2020 |
| Media: |
|
| Clare Glynn,
Head of Corporate Communications, ICG |
+44(0)79 3435 7794 |
This results statement may contain forward
looking statements. These statements have been made by the
Directors in good faith based on the information available to them
up to the time of their approval of this report and should be
treated with caution due to the inherent uncertainties, including
both economic and business risk factors, underlying such forward
looking information.
ABOUT ICG
ICG provides flexible capital solutions to help
companies develop and grow. We are a global alternative asset
manager with over 30 years' history, operating across four asset
classes: Structured and Private Equity, Private Debt, Real Assets,
and Credit.
We develop long-term relationships with our
business partners to deliver value for shareholders, clients and
employees. We are committed to being a net zero asset manager
across our operations and relevant investments by 2040.
ICG is listed on the London Stock Exchange
(ticker symbol: ICG). Further details are available at
www.icgam.com.


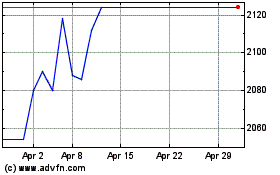
Intermediate Capital (LSE:ICP)
Historical Stock Chart
From Feb 2025 to Mar 2025

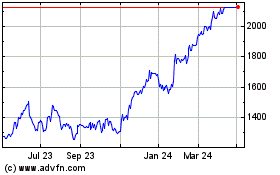
Intermediate Capital (LSE:ICP)
Historical Stock Chart
From Mar 2024 to Mar 2025
