Hermes Pacific Investments PLC Final Results (4319Z)
September 18 2015 - 2:00AM
UK Regulatory
TIDMHPAC
RNS Number : 4319Z
Hermes Pacific Investments PLC
18 September 2015
18 September 2015
HERMES PACIFIC INVESTMENTS PLC
(AIM: HPAC)
Final results for the year ended 31 March 2015
Hermes Pacific Investments Plc today reports its financial
results for the year ended 31 March 2015.
 Contacts
 Hermes Pacific Investments      www.hermespacificinvestments.com
  Plc
 Haresh Kanabar, Non-Executive   Tel: +44 (0) 207
  Chairman                        290 3340

 WH Ireland Limited (Nominated   www.wh-ireland.co.uk
  Adviser & Broker)
 Mike Coe/Ed Allsopp             Tel: +44 (0) 117
                                  945 3470
Chairman's Statement
I am pleased to report the results of Hermes Pacific Investments
Plc ("HPAC" or the "Company") for the 12- month period ended 31
March 2015. During the year, the Company had no revenues as it does
not have any operating business and the Company made a loss of
GBP115,000, which has been reduced from a recorded loss of
GBP117,000 during the previous financial year. We have continued to
focus on our cost base and aim to keep it low particularly whilst
we are in the process of looking for suitable investments. At the
year-end the Company had net assets of GBP4,117,000.
Review of the Company's Operations
The Company is an investing company and has made some
investments in line with its investing policy in companies involved
in financial activities within the emerging market sector. Our
principal focus is in the Far East as we believe that there are
good growth opportunities in that part of the world. These
investments have performed in line with our expectations. We are in
a strong position from a Balance Sheet perspective and our cash
balance as at 31 March 2015 stands at GBP4,008 million. We continue
to evaluate other suitable opportunities in emerging markets and
with our strong Balance Sheet expect to make further investments in
the near future. Our total comprehensive loss for the year was
GBP101,000 compared to a loss of GBP183,000 for the previous
financial year.
Emerging markets are becoming increasingly attractive for
foreign direct investment and do offer cost-effective investment
opportunities for businesses that are persistent and willing to
take a long-term view. These markets are expected to continue to
increase its spending over the coming years. The economies in the
Far East have shown increasing resilience and this region has been
an engine of global economic growth whist the developed markets
have been in some distress. Most emerging markets are expected to
continue to enjoy growth rates that are far superior to that of
developed markets. Political events in these countries have to date
not significantly affected appetite for investment.
Outlook
We remain in a strong position to take advantage of suitable
investment opportunities as they arise and look forward to the
future with confidence.
Haresh Kanabar
Chairman
15 September 2015
                                            Year ended     Year ended
                                              31 March       31 March
                                   Note           2015           2014
                                               GBP'000        GBP'000

 Continuing operations
 Revenue                                             -              -
 Cost of sales                                       -              -

 gross profit                                        -              -

 Other operating income                              -              -
 Administrative expenses              3          (130)          (131)

 Operating loss                                  (130)          (131)

 Finance income                                     15             14
 Finance costs                                       -              -

 Loss on ordinary activities
  before tax                                     (115)          (117)

 Tax expense                                         -              -

 Loss for the year from
  continuing activities                          (115)          (117)
 Discontinued operations
 Loss for the year from                              -              -
  discontinued operations

 Loss for the year                               (115)          (117)

   Other comprehensive income
   Available-for-sale financial
   assets:
   Gains/(losses) arising
   in the year
                                                    14           (66)
   Total comprehensive loss
   for the year                                  (101)          (183)
 Basic and diluted loss
  per share
 From continuing operations           8         (4.9)p           (5)p
 From discontinuing operations        8              -              -

                                                (4.9)p           (5)p
statement OF COMPREHENSIVE INCOME FOR THE YEAR ENDED 31 MARCH
2015
                                                      As at        As at
                                                   31 March     31 March
                                                       2015         2014
                                                    GBP'000      GBP'000
 ASSETS
 Non-current assets
 Investments                                            144          129

                                                        144          129
 Current assets
 Trade and other receivables                              1            1
 Cash and cash equivalents                            4,008        4,127

                                                      4,009        4,128
 LIABILITIES
 Current liabilities
 Trade and other payables                              (36)         (40)

                                                       (36)         (40)

 Net current assets                                   3,973        4,088

 NET ASSETS                                           4,117        4,218

 SHAREHOLDERS' EQUITY
 Issued share capital                                 3,576        3,576
 Share premium account                                5,781        5,781
 Share based payments reserve                         139            139
  Revaluation reserve                                  (29)         (43)
 Retained earnings                                  (5,350)      (5,235)

 TOTAL EQUITY                                         4,117        4,218
STATEMENT OF FINANCIAL POSITION AS AT 31 MARCH 2015
CASH FLOW STATEMENT FOR THE YEAR ENDED 31 MARCH 2015
                                                         Year                    Year ended
                                                        ended                      31 March
                                                     31 March                          2014
                                                         2015
                                                      GBP'000                       GBP'000

 Cash flows from operating
  activities                                            (134)                         (104)

 Cash flows from investing
  activities
 Acquisition of investments                                 -                             -
 Income from disposal of                                    -                             -
  subsidiary undertakings

 Net cash (used in)/from                                    -                             -
  investing activities

 Cash flows from financing
  activities
 Proceeds of share issues                                   -                         4,160
  Other income                                             15                            14
  Cost of share issue                                       -                             -

 Net cash from financing
  activities                                               15                         4,174


 (Decrease)/increase in
  cash and cash equivalents                             (119)                         4,070
 Cash and cash equivalents
  at start of period                                    4,127                            57


   Cash and cash equivalents
   at end of period                                     4,008                         4,127
STATEMENT OF CHANGES IN EQUITY FOR THE YEAR ENDED 31 MARCH
2015
                                                Share               Share
                    Ordinary    Deferred      premium               based
                       share       share                         payments             Retained           Revaluation
                     capital     capital                          reserve             earnings               reserve      Total
                     GBP'000     GBP'000      GBP'000             GBP'000              GBP'000               GBP'000    GBP'000

At 1 April 2013
 Share                   253       1,243        3,701                 139              (5,118)                    23          241
 re-organisation           -           -            -                   -                    -                     -            -
Share issue            2,080           -       2,080-                   -                    -                     -        4,160
Total
 comprehensive
 loss for the
 period                    -           -            -   -                                (117)                  (66)        (183)

At 1 April 2014        2,333       1,243        5,781                 139              (5,235)                (43)        4,218
Share                      -           -            -                   -                    -                     -          -
re-organisation
Share issue                -           -            -                   -                    -                     -          -
Total
 comprehensive
 loss for the
 period                    -           -            -                   -                (115)                    14      (101)
(MORE TO FOLLOW) Dow Jones Newswires
September 18, 2015 02:00 ET (06:00 GMT)
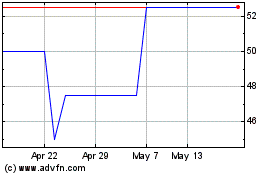
Hermes Pacific Investments (LSE:HPAC)
Historical Stock Chart
From Sep 2024 to Oct 2024

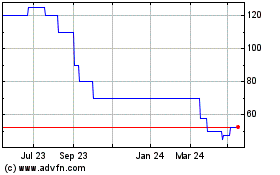
Hermes Pacific Investments (LSE:HPAC)
Historical Stock Chart
From Oct 2023 to Oct 2024
