Final Results -11-
March 25 2009 - 3:01AM
UK Regulatory
economic conditions. Past performance is no guide to future performance and
persons needing advice should consult an independent financial adviser.


The forward looking statements reflect knowledge and information available at
the date of preparation of this announcement. Except as required by the Listing
Rules and applicable law, Hochschild Mining plc does not undertake any
obligation to update or change any forward looking statements to reflect events
occurring after the date of this announcement. Nothing in this announcement
should be construed as a profit forecast.


Consolidated Income Statement
+-----------------------+--+-------------+--+-------------+--+----------+--+-------------+--+-------------+--+----------+--+
|                       |  |        Year ended 31 December 2008         |  |        Year ended 31 December 2007         |  |
+-----------------------+--+--------------------------------------------+--+--------------------------------------------+--+
|                       |  |   Before    |  |Exceptional  |  |  Total   |  |   Before    |  |Exceptional  |  |  Total   |  |
|                       |  |exceptional  |  |    items    |  |          |  |exceptional  |  |    items    |  |          |  |
|                       |  |    items    |  |             |  |          |  |    items    |  |             |  |          |  |
+-----------------------+--+-------------+--+-------------+--+----------+--+-------------+--+-------------+--+----------+--+
|                       |  |                                          US$ (000)                                            |
+-----------------------+--+-----------------------------------------------------------------------------------------------+
| Continuing operations |  |             |  |             |  |          |  |             |  |             |  |          |  |
|                       |  |             |  |             |  |          |  |             |  |             |  |          |  |
+-----------------------+--+-------------+--+-------------+--+----------+--+-------------+--+-------------+--+----------+--+
| Revenue               |  |     433,779 |  |           - |  |  433,779 |  |     305,021 |  |           - |  |  305,021 |  |
+-----------------------+--+-------------+--+-------------+--+----------+--+-------------+--+-------------+--+----------+--+
| Cost of sales         |  |    (240,441 | )|        (234 | )| (240,675 | )|    (106,272 | )|           - |  | (106,272 | )|
+-----------------------+--+-------------+--+-------------+--+----------+--+-------------+--+-------------+--+----------+--+
| Gross profit          |  |     193,338 |  |        (234 | )|  193,104 |  |     198,749 |  |           - |  |  198,749 |  |
+-----------------------+--+-------------+--+-------------+--+----------+--+-------------+--+-------------+--+----------+--+
| Administrative        |  |     (68,751 | )|      (1,127 | )|  (69,878 | )|     (68,817 | )|           - |  |  (68,817 | )|
| expenses              |  |             |  |             |  |          |  |             |  |             |  |          |  |
+-----------------------+--+-------------+--+-------------+--+----------+--+-------------+--+-------------+--+----------+--+
| Exploration expenses  |  |     (23,841 | )|         (69 | )|  (23,910 | )|     (26,890 | )|           - |  |  (26,890 | )|
+-----------------------+--+-------------+--+-------------+--+----------+--+-------------+--+-------------+--+----------+--+
| Selling expenses      |  |     (11,257 | )|           - |  |  (11,257 | )|      (2,780 | )|           - |  |   (2,780 | )|
+-----------------------+--+-------------+--+-------------+--+----------+--+-------------+--+-------------+--+----------+--+
| Other income          |  |       5,025 |  |         252 |  |    5,277 |  |       5,695 |  |         932 |  |    6,627 |  |
+-----------------------+--+-------------+--+-------------+--+----------+--+-------------+--+-------------+--+----------+--+
| Other expenses        |  |      (8,246 | )|      (1,984 | )|  (10,230 | )|      (2,027 | )|      (1,501 | )|   (3,528 | )|
+-----------------------+--+-------------+--+-------------+--+----------+--+-------------+--+-------------+--+----------+--+
| Impairment of         |  |          -  |  |    (34,706) |  |  (34,706 | )|          -  |  |          -  |  |       -  |  |
| property, plant and   |  |             |  |             |  |          |  |             |  |             |  |          |  |
| equipment             |  |             |  |             |  |          |  |             |  |             |  |          |  |
+-----------------------+--+-------------+--+-------------+--+----------+--+-------------+--+-------------+--+----------+--+
| Profit from           |  |      86,268 |  |     (37,868 | )|   48,400 |  |     103,930 |  |        (569 | )|  103,361 |  |
| continuing operations |  |             |  |             |  |          |  |             |  |             |  |          |  |
| before net finance    |  |             |  |             |  |          |  |             |  |             |  |          |  |
| income/(cost),        |  |             |  |             |  |          |  |             |  |             |  |          |  |
| foreign exchange loss |  |             |  |             |  |          |  |             |  |             |  |          |  |
| and income tax        |  |             |  |             |  |          |  |             |  |             |  |          |  |
+-----------------------+--+-------------+--+-------------+--+----------+--+-------------+--+-------------+--+----------+--+
| Share of post tax     |  |      (8,214 | )|           - |  |   (8,214 | )|           - |  |           - |  |        - |  |
| losses of associates  |  |             |  |             |  |          |  |             |  |             |  |          |  |
| and joint ventures    |  |             |  |             |  |          |  |             |  |             |  |          |  |
| accounted under       |  |             |  |             |  |          |  |             |  |             |  |          |  |
| equity method         |  |             |  |             |  |          |  |             |  |             |  |          |  |
+-----------------------+--+-------------+--+-------------+--+----------+--+-------------+--+-------------+--+----------+--+
| Finance income        |  |       9,382 |  |       3,914 |  |   13,296 |  |      19,783 |  |       5,474 |  |   25,257 |  |
+-----------------------+--+-------------+--+-------------+--+----------+--+-------------+--+-------------+--+----------+--+
| Finance costs         |  |     (18,833 | )|     (18,088 | )|  (36,921 | )|      (7,517 | )|         (71 | )|   (7,588 | )|
+-----------------------+--+-------------+--+-------------+--+----------+--+-------------+--+-------------+--+----------+--+
| Foreign exchange loss |  |      (7,161 | )|           - |  |   (7,161 | )|      (4,363 | )|           - |  |   (4,363 | )|
+-----------------------+--+-------------+--+-------------+--+----------+--+-------------+--+-------------+--+----------+--+
| Profit/(loss) from    |  |      61,442 |  |     (52,042 | )|    9,400 |  |     111,833 |  |       4,834 |  |  116,667 |  |
| continuing operations |  |             |  |             |  |          |  |             |  |             |  |          |  |
| before income tax     |  |             |  |             |  |          |  |             |  |             |  |          |  |
+-----------------------+--+-------------+--+-------------+--+----------+--+-------------+--+-------------+--+----------+--+
| Income tax expense    |  |     (29,762 | )|       6,848 |  |  (22,914 | )|     (34,453 | )|      (1,299 | )|  (35,752 | )|
+-----------------------+--+-------------+--+-------------+--+----------+--+-------------+--+-------------+--+----------+--+
| Profit/(loss) for the |  |      31,680 |  |     (45,194 | )|  (13,514 | )|      77,380 |  |       3,535 |  |   80,915 |  |
| year from continuing  |  |             |  |             |  |          |  |             |  |             |  |          |  |
| operations            |  |             |  |             |  |          |  |             |  |             |  |          |  |
+-----------------------+--+-------------+--+-------------+--+----------+--+-------------+--+-------------+--+----------+--+
| Attributable to:      |  |             |  |             |  |          |  |             |  |             |  |          |  |
+-----------------------+--+-------------+--+-------------+--+----------+--+-------------+--+-------------+--+----------+--+
| Equity shareholders   |  |      24,643 |  |     (43,646 | )|  (19,003 | )|      81,538 |  |       3,535 |  |   85,073 |  |
| of the Company        |  |             |  |             |  |          |  |             |  |             |  |          |  |
+-----------------------+--+-------------+--+-------------+--+----------+--+-------------+--+-------------+--+----------+--+
| Minority shareholders |  |       7,037 |  |      (1,548 | )|    5,489 |  |      (4,158 | )|           - |  |   (4,158 | )|
+-----------------------+--+-------------+--+-------------+--+----------+--+-------------+--+-------------+--+----------+--+
|                       |  |      31,680 |  |     (45,194 | )|  (13,514 | )|      77,380 |  |       3,535 |  |   80,915 |  |
+-----------------------+--+-------------+--+-------------+--+----------+--+-------------+--+-------------+--+----------+--+
| Basic and diluted     |  |        0.08 |  |       (0.14 | )|    (0.06 | )|        0.27 |  |        0.01 |  |     0.28 |  |
| earnings per ordinary |  |             |  |             |  |          |  |             |  |             |  |          |  |
| share from continuing |  |             |  |             |  |          |  |             |  |             |  |          |  |
| operations and for    |  |             |  |             |  |          |  |             |  |             |  |          |  |
| the year (expressed   |  |             |  |             |  |          |  |             |  |             |  |          |  |
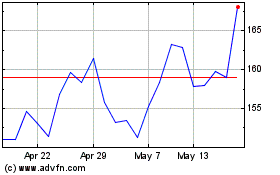
Hochschild Mining (LSE:HOC)
Historical Stock Chart
From Jul 2024 to Aug 2024

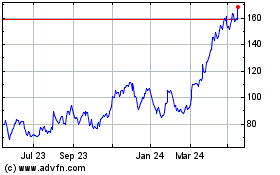
Hochschild Mining (LSE:HOC)
Historical Stock Chart
From Aug 2023 to Aug 2024
