Final Results -7-
March 25 2009 - 3:01AM
UK Regulatory
+-----------------------------------------------------+-------------------+-------------------+-----------+
| Cash costs ($/oz Au co-product)1                    |               469 |               212 |      121% |
+-----------------------------------------------------+-------------------+-------------------+-----------+
| Adjusted EBITDA2                                    |           142,292 |           147,606 |      (4%) |
+-----------------------------------------------------+-------------------+-------------------+-----------+
| Earnings per share                                  |             $0.08 |             $0.27 |     (70%) |
+-----------------------------------------------------+-------------------+-------------------+-----------+
| Cash flow from operating activities                 |            78,641 |            21,404 |      267% |
+-----------------------------------------------------+-------------------+-------------------+-----------+
| Reserve life of mine (years)3                       |               3.2 |               4.6 |     (30%) |
+-----------------------------------------------------+-------------------+-------------------+-----------+


1 Cash costs are calculated to include cost of sales, treatment charges, and
selling expenses less depreciation included in cost of sales. The calculation
used in 2007 has been adjusted to include: (i) the termination benefits of mine
workers (this amount was previously included in administrative expenses) and
(ii) a change in the allocation of depreciation and amortisation in cost of
sales.
2 Adjusted EBITDA is calculated as profit from continuing operations before
exceptional items, net finance income/(cost), foreign exchange (loss)/gain and
income tax plus depreciation, amortisation and exploration costs other than
personnel and other expenses.
3 Reserve life of mine relates to our underground operations. Moris, our only
open pit mine, has a different operational profile and is therefore not included


The reporting currency of Hochschild Mining plc is U.S. dollars. In our
discussion of financial performance we remove the effect of exceptional items,
unless otherwise indicated, and in our income statement we show the results both
pre and post such exceptional items. Exceptional items are those items, which
due to their nature or the expected infrequency of the events giving rise to
them, need to be disclosed separately on the face of the income statement to
enable a better understanding of the financial performance of the Group and to
facilitate comparison with prior years.


Revenue


Full year revenue from continuing operations, net of commercial discounts,
increased by 42% to $433.8 million (2007: $305.0 million), comprising silver
revenue of $264.1 million and gold revenue of $169.2 million. The increase was
mainly as a result of a higher amount of silver ounces sold and higher gold
prices. In 2008, silver accounted for 61% and gold for 39% of consolidated
revenue compared to 59% and 41% respectively in 2007. Gross revenue increased
46% to $463.4 million in 2008 (2007: $317.4 million).


Silver: Gross revenue from silver increased 52% in 2008 to $288.8 million (2007:
$190.5 million). This change reflects a 50% increase in total ounces sold,
partly offset by lower realised silver prices, which were down 2% year on year.
The total amount of silver ounces sold in 2008 was 20,593 koz (2007: 13,717
koz).


Gold: Gross revenue from gold increased 38% in 2008 to $174.6 million (2007:
$126.8 million). This change was a result of higher realised gold prices, up 35%
in 2008. The total amount of gold ounces sold in 2008 was 198.3 koz in 2008
(2007: 202.1 koz).


Commercial discounts: Commercial discounts mostly refer to refinery charges for
processing mineral ore and are discounted from revenue on a per tonne or per
ounce basis. In 2008, commercial discounts were $30.2 million representing a
127% increase on 2007. This was partly due to the Group producing a higher
amount of concentrate in 2008 resulting from a full year's production at both
Pallancata and San José (which commenced production in Q3 2007). In addition, we
incurred higher treatment charges for concentrate in most mines given the less
favourable market conditions. The ratio of commercial discounts to gross revenue
increased from 4% in 2007 to 7% in 2008.


Revenue by mine
+------------+----------+----------+--------+
| US$(000)   |     Year |     Year |      % |
| unless     |    ended |    ended | change |
| otherwise  |       31 |       31 |        |
| indicated  | December | December |        |
|            |     2008 |     2007 |        |
+------------+----------+----------+--------+
| Silver     |          |          |        |
| revenue    |          |          |        |
+------------+----------+----------+--------+
| Arcata     |  119,284 |   94,754 |        |
+------------+----------+----------+--------+
| Ares       |   38,196 |   38,078 |        |
+------------+----------+----------+--------+
| Selene     |   29,168 |   48,593 |        |
+------------+----------+----------+--------+
| Pallancata |   48,207 |    8,342 |        |
+------------+----------+----------+--------+
| San        |   52,942 |      744 |        |
| José       |          |          |        |
+------------+----------+----------+--------+
| Moris      |      992 |       26 |        |
+------------+----------+----------+--------+
| Commercial | (24,712) | (11,697) |   111% |
| discounts  |          |          |        |
+------------+----------+----------+--------+
| Net        |  264,077 |  178,840 |    48% |
| silver     |          |          |        |
| revenue    |          |          |        |
+------------+----------+----------+--------+
| Gold       |          |          |        |
| revenue    |          |          |        |
+------------+----------+----------+--------+
| Arcata     |   20,344 |   11,924 |        |
|            |          |          |        |
+------------+----------+----------+--------+
| Ares       |   67,899 |   97,469 |        |
+------------+----------+----------+--------+
| Selene     |    8,714 |   14,807 |        |
+------------+----------+----------+--------+
| Pallancata |   13,214 |    1,749 |        |
+------------+----------+----------+--------+
| San        |   40,095 |      532 |        |
| José       |          |          |        |
+------------+----------+----------+--------+
| Moris      |   24,380 |      347 |        |
+------------+----------+----------+--------+
| Commercial |  (5,423) |  (1,578) |   244% |
| discounts  |          |          |        |
+------------+----------+----------+--------+
| Net        |  169,223 |  125,250 |    35% |
| gold       |          |          |        |
| revenue    |          |          |        |
+------------+----------+----------+--------+
|            |          |          |        |
+------------+----------+----------+--------+
| Other      |      479 |      931 |  (49%) |
| revenue1   |          |          |        |
+------------+----------+----------+--------+
| Total      |  433,779 |  305,021 |    42% |
| revenue    |          |          |        |
+------------+----------+----------+--------+
|            |          |          |        |
+------------+----------+----------+--------+
1Other revenue includes revenue from base metal components in the concentrate
sold from the Arcata mine net of commercial discounts and revenue from sale of
energy.


Average realisable prices


Average realisable precious metals prices, which include commercial discounts,
for the twelve months to 31 December 2008 were $853.28/oz for gold and $12.82/oz
for silver. The average realisable price for the year was negatively impacted by
the significant fall in precious metals prices in the second half of 2008 when
silver decreased by an average of 39% and gold by 7%.


+--------+----------+----------+--------+
|        |   Twelve |   Twelve |      % |
|        |   months |   months | change |
|        |       to |       to |        |
|        |       31 |       31 |        |
|        | December | December |        |
|        |     2008 |     2007 |        |
+--------+----------+----------+--------+
| Silver |   $12.82 |   $13.08 |   (2%) |
| ($/oz) |          |          |        |
+--------+----------+----------+--------+
| Gold   |  $853.28 |  $634.30 |    35% |
| ($/oz) |          |          |        |
+--------+----------+----------+--------+


Forward sales contracts


The Group sold forward 778 koz of its silver 2008 production at $10.63/oz and
1.9 koz of its gold 2008 production at $840/oz. Both forward sales matured in
January 2009.


In addition, the Group has sold forward a total of 10.7 million ounces of its
2009 silver equivalent production comprised of 8.9 million ounces of silver at
an average price of $12.09/oz and 30.0 thousand ounces of gold at an average
price of $972/oz.


Of the total amount sold forward, 3.3 million silver ounces and 1.9 thousand
gold ounces were sold in December 2008 and the remaining 6.4 million silver
ounces and 30.0 thousand gold ounces were sold forward in Q1 2009.


None of 2010's production has been sold forward. At this time, management does
not plan to undertake any further forward sales contracts for 2009 production.


The decision to sell forward a portion of 2009 production was driven by the
desire for more stable cash flows which will fund operating capex and future
M&A. We remain positive about the long term prospects for silver and gold but in
light of current market conditions, we believe that it is prudent to focus on
cash preservation in the current financial year.


Costs


Management remains focused on cost control and during 2008 a series of
productivity measures were implemented including plant expansions, changes in
mining methods and procurement initiatives. This has enabled us to offset some
of the industry cost inflation experienced in 2008, which was particularly
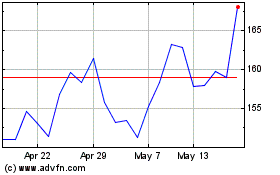
Hochschild Mining (LSE:HOC)
Historical Stock Chart
From Jun 2024 to Jul 2024

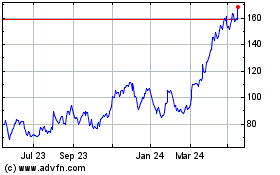
Hochschild Mining (LSE:HOC)
Historical Stock Chart
From Jul 2023 to Jul 2024
