and exceptional items                           13,102       -         13,102        (3,095)       -         (3,095) 
 
                                      7, 
 Exceptional operating expenses        16        (1,331)        (501)    (1,832)         (241)        (301)      (542) 
 
 Amortisation of intangible           5, 
  assets                               16              -      (5,930)   (5,930)              -      (6,367)    (6,367) 
 
 Profit on disposal of intangible 
  assets                                               -        5,195    5,195               -        3,543      3,543 
 
 Loss on disposal of property, 
  plant and equipment                               (96)       -          (96)           (120)       -           (120) 
                                            ------------  -----------  ---------  ------------  -----------  --------- 
 
 Operating profit / (loss)             5          11,675    (1,236)      10,439        (3,456)    (3,125)      (6,581) 
                                            ============  ===========             ============  =========== 
 
 Finance costs:                       11 
 Bank loans and overdrafts                                               (173)                                   (246) 
 Convertible Cumulative Preference 
  Shares                                                                 (527)                                   (544) 
                                                                       ---------                             --------- 
 
 Profit / (loss) before tax                                              9,739                                 (7,371) 
 
 Income tax expense                   12                                   -                                         - 
                                                                       ---------                             --------- 
 Profit / (loss) and total 
  comprehensive income for 
  the year                                                               9,739                                 (7,371) 
                                                                       =========                             ========= 
 
 Profit / (loss) attributable 
  to equity holders of the 
  parent                                                                 9,739                                 (7,371) 
                                                                       =========                             ========= 
 
 Total comprehensive income 
  attributable to equity holders 
  of the parent                                                          9,739                                 (7,371) 
                                                                       =========                             ========= 
 Basic earnings / (loss) per 
  Ordinary Share from continuing 
  operations and for the year         14                                 10.73p                                (8.17p) 
 
 Diluted earnings / (loss) 
  per share from continuing 
  operations and for the year         14                                 7.56p                                 (8.17p) 
 

CONSOLIDATED BALANCE SHEET

 
                                                                 2013        2012 
                                                    Notes      GBP000      GBP000 
 
Assets 
Non-current assets 
Property, plant and equipment                        15        52,456      53,452 
Intangible assets                                    16         9,798       7,333 
                                                           ---------- 
                                                               62,254      60,785 
                                                           ==========  ========== 
 
Current assets 
Inventories                                          18         1,734       2,160 
Trade and other receivables                          20         3,934       4,981 
Cash and cash equivalents                           21,29      14,348       8,198 
                                                           ---------- 
                                                               20,016      15,339 
                                                           ==========  ========== 
 
Total assets                                                   82,270      76,124 
                                                           ==========  ========== 
 
Equity 
Issued share capital                                 22        24,341      24,264 
Share premium                                        23        14,486      14,443 
Other reserve                                        23        21,222      21,222 
Capital reserve                                      23         2,650       2,630 
Accumulated losses                                   23      (20,142)    (29,881) 
                                                           ---------- 
Total equity                                                   42,557      32,678 
                                                           ==========  ========== 
 
Non-current liabilities 
Interest-bearing liabilities/bank loans              24        10,219      10,594 
Debt element of Convertible Cumulative Preference 
 Shares                                                         4,345       4,441 
Deferred income                                      27           119         121 
                                                           ----------  ---------- 
                                                               14,683      15,156 
                                                           ==========  ========== 
 
Current liabilities 
Trade and other payables                             25        14,048      15,069 
Current borrowings                                  24,25         489         493 
Provisions                                          25,26       1,240           - 
Deferred income                                      27         9,253      12,728 
 
                                                               25,030      28,290 
                                                           ==========  ========== 
 
Total liabilities                                              39,713      43,446 
                                                           ==========  ========== 


Total equity and liabilities                                   82,270      76,124 
                                                           ==========  ========== 
 

Approved by the Board on 23 September 2013

CONSOLIDATED STATEMENT OF CHANGES IN EQUITY

 
                                        Share     Share     Other   Capital   Retained 
  Group                               capital   premium   reserve   reserve   earnings    Total 
                                       GBP000    GBP000    GBP000    GBP000     GBP000   GBP000 
  Equity shareholders' 
   funds 
   as at 1 July 2011                   24,264    14,399    21,222     2,628   (22,510)   40,003 
 
    Share capital issued                    -        44         -         -          -       44 
 
    Transfer to capital 
    reserve                                 -         -         -         2          -        2 
 
    Loss and total comprehensive 
    income for the year                     -         -         -         -    (7,371)  (7,371) 
 
  Equity shareholders' 
   funds 
   as at 30 June 2012                  24,264    14,443    21,222     2,630   (29,881)   32,678 
 
  Share capital issued                      1        43         -         -          -       44 
 
    Transfer to capital 
    reserve                              (20)         -         -        20          -        - 
  Reduction in debt 
   element of convertible 
   cumulative preference 
   shares                                  96         -         -         -          -       96 
 
    Profit and total comprehensive 
    income for the year                     -         -         -         -      9,739    9,739 
 
  Equity shareholders' 
   funds 
   as at 30 June 2013                  24,341    14,486    21,222     2,650   (20,142)   42,557 
                                     --------  --------  --------  --------  ---------  ------- 
 

CONSOLIDATED CASH FLOW STATEMENT

 
                                                           2013            2012 
                                                Note      GBP000          GBP000 
 
 Cash flows from operating activities 
 Profit /(Loss) for the year                                   9,739         (7,371) 
 Depreciation                                    15            1,823           1,817 
 Amortisation of intangible assets               16            5,930           6,367 
 Impairment of property, plant and equipment     15               37               - 
 Impairment of intangible assets                 16              501             301 
 Profit on disposal of intangible assets         16          (5,195)         (3,543) 
 Loss on disposal of property, plant and 
  equipment                                                       96             120 
 Finance costs                                   11              700             790 
                                                      --------------  -------------- 
                                                              13,631         (1,519) 
 
 Decrease / (increase) in inventories                            426              90 
 Decrease / (increase) in receivables                          (510)             415 
 Decrease / (increase) in payables and 
  deferred income                                            (3,012)           2,552 
                                                      --------------  -------------- 
 Cash generated from operations                               10,535           1,538 
 Interest paid                                                 (173)           (246) 
                                                      --------------  -------------- 
 Net cash flow from operating activities 
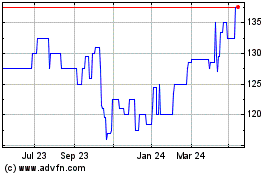
Celtic (LSE:CCP)
Historical Stock Chart
From Sep 2024 to Oct 2024 Click Here for more Celtic Charts.
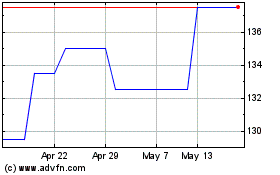
Celtic (LSE:CCP)
Historical Stock Chart
From Oct 2023 to Oct 2024 Click Here for more Celtic Charts.