Half Yearly Report -2-
September 28 2009 - 12:10PM
UK Regulatory
+----------------------------------------------+-------------+-------------+--------------+
| Defined benefit plan actuarial gains and     |          -  |          -  |      60,000  |
| losses                                       |             |             |              |
+----------------------------------------------+-------------+-------------+--------------+
|                                              |             |             |              |
+----------------------------------------------+-------------+-------------+--------------+
| Total comprehensive income for the period    |      9,520  |     90,933  |     747,701  |
+----------------------------------------------+-------------+-------------+--------------+


Condensed statement of charges in equity for the six months ended 30th June 2009
+------------------------+------------+------------+-------------+------------+------------+
|                        |    Share   |   Capital  | Translation |  Retained  |     Total  |
|                        |   Capital  |   Reserve  |             |  Earnings  |            |
|                        |            |            | Differences |            |            |
|                        |            |            |             |            |            |
+------------------------+------------+------------+-------------+------------+------------+
|                        |       GBP  |       GBP  |        GBP  |       GBP  |       GBP  |
+------------------------+------------+------------+-------------+------------+------------+
|                        |            |            |             |            |            |
+------------------------+------------+------------+-------------+------------+------------+
| Balance at 1st January |   360,000  |    77,319  |     (8,992) | 3,119,823  | 3,548,150  |
| 2008                   |            |            |             |            |            |
+------------------------+------------+------------+-------------+------------+------------+
|                        |            |            |             |            |            |
+------------------------+------------+------------+-------------+------------+------------+
| Total comprehensive    |         -  |         -  |    436,143  |   311,558  |   747,701  |
| income                 |            |            |             |            |            |
| for 2008               |            |            |             |            |            |
+------------------------+------------+------------+-------------+------------+------------+
|                        |            |            |             |            |            |
+------------------------+------------+------------+-------------+------------+------------+
| Balance at 31st        |   360,000  |    77,319  |    427,151  | 3,431,381  | 4,295,851  |
| December 2008          |            |            |             |            |            |
+------------------------+------------+------------+-------------+------------+------------+
|                        |            |            |             |            |            |
+------------------------+------------+------------+-------------+------------+------------+
| Balance at 1st January |   360,000  |    77,319  |    427,151  | 3,431,381  | 4,295,851  |
| 2009                   |            |            |             |            |            |
+------------------------+------------+------------+-------------+------------+------------+
|                        |            |            |             |            |            |
+------------------------+------------+------------+-------------+------------+------------+
| Dividends              |         -  |         -  |          -  |   (21,600) |   (21,600) |
+------------------------+------------+------------+-------------+------------+------------+
|                        |            |            |             |            |            |
+------------------------+------------+------------+-------------+------------+------------+
| Total comprehensive    |         -  |         -  |   (146,101) |   155,621  |     9,520  |
| income                 |            |            |             |            |            |
| for the six months to  |            |            |             |            |            |
| 30th                   |            |            |             |            |            |
| June 2009              |            |            |             |            |            |
+------------------------+------------+------------+-------------+------------+------------+
|                        |            |            |             |            |            |
+------------------------+------------+------------+-------------+------------+------------+
| Balance at 30th June   |   360,000  |    77,319  |    281,050  | 3,565,402  | 4,283,771  |
| 2009                   |            |            |             |            |            |
+------------------------+------------+------------+-------------+------------+------------+


Condensed consolidated balance sheet at 30th June 2009
+-------------------------------------------+-------------+-------------+--------------+
|                                           |  Unaudited  |  Unaudited  |     Year to  |
|                                           | 6 months to | 6 months to |         31st |
|                                           |             |             |     December |
|                                           |  30th June  |  30th June  |        2008  |
|                                           |       2009  |       2008  |              |
+-------------------------------------------+-------------+-------------+--------------+
|                                           |        GBP  |        GBP  |         GBP  |
+-------------------------------------------+-------------+-------------+--------------+
|                                           |             |             |              |
+-------------------------------------------+-------------+-------------+--------------+
|     Non-current assets                    |             |             |              |
+-------------------------------------------+-------------+-------------+--------------+
|     Property, plant and equipment         |    768,183  |    802,916  |     850,758  |
+-------------------------------------------+-------------+-------------+--------------+
|     Goodwill                              |     12,270  |          -  |      12,270  |
+-------------------------------------------+-------------+-------------+--------------+
|     Employee benefits                     |    111,000  |     74,000  |     140,000  |
+-------------------------------------------+-------------+-------------+--------------+
|                                           |             |             |              |
+-------------------------------------------+-------------+-------------+--------------+
|     Total non-current assets              |    891,453  |    876,916  |   1,003,028  |
+-------------------------------------------+-------------+-------------+--------------+
|                                           |             |             |              |
+-------------------------------------------+-------------+-------------+--------------+
|     Current assets                        |             |             |              |
+-------------------------------------------+-------------+-------------+--------------+
|     Inventories                           |  3,072,095  |  2,656,962  |   3,344,011  |
+-------------------------------------------+-------------+-------------+--------------+
|     Trade and other receivables           |  3,160,953  |  3,315,784  |   2,644,375  |
+-------------------------------------------+-------------+-------------+--------------+
|     Cash and cash equivalents             |  1,571,485  |  1,419,603  |   1,753,273  |
+-------------------------------------------+-------------+-------------+--------------+
|                                           |             |             |              |
+-------------------------------------------+-------------+-------------+--------------+
|     Total current assets                  |  7,804,533  |  7,392,349  |   7,741,659  |
+-------------------------------------------+-------------+-------------+--------------+
|                                           |             |             |              |
+-------------------------------------------+-------------+-------------+--------------+
|     Total assets                          |  8,695,986  |  8,269,265  |   8,744,687  |
+-------------------------------------------+-------------+-------------+--------------+
|                                           |             |             |              |
+-------------------------------------------+-------------+-------------+--------------+
|     Current liabilities                   |             |             |              |
+-------------------------------------------+-------------+-------------+--------------+
|     Bank overdraft                        |  1,561,734  |  1,368,047  |   1,785,513  |
+-------------------------------------------+-------------+-------------+--------------+
|     Trade and other payables              |  2,275,414  |  2,604,927  |   1,954,625  |
+-------------------------------------------+-------------+-------------+--------------+
|     Other financial liabilities           |    277,523  |    273,114  |     306,746  |
+-------------------------------------------+-------------+-------------+--------------+
|     Corporation tax liability             |     60,519  |     34,882  |     112,413  |
+-------------------------------------------+-------------+-------------+--------------+
|                                           |             |             |              |
+-------------------------------------------+-------------+-------------+--------------+
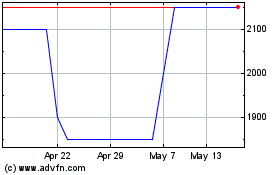
Braime (LSE:BMTO)
Historical Stock Chart
From Jan 2025 to Feb 2025

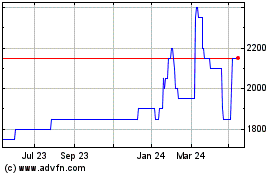
Braime (LSE:BMTO)
Historical Stock Chart
From Feb 2024 to Feb 2025
