Half Yearly Report -4-
September 28 2009 - 12:10PM
UK Regulatory
+-------------------------------------------+-------------+-------------+-------------+
|                                           |    (54,984) |     31,809  |     20,613  |
+-------------------------------------------+-------------+-------------+-------------+
|                                           |             |             |             |
+-------------------------------------------+-------------+-------------+-------------+
| Financing activities                      |             |             |             |
+-------------------------------------------+-------------+-------------+-------------+
| Repayment of hire purchase creditors      |    (58,112) |    (47,597) |   (107,513) |
+-------------------------------------------+-------------+-------------+-------------+
| Interest paid                             |    (36,284) |    (60,247) |   (111,924) |
+-------------------------------------------+-------------+-------------+-------------+
| Loan received                             |          -  |     42,300  |          -  |
+-------------------------------------------+-------------+-------------+-------------+
| Dividend paid                             |    (21,600) |          -  |          -  |
+-------------------------------------------+-------------+-------------+-------------+
|                                           |             |             |             |
+-------------------------------------------+-------------+-------------+-------------+
|                                           |   (115,996) |    (65,544) |   (219,437) |
+-------------------------------------------+-------------+-------------+-------------+
|                                           |             |             |             |
+-------------------------------------------+-------------+-------------+-------------+
| Increase/(decrease) in cash and cash      |     41,991  |    (54,500) |   (138,306) |
| equivalents                               |             |             |             |
+-------------------------------------------+-------------+-------------+-------------+
| Cash and cash equivalents (including      |    (32,240) |    106,066  |    106,066  |
| overdrafts), beginning of period          |             |             |             |
+-------------------------------------------+-------------+-------------+-------------+
|                                           |             |             |             |
+-------------------------------------------+-------------+-------------+-------------+
| Cash and cash equivalents (including      |      9,751  |     51,566  |    (32,240) |
| overdrafts), end of period                |             |             |             |
+-------------------------------------------+-------------+-------------+-------------+


Notes to the interim financial report
1.Accounting policies
Basis of preparation
The interim financial report has been prepared using accounting policies that
are consistent with those used in the preparation of the full financial
statements to 31st December 2008 and those which management expects to apply in
the group's full financial statement to 31st December 2009.


This interim financial report is unaudited. The comparative financial
information set out in this interim financial report does not constitute the
group's statutory accounts for the period ended 31st December 2008 but is
derived from the accounts. Statutory accounts for the period ended 31st December
2008 have been delivered to the Registrar of Companies. The auditors have
reported on those accounts. Their audit report was unqualified and did not
contain any statements under Section 237(2) or (3) Companies Act 1985.


The group's condensed interim financial information has been prepared in
accordance with International Financial Reporting Standards ("IFRS") as adopted
for the use in the European Union and in accordance with IAS 34 "Interim
Financial Reporting" and the accounting policies included in the Annual Report
for the year ended 31st December 2008, which have been applied consistently
throughout the current and preceding periods with the exception of new standards
adopted in the current period (see below).


Changes in accounting policy
The group has adopted IFRS 8 "Operating Segments" for the first time in this
Interim Report. This standard requires the group to report segmental information
on the basis of internal reports which are regularly reviewed by the group board
and used to allocate the resources of the business, and supersedes IAS 14
"Segment Reporting". The group has also adopted IAS 1 "Presentation of Financial
Statements" (revised 2007) for the first time in this Interim Report. The
amendments arising from this require the inclusion of the Condensed Consolidated
Statement of Changes in Equity as a primary statement in the condensed interim
financial information. The group has complied fully with the requirements of
IFRS 8 and IAS 1 in the period, which apply to disclosure matters only, and has
presented updated prior year comparatives in accordance with these standards.

2. Segmental information
+--------------------------+-------------+---------------+--------------+-------------+
|                          |                    Unaudited 6 months to 30th June 2009  |
+--------------------------+----------------------------------------------------------+
|                          |    Central  | Manufacturing | Distribution |      Total  |
|                          |             |               |              |             |
+--------------------------+-------------+---------------+--------------+-------------+
|                          |        GBP  |          GBP  |         GBP  |        GBP  |
+--------------------------+-------------+---------------+--------------+-------------+
|                          |             |               |              |             |
+--------------------------+-------------+---------------+--------------+-------------+
| Revenue                  |             |               |              |             |
+--------------------------+-------------+---------------+--------------+-------------+
| External                 |          -  |      746,123  |   7,021,591  |  7,767,714  |
+--------------------------+-------------+---------------+--------------+-------------+
| Inter company            |     29,816  |      983,395  |     322,611  |  1,335,822  |
+--------------------------+-------------+---------------+--------------+-------------+
|                          |             |               |              |             |
+--------------------------+-------------+---------------+--------------+-------------+
| Total revenue            |     29,816  |    1,729,518  |   7,344,202  |  9,103,536  |
+--------------------------+-------------+---------------+--------------+-------------+
|                          |             |               |              |             |
+--------------------------+-------------+---------------+--------------+-------------+
| Profit                   |             |               |              |             |
+--------------------------+-------------+---------------+--------------+-------------+
| Operating profit/(loss)  |    (26,819) |     (324,552) |     602,106  |    250,735  |
+--------------------------+-------------+---------------+--------------+-------------+
| Finance costs (net)      |     (3,653) |      (19,543) |     (11,399) |    (34,595) |
+--------------------------+-------------+---------------+--------------+-------------+
| Tax expense              |          -  |            -  |     (60,519) |    (60,519) |
+--------------------------+-------------+---------------+--------------+-------------+
| Re-allocated             |     30,472  |      (54,000) |      23,528  |          -  |
+--------------------------+-------------+---------------+--------------+-------------+
|                          |             |               |              |             |
+--------------------------+-------------+---------------+--------------+-------------+
| Total profit             |          -  |     (398,095) |     553,716  |    155,621  |
+--------------------------+-------------+---------------+--------------+-------------+


+--------------------------+-------------+---------------+--------------+-------------+
|                          |                    Unaudited 6 months to 30th June 2008  |
+--------------------------+----------------------------------------------------------+
|                          |    Central  | Manufacturing | Distribution |      Total  |
|                          |             |               |              |             |
+--------------------------+-------------+---------------+--------------+-------------+
|                          |        GBP  |          GBP  |         GBP  |        GBP  |
+--------------------------+-------------+---------------+--------------+-------------+
|                          |             |               |              |             |
+--------------------------+-------------+---------------+--------------+-------------+
| Revenue                  |             |               |              |             |
+--------------------------+-------------+---------------+--------------+-------------+
| External                 |          -  |    1,654,513  |   5,623,051  |  7,277,564  |
+--------------------------+-------------+---------------+--------------+-------------+
| Inter company            |     24,543  |      874,732  |     319,146  |  1,218,421  |
+--------------------------+-------------+---------------+--------------+-------------+
|                          |             |               |              |             |
+--------------------------+-------------+---------------+--------------+-------------+
| Total revenue            |     24,543  |    2,529,245  |   5,942,197  |  8,495,985  |
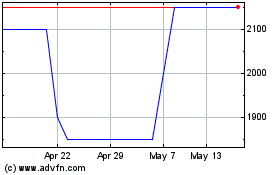
Braime (LSE:BMTO)
Historical Stock Chart
From Jan 2025 to Feb 2025

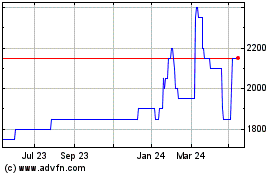
Braime (LSE:BMTO)
Historical Stock Chart
From Feb 2024 to Feb 2025
