Form 6-K - Report of foreign issuer [Rules 13a-16 and 15d-16]
June 11 2024 - 6:00AM
Edgar (US Regulatory)
UNITED STATES
SECURITIES AND EXCHANGE COMMISSION
Washington,
D.C. 20549
FORM 6-K
REPORT OF FOREIGN PRIVATE ISSUER
PURSUANT TO RULE 13a-16 OR 15d-16 OF
THE SECURITIES EXCHANGE ACT OF 1934
June 11, 2024
Commission file number:
1-14251
SAP SE
(Exact name of registrant as specified in its charter)
SAP EUROPEAN COMPANY
(Translation of registrant's name into English)
Dietmar-Hopp-Allee 16
69190 Walldorf
Federal
Republic of Germany
(Address of principal executive offices)
Indicate by check mark whether the registrant files or will file annual
reports under cover of Form 20-F or Form 40-F.
Form 20-F x Form 40-F ¨
Indicate by check mark whether the registrant by furnishing the information
contained in this Form is also thereby furnishing the information to the Commission pursuant to Rule 12g3-2(b) under the
Securities Exchange Act of 1934.
Yes ¨ No x
If "Yes" is marked, indicate below the file number assigned
to the registrant in connection with Rule 12g3-2(b): 82-¨.
SAP SE
FORM 6-K
On June 5, 2024, SAP SE (“SAP”) delivered a presentation
to financial analysts and investors at SAP’s Sapphire Financial Analyst Conference. A copy of the slides used in the presentation
by Christian Klein, Scott Russell, and Dominik Asam is attached hereto as Exhibit 99.1.
Any statements contained in this document that are not historical facts
are forward-looking statements as defined in the U.S. Private Securities Litigation Reform Act of 1995. Words such as "anticipate,"
"believe," "estimate," "expect," "forecast," "intend," "may," "plan,"
"project," "predict," "should" and "will" and similar expressions as they relate to SAP are intended
to identify such forward-looking statements. SAP undertakes no obligation to publicly update or revise any forward-looking statements.
All forward-looking statements are subject to various risks and uncertainties that could cause actual results to differ materially from
expectations. The factors that could affect SAP's future financial results are discussed more fully in SAP's filings with the U.S. Securities
and Exchange Commission (the "SEC"), including SAP's most recent Annual Report on Form 20-F filed with the SEC. Readers
are cautioned not to place undue reliance on these forward-looking statements, which speak only as of their dates.
EXHIBITS
SIGNATURES
Pursuant to the requirements of the Securities Exchange Act of 1934,
the registrant has duly caused this report to be signed on its behalf by the undersigned, thereunto duly authorized.
| |
SAP SE |
| |
(Registrant) |
| |
|
| |
By: |
/s/
Christopher Sessar |
| |
|
Name: |
Dr. Christopher Sessar |
| |
|
Title: |
Chief Accounting Officer |
| |
|
| |
By: |
/s/
Julia Zicke |
| |
|
Name: |
Dr. Julia Zicke |
| |
|
Title: |
Head of External Reporting and Accounting Technology |
Date: June 11, 2024
| 8D2A00 840606 9B015D 7800A4 2C13AD 1E592F 035663 0040B0 223548
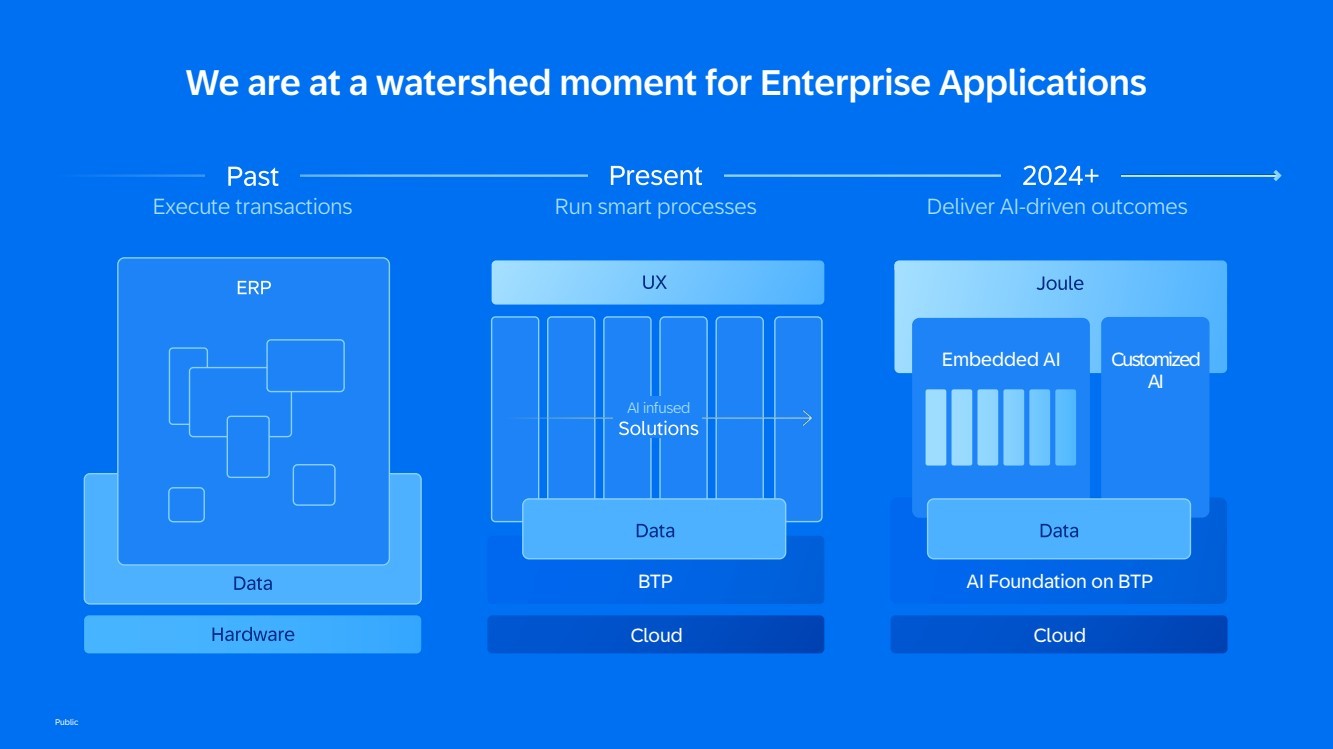
We are at a watershed moment for Enterprise Applications
Public
Cloud
BTP AI Foundation on BTP
Embedded AI Customized
AI
Cloud
AI infused
Execute transactions Run smart processes Deliver AI-driven outcomes |
| 8D2A00 840606 9B015D 7800A4 2C13AD 1E592F 035663 0040B0 223548
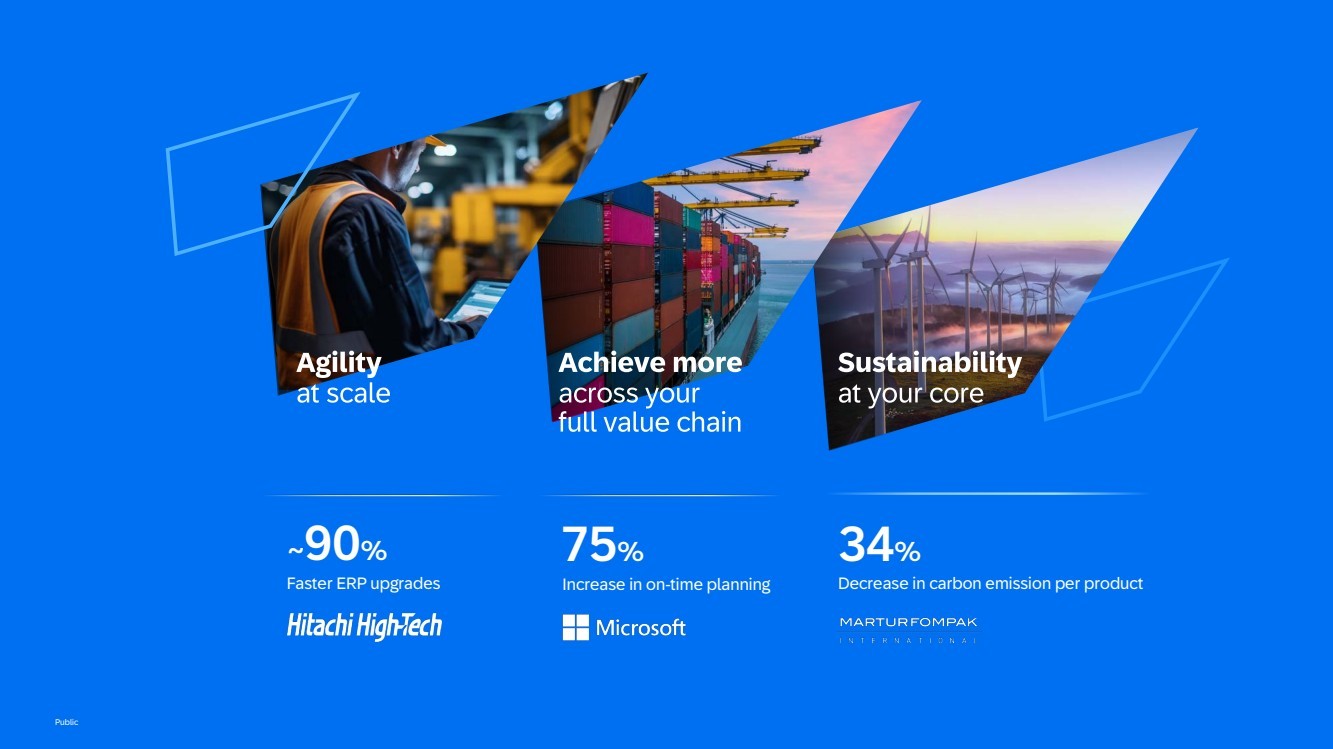
75%
Increase in on-time planning
34%
Decrease in carbon emission per product
Public
~90%
Faster ERP upgrades |
| Public
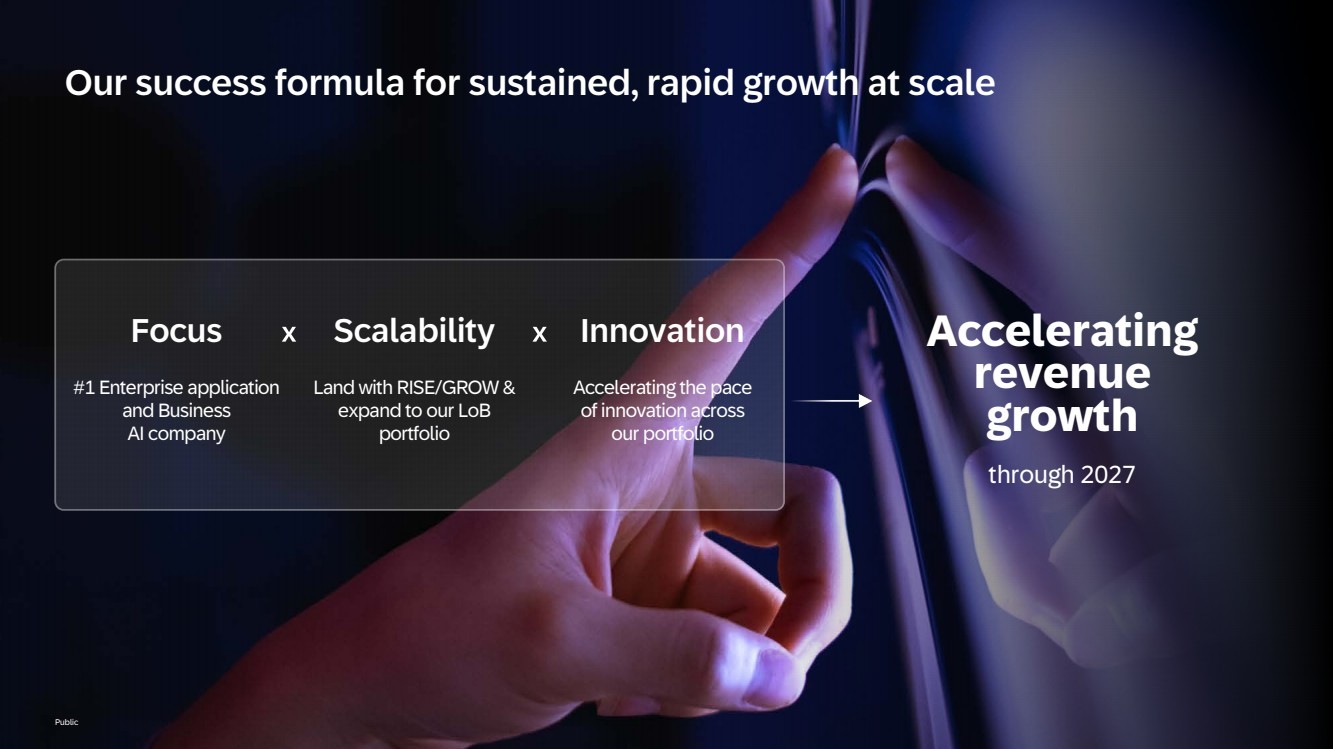
Our success formula for sustained, rapid growth at scale
Accelerating
revenue
growth
through 2027
Land with RISE/GROW &
expand to our LoB
portfolio
Scalability
#1 Enterprise application
and Business
AI company
Focus
Accelerating the pace
of innovation across
our portfolio
Innovation
Public |
| Public
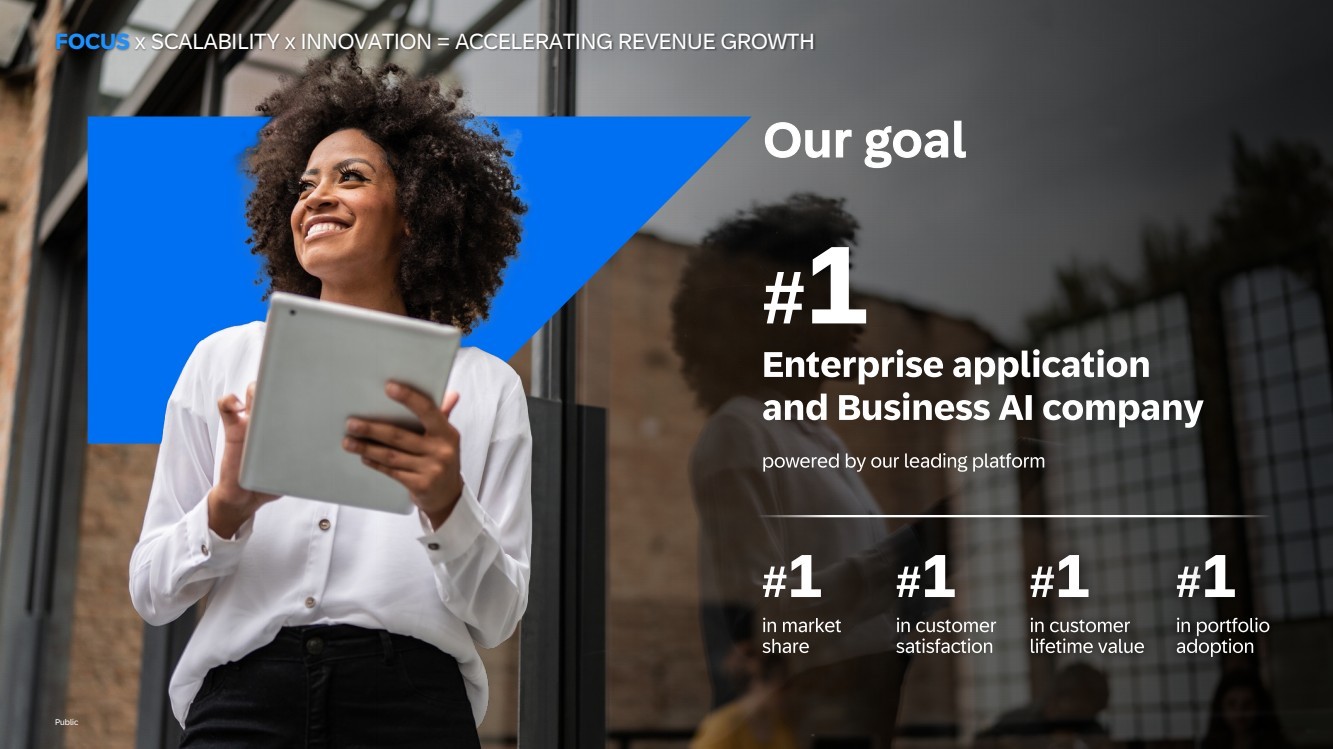
FOCUS x SCALABILITY x INNOVATION = ACCELERATING REVENUE GROWTH
Our goal
Public |
| Public
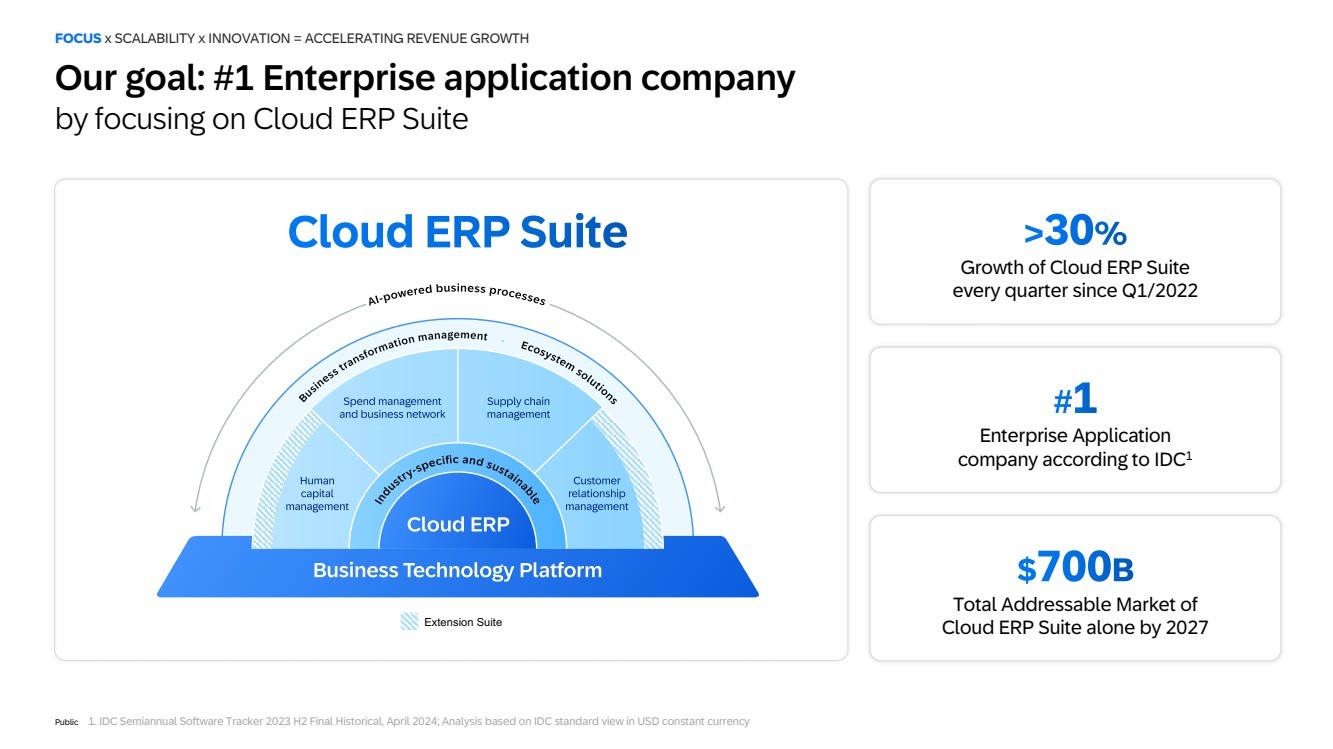
Our goal: #1 Enterprise application company
by focusing on Cloud ERP Suite
Enterprise Application
company according to IDC1
Growth of Cloud ERP Suite
every quarter since Q1/2022
Total Addressable Market of
Cloud ERP Suite alone by 2027
1. IDC Semiannual Software Tracker 2023 H2 Final Historical, April 2024; Analysis based on IDC standard view in USD constant currency
FOCUS x SCALABILITY x INNOVATION = ACCELERATING REVENUE GROWTH
Extension Suite |
| Public
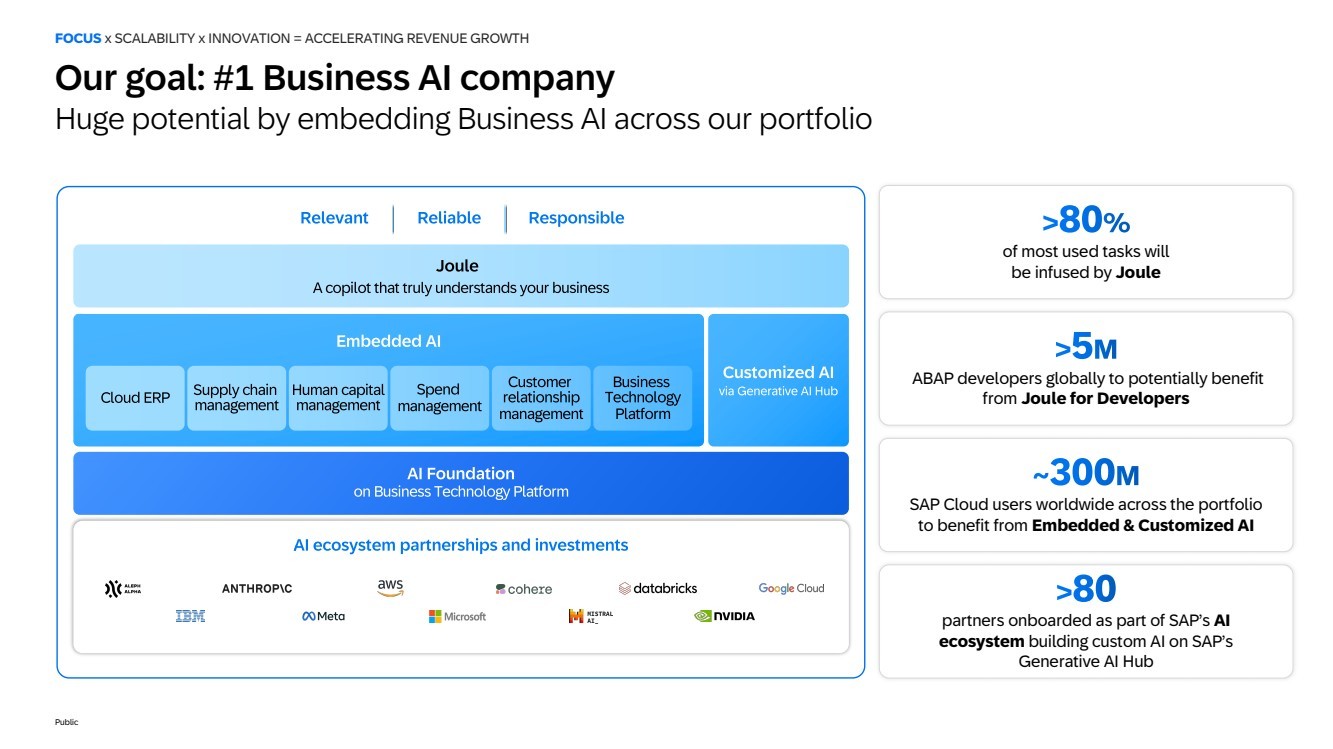
Our goal: #1 Business AI company
Huge potential by embedding Business AI across our portfolio
SAP Cloud users worldwide across the portfolio
to benefit from Embedded & Customized AI
partners onboarded as part of SAP’s AI
ecosystem building custom AI on SAP’s
Generative AI Hub
ABAP developers globally to potentially benefit
from Joule for Developers
of most used tasks will
be infused by Joule
FOCUS x SCALABILITY x INNOVATION = ACCELERATING REVENUE GROWTH |
| Public
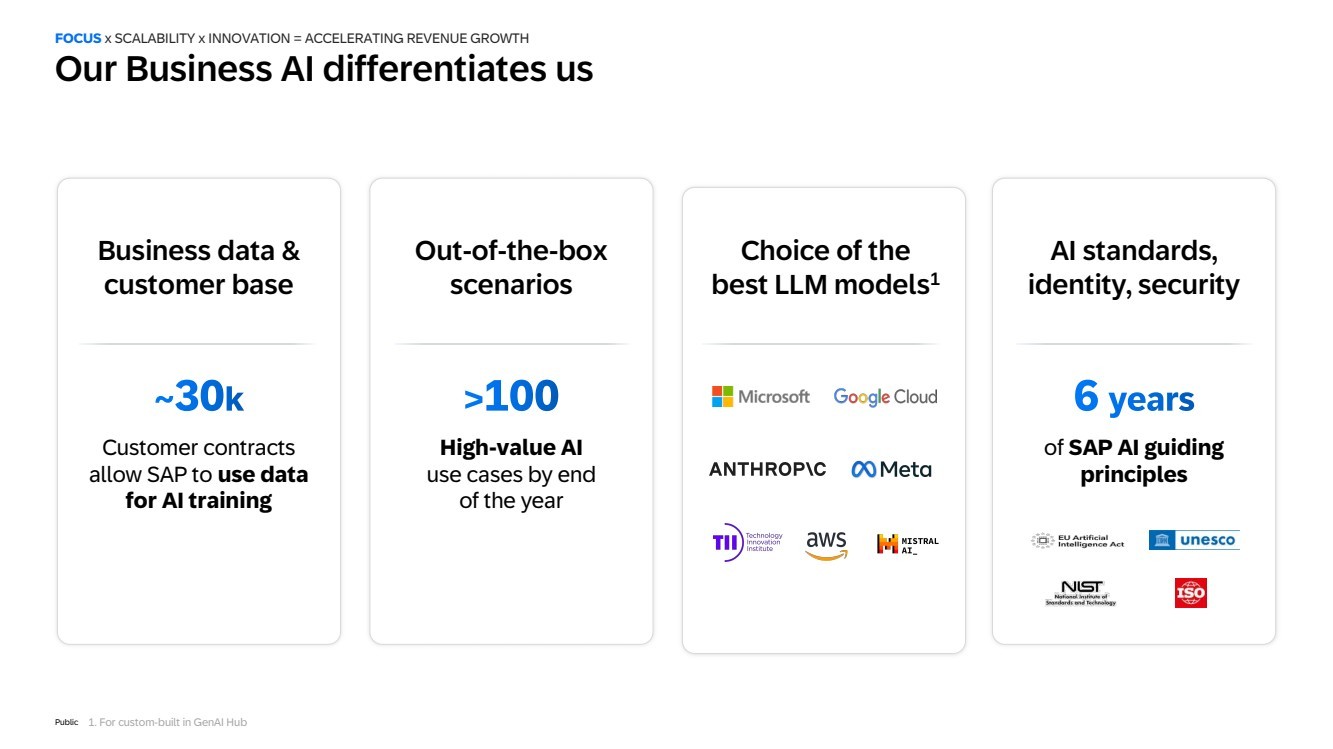
Customer contracts
allow SAP to use data
for AI training
Business data &
customer base
Out-of-the-box
scenarios
High-value AI
use cases by end
of the year
Choice of the
best LLM models1
AI standards,
identity, security
1. For custom-built in GenAI Hub
of SAP AI guiding
principles
Our Business AI differentiates us
FOCUS x SCALABILITY x INNOVATION = ACCELERATING REVENUE GROWTH |
| Public
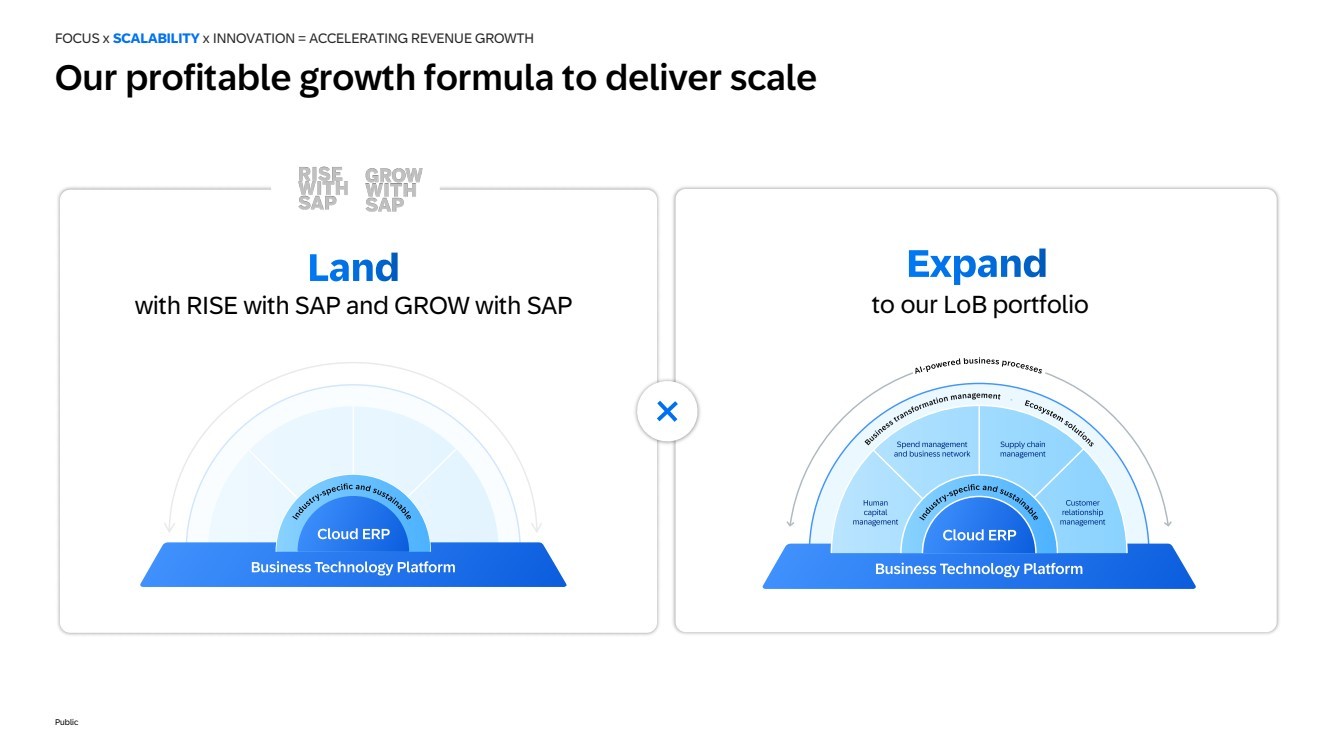
with RISE with SAP and GROW with SAP to our LoB portfolio
Our profitable growth formula to deliver scale
FOCUS x SCALABILITY x INNOVATION = ACCELERATING REVENUE GROWTH |
| Public
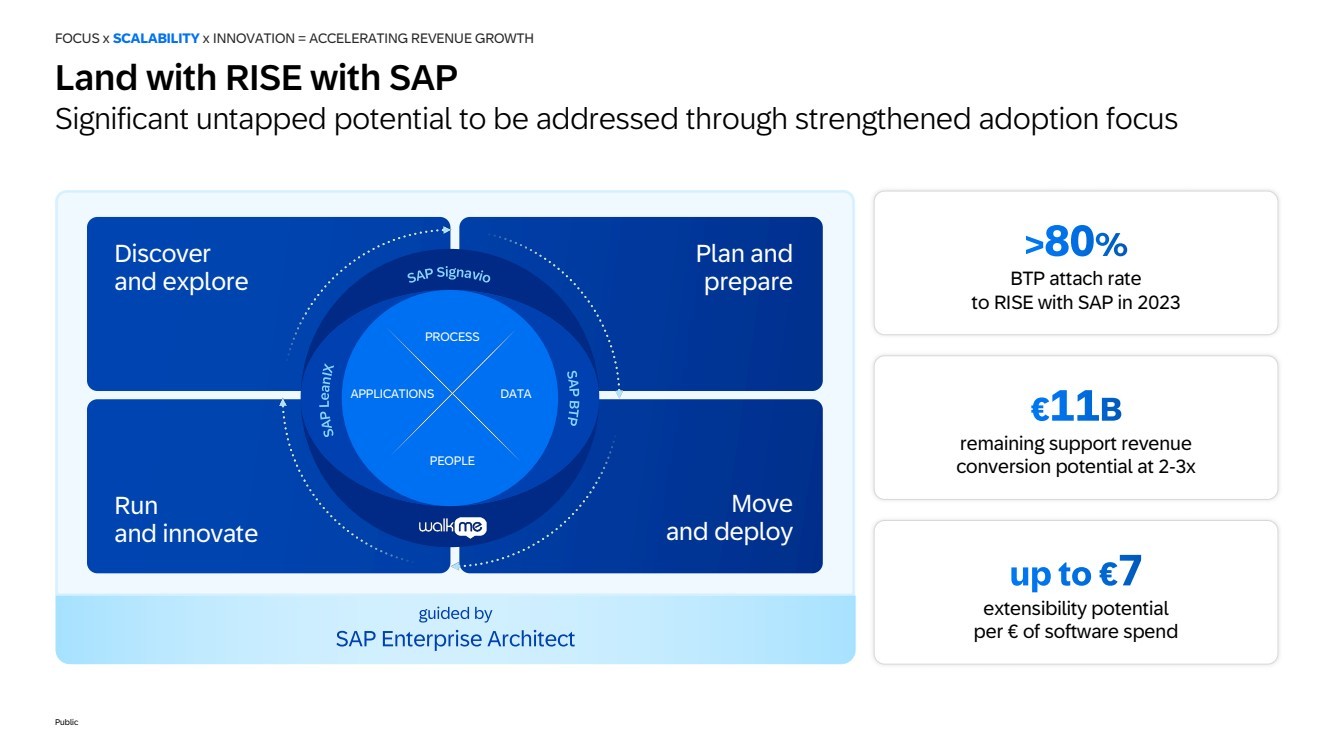
extensibility potential
per € of software spend
remaining support revenue
conversion potential at 2-3x
BTP attach rate
to RISE with SAP in 2023
Land with RISE with SAP
Significant untapped potential to be addressed through strengthened adoption focus
Run
and innovate
Discover
and explore
Move
and deploy
Plan and
prepare
PROCESS
DATA
PEOPLE
APPLICATIONS
FOCUS x SCALABILITY x INNOVATION = ACCELERATING REVENUE GROWTH |
| Public
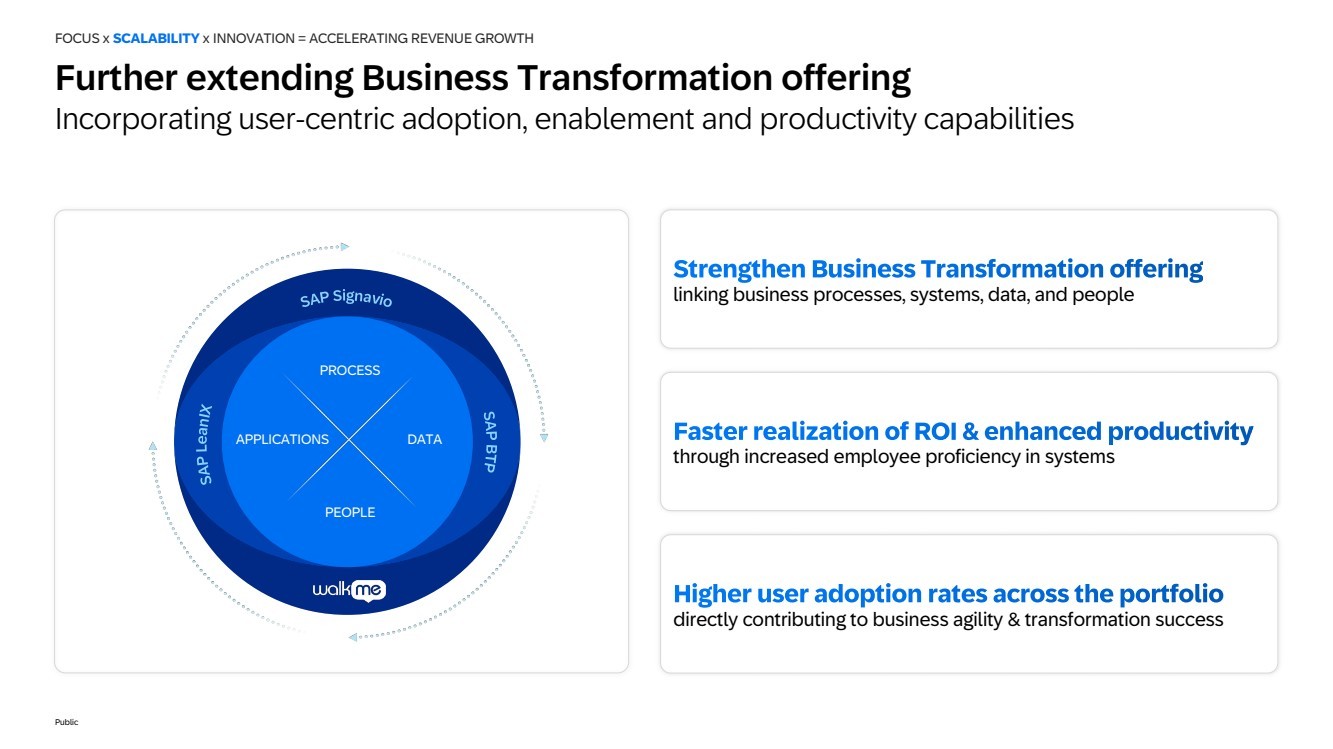
linking business processes, systems, data, and people
through increased employee proficiency in systems
directly contributing to business agility & transformation success
PROCESS
DATA
PEOPLE
APPLICATIONS
Further extending Business Transformation offering
Incorporating user-centric adoption, enablement and productivity capabilities
FOCUS x SCALABILITY x INNOVATION = ACCELERATING REVENUE GROWTH |
| Public
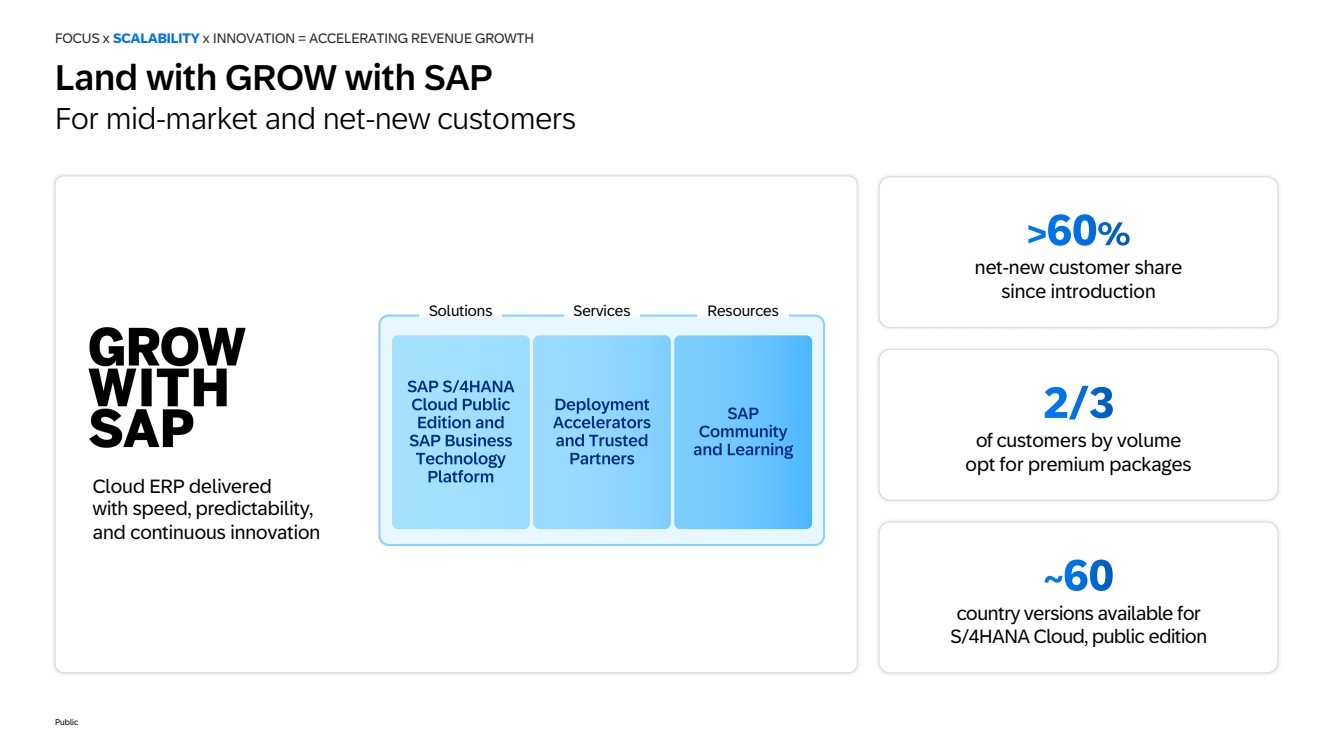
of customers by volume
opt for premium packages
net-new customer share
since introduction
country versions available for
S/4HANA Cloud, public edition
Land with GROW with SAP
For mid-market and net-new customers
FOCUS x SCALABILITY x INNOVATION = ACCELERATING REVENUE GROWTH
Cloud ERP delivered
with speed, predictability,
and continuous innovation
Solutions Services Resources |
| Public
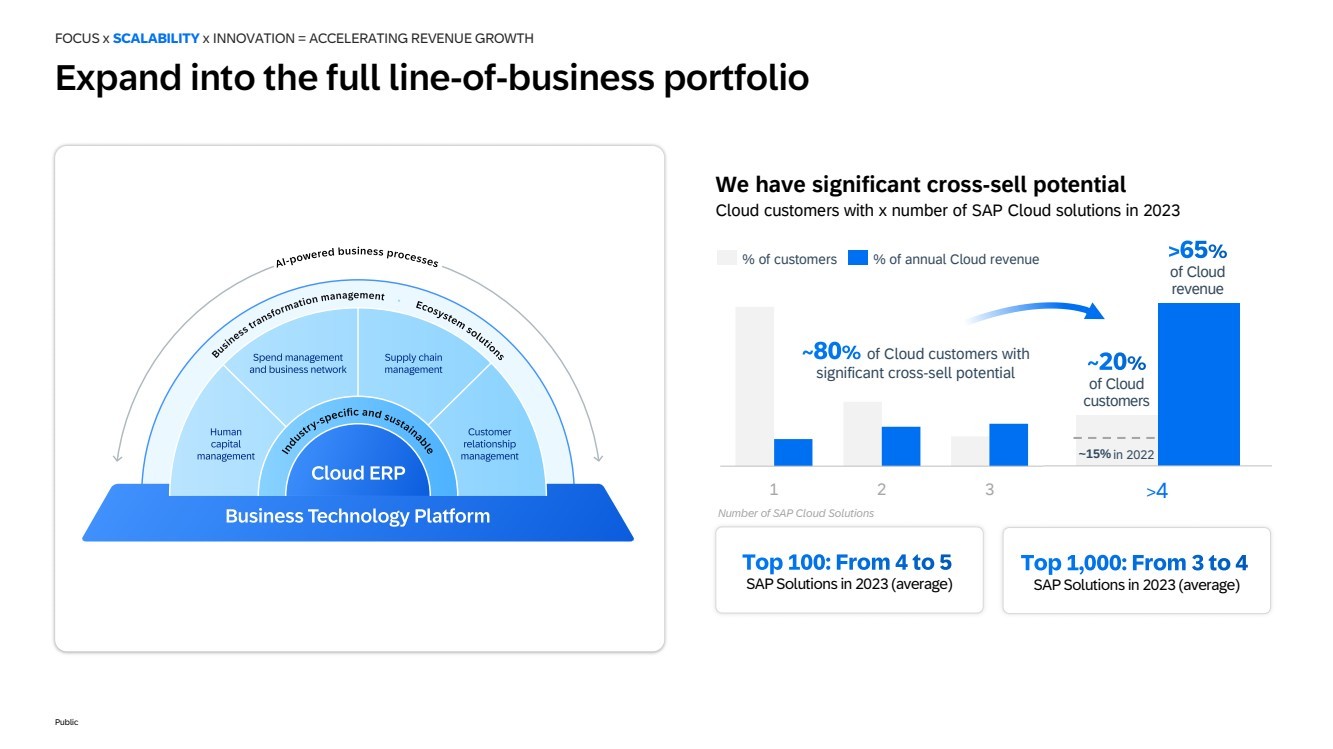
We have significant cross-sell potential
1 2 >4
of Cloud customers with
significant cross-sell potential
of Cloud
revenue
of Cloud
customers
% of customers % of annual Cloud revenue
Cloud customers with x number of SAP Cloud solutions in 2023
~15% in 2022
SAP Solutions in 2023 (average) SAP Solutions in 2023 (average)
3
Expand into the full line-of-business portfolio
FOCUS x SCALABILITY x INNOVATION = ACCELERATING REVENUE GROWTH
Number of SAP Cloud Solutions |
| Public
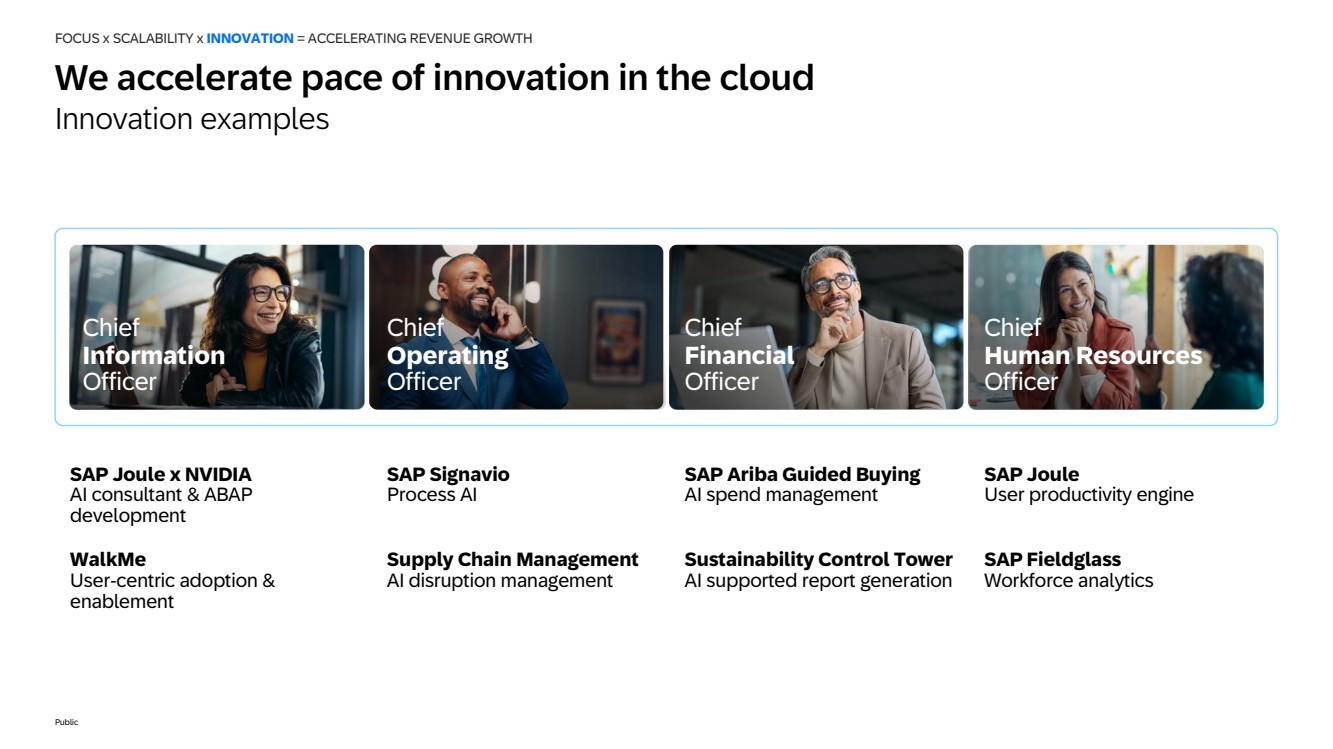
We accelerate pace of innovation in the cloud
Innovation examples
FOCUS x SCALABILITY x INNOVATION = ACCELERATING REVENUE GROWTH
SAP Joule x NVIDIA
AI consultant & ABAP
development
WalkMe
User-centric adoption &
enablement
Supply Chain Management
AI disruption management
SAP Signavio
Process AI
SAP Ariba Guided Buying
AI spend management
SAP Joule
User productivity engine
SAP Fieldglass
Workforce analytics
Chief
Information
Officer
Chief
Operating
Officer
Chief
Financial
Officer
Chief
Human Resources
Officer
Sustainability Control Tower
AI supported report generation |
| Public
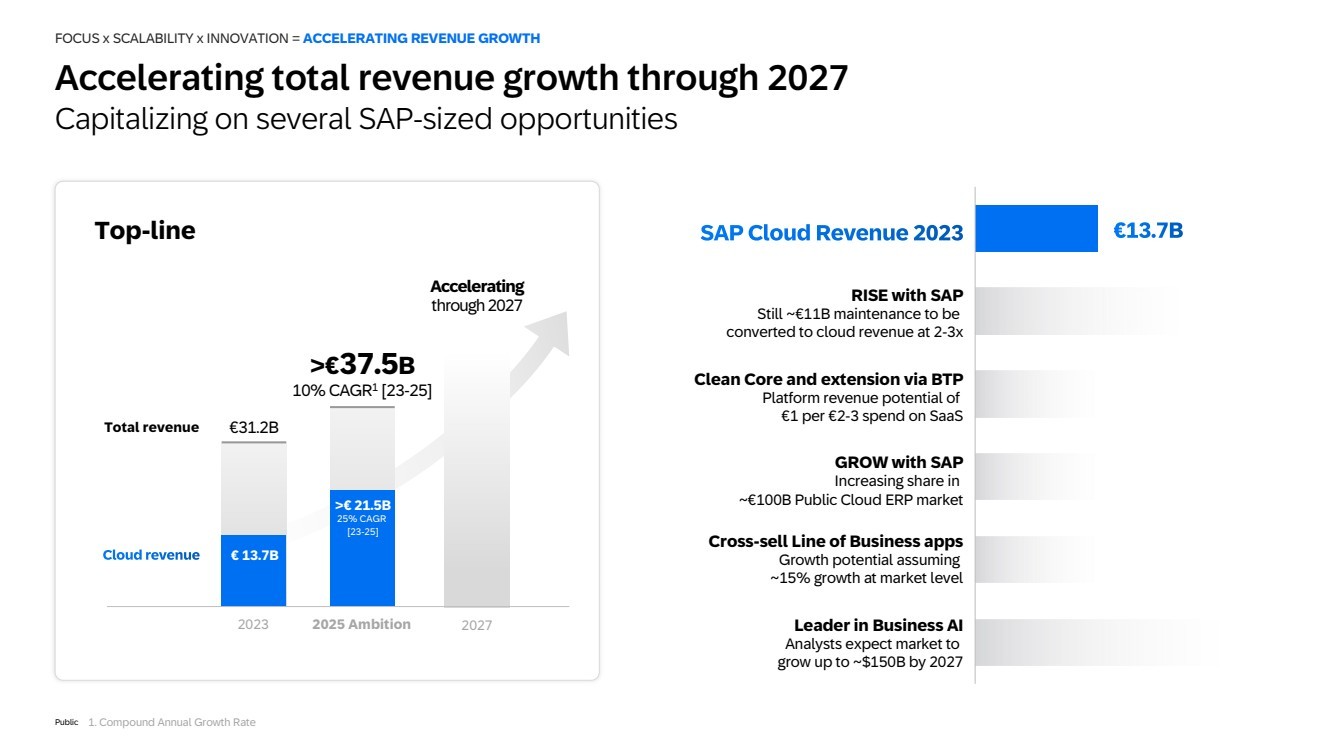
RISE with SAP
Still ~€11B maintenance to be
converted to cloud revenue at 2-3x
GROW with SAP
Increasing share in
~€100B Public Cloud ERP market
Clean Core and extension via BTP
Platform revenue potential of
€1 per €2-3 spend on SaaS
Cross-sell Line of Business apps
Growth potential assuming
~15% growth at market level
Leader in Business AI
Analysts expect market to
grow up to ~$150B by 2027
Top-line
Total revenue €31.2B
2023 2025 Ambition
>€37.5B
10% CAGR1 [23-25]
>€ 21.5B
25% CAGR
[23-25]
Accelerating
through 2027
€ 13.7B
2027
Accelerating total revenue growth through 2027
Capitalizing on several SAP-sized opportunities
FOCUS x SCALABILITY x INNOVATION = ACCELERATING REVENUE GROWTH
1. Compound Annual Growth Rate |
| Public
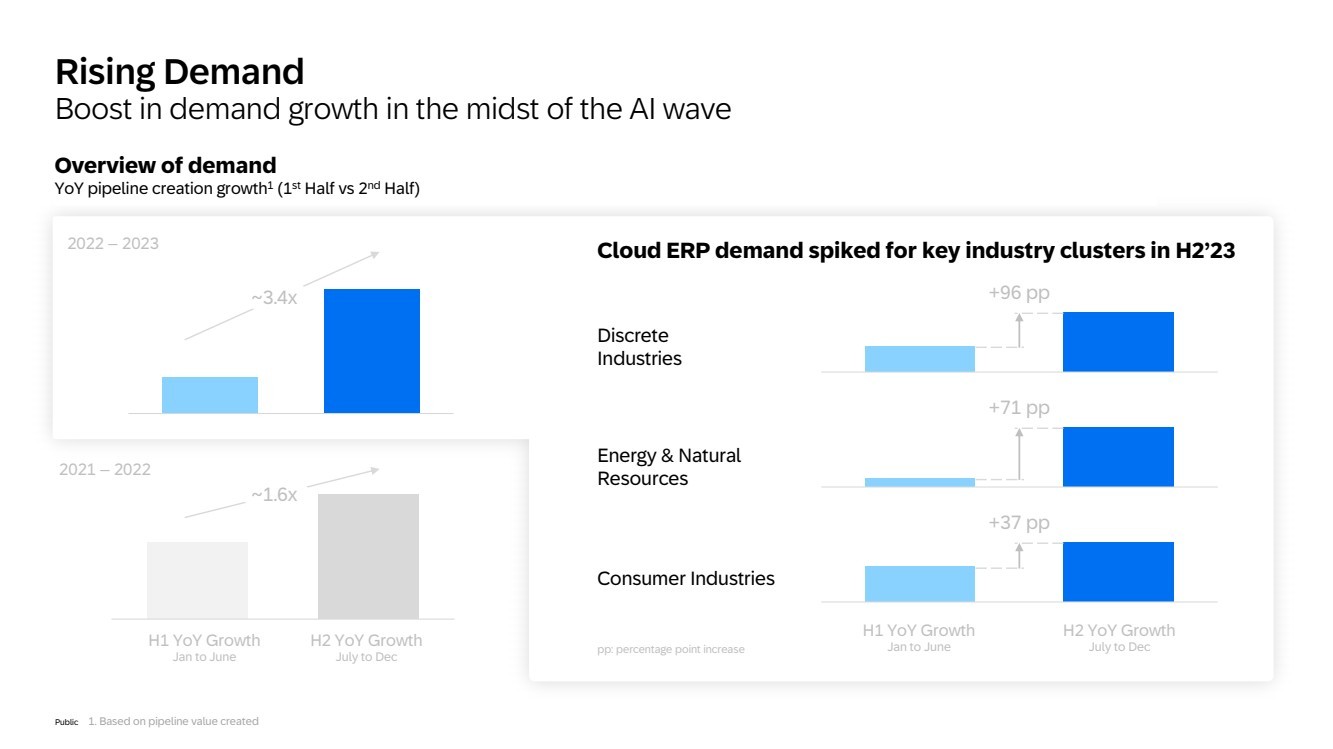
Overview of demand
YoY pipeline creation growth1 (1st Half vs 2nd Half)
~3.4x
~1.6x
Cloud ERP demand spiked for key industry clusters in H2’23
+96 pp
+37 pp
+71 pp
Discrete
Industries
Energy & Natural
Resources
Consumer Industries
H1 YoY Growth
Jan to June
H2 YoY Growth
July to Dec
H1 YoY Growth
Jan to June
H2 YoY Growth
pp: percentage point increase July to Dec
2021 – 2022
2022 – 2023
1. Based on pipeline value created
Rising Demand
Boost in demand growth in the midst of the AI wave |
| Public
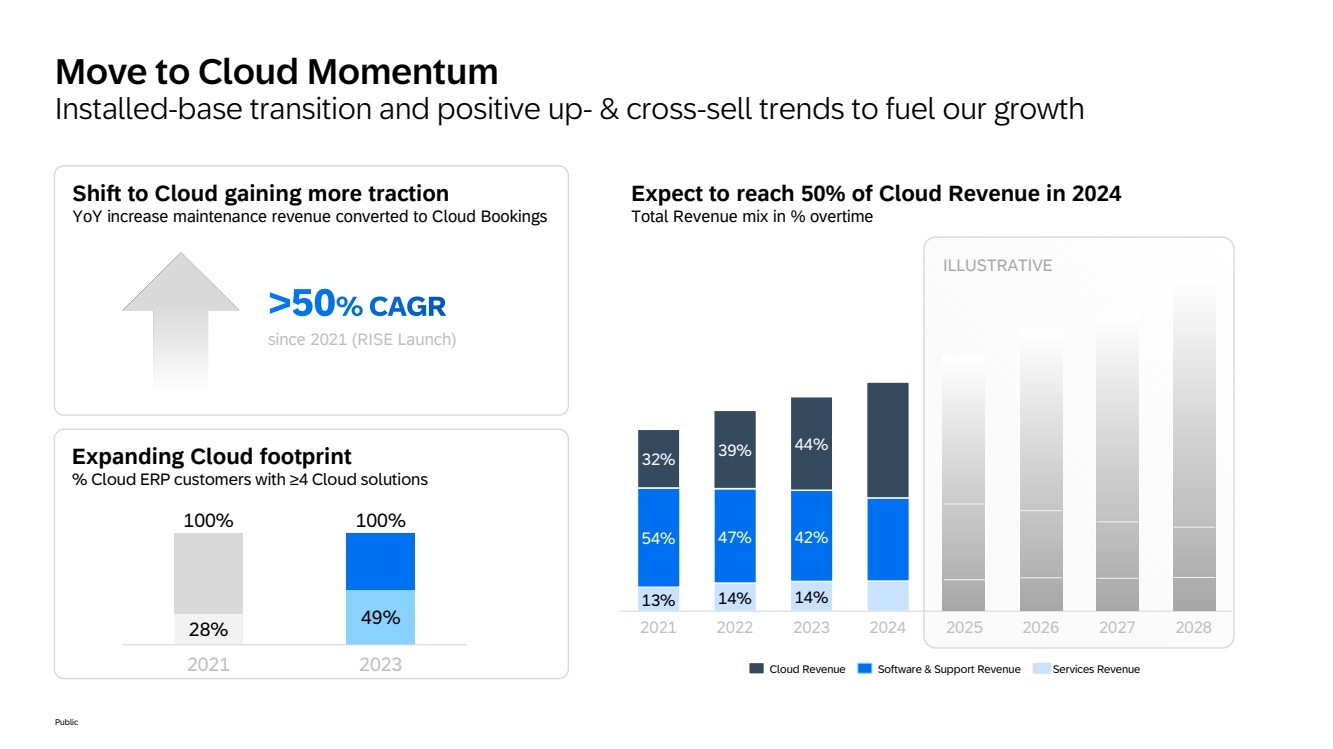
Shift to Cloud gaining more traction
YoY increase maintenance revenue converted to Cloud Bookings
54%
13%
2021
39%
47%
14%
2022
44%
42%
32%
2023 2024 2025 2026 2027 2028
14%
Expanding Cloud footprint
% Cloud ERP customers with ≥4 Cloud solutions
28% 49%
2021 2023
100% 100%
since 2021 (RISE Launch)
Cloud Revenue Software & Support Revenue Services Revenue
Move to Cloud Momentum
Installed-base transition and positive up- & cross-sell trends to fuel our growth
Expect to reach 50% of Cloud Revenue in 2024
Total Revenue mix in % overtime
ILLUSTRATIVE |
| Public
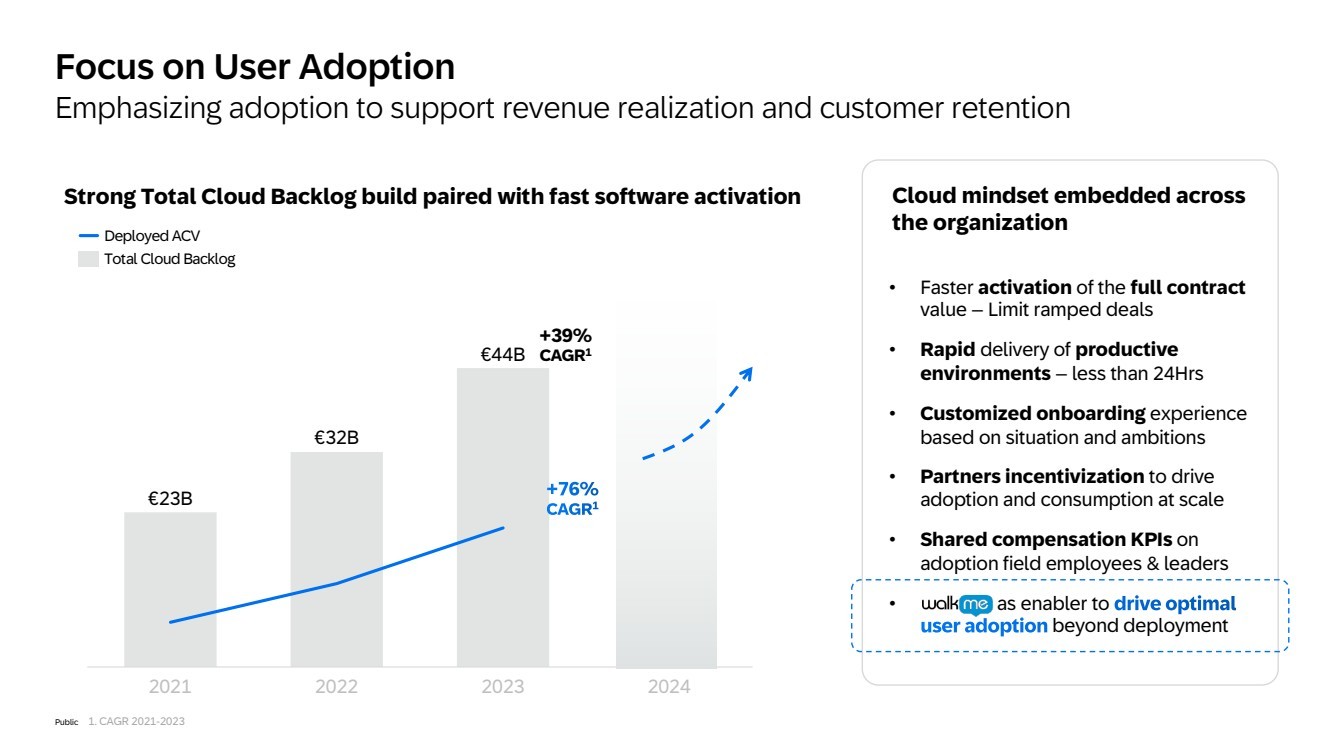
Focus on User Adoption
Emphasizing adoption to support revenue realization and customer retention
Strong Total Cloud Backlog build paired with fast software activation
• Faster activation of the full contract
value – Limit ramped deals
• Rapid delivery of productive
environments – less than 24Hrs
• Customized onboarding experience
based on situation and ambitions
• Partners incentivization to drive
adoption and consumption at scale
• Shared compensation KPIs on
adoption field employees & leaders
• as enabler to
beyond deployment
€23B
€32B
€44B
2021 2022 2023 2024
Deployed ACV
Total Cloud Backlog
+39%
CAGR1
Cloud mindset embedded across
the organization
1. CAGR 2021-2023 |
| Public
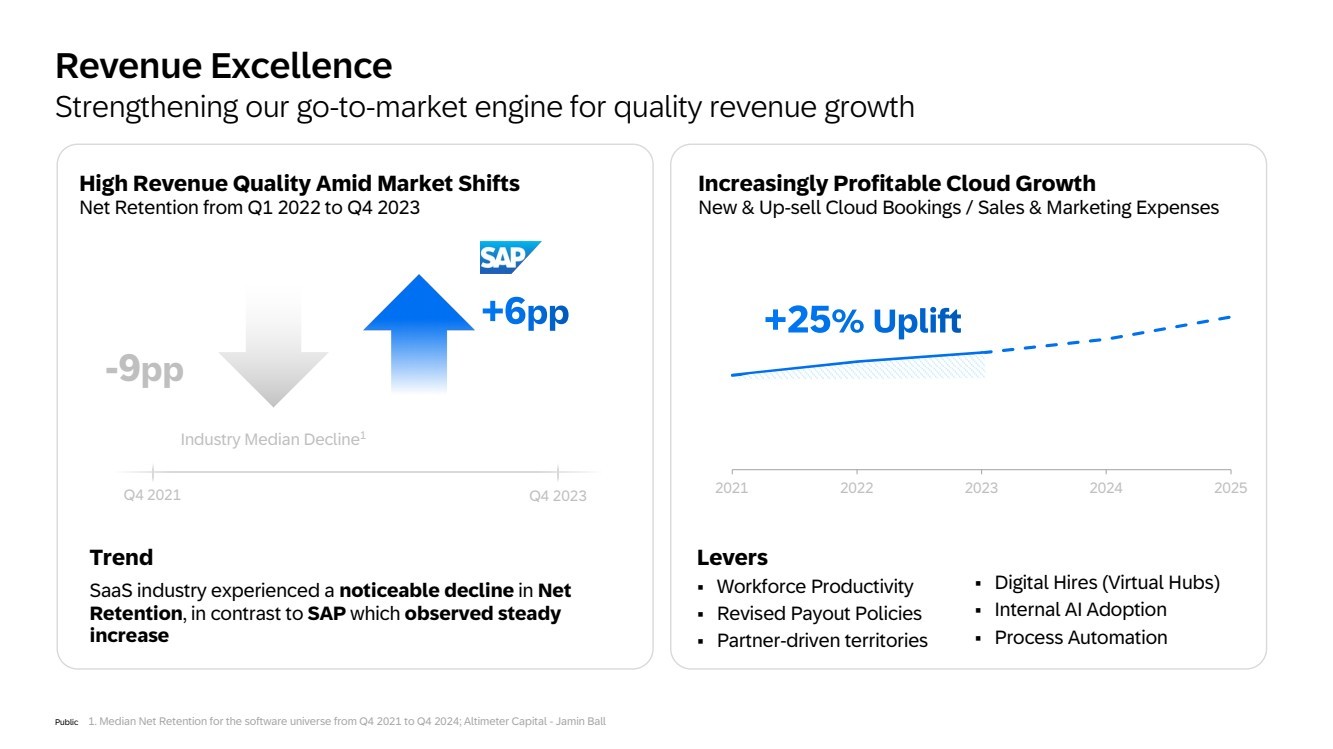
2021 2022 2023 2024 2025
Revenue Excellence
Strengthening our go-to-market engine for quality revenue growth
Increasingly Profitable Cloud Growth
New & Up-sell Cloud Bookings / Sales & Marketing Expenses
High Revenue Quality Amid Market Shifts
Net Retention from Q1 2022 to Q4 2023
Levers
§ Workforce Productivity
§ Revised Payout Policies
§ Partner-driven territories
§ Digital Hires (Virtual Hubs)
§ Internal AI Adoption
§ Process Automation
Trend
SaaS industry experienced a noticeable decline in Net
Retention, in contrast to SAP which observed steady
increase
-9pp
Q4 2021 Q4 2023
1. Median Net Retention for the software universe from Q4 2021 to Q4 2024; Altimeter Capital - Jamin Ball
Industry Median Decline1 |

| INTERNAL Public – SAP and Partners Only 49 |
| Public
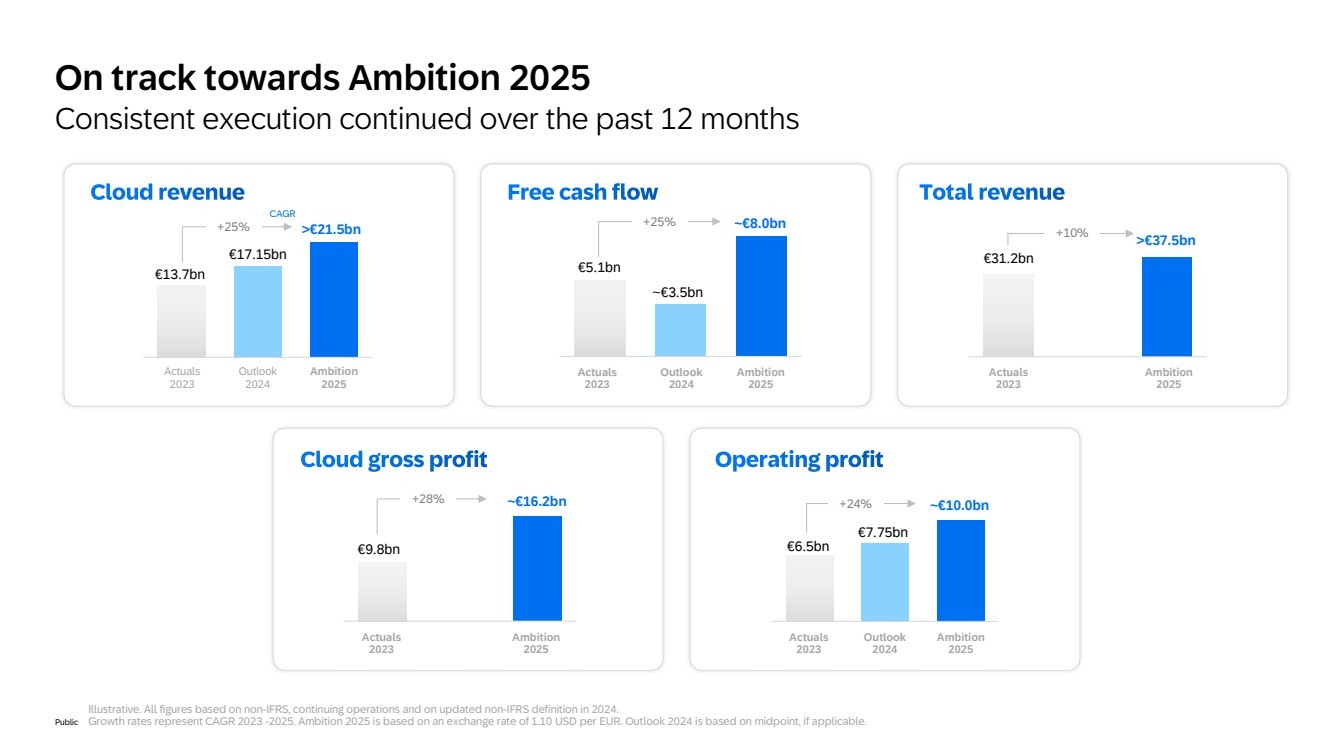
Illustrative. All figures based on non-IFRS, continuing operations and on updated non-IFRS definition in 2024.
Growth rates represent CAGR 2023 -2025. Ambition 2025 is based on an exchange rate of 1.10 USD per EUR. Outlook 2024 is based on midpoint, if applicable.
On track towards Ambition 2025
Consistent execution continued over the past 12 months
€13.7bn
Actuals
2023
Outlook
2024
€17.15bn
Ambition
2025
CAGR
+25% >€21.5bn
€9.8bn
Actuals
2023
Ambition
2025
+28% ~€16.2bn
€5.1bn
Actuals
2023
Outlook
2024
~€3.5bn
Ambition
2025
+25% ~€8.0bn
€6.5bn
Actuals
2023
Outlook
2024
€7.75bn
Ambition
2025
+24% ~€10.0bn
€31.2bn
Actuals
2023
Ambition
2025
>€37.5bn +10% |
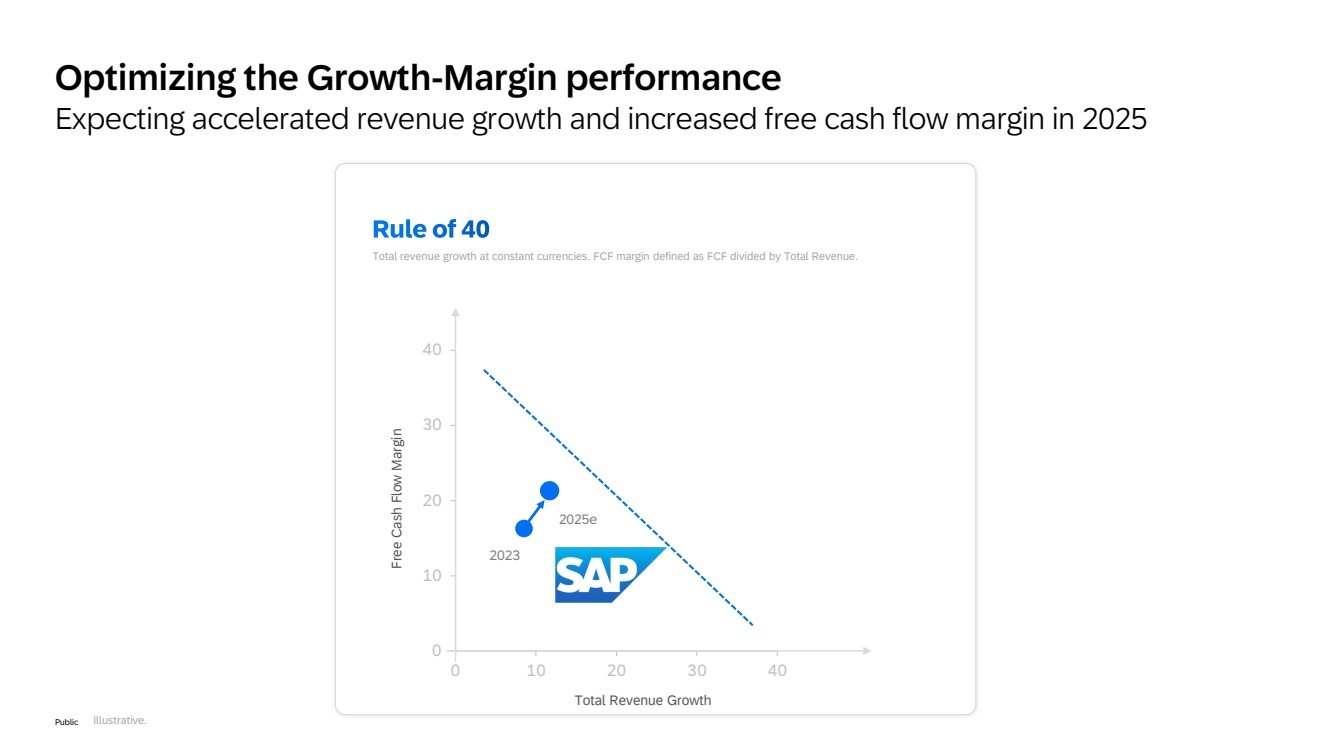
| Public
Total revenue growth at constant currencies. FCF margin defined as FCF divided by Total Revenue.
Optimizing the Growth-Margin performance
Expecting accelerated revenue growth and increased free cash flow margin in 2025
0
10
20
30
40
0 10 20 30 40
Total Revenue Growth
Free Cash Flow Margin
2023
2025e
Illustrative. |
| Public
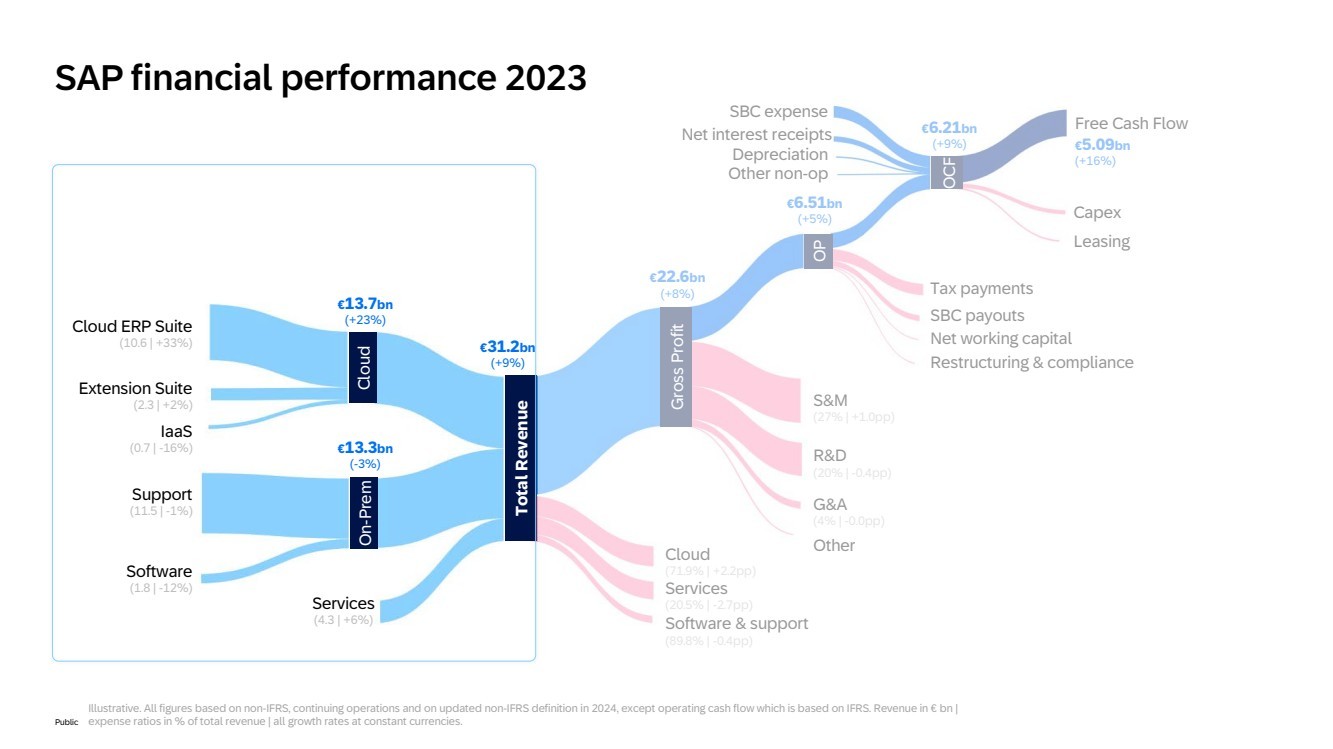
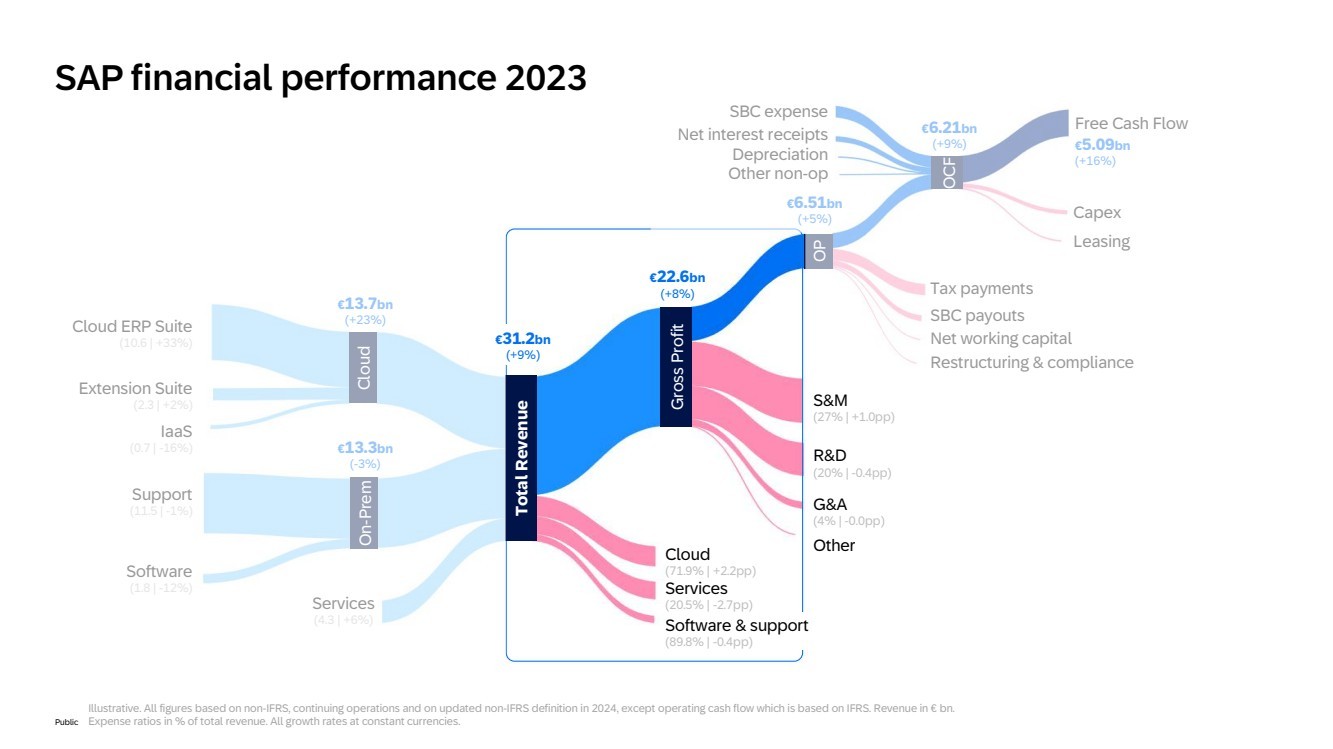
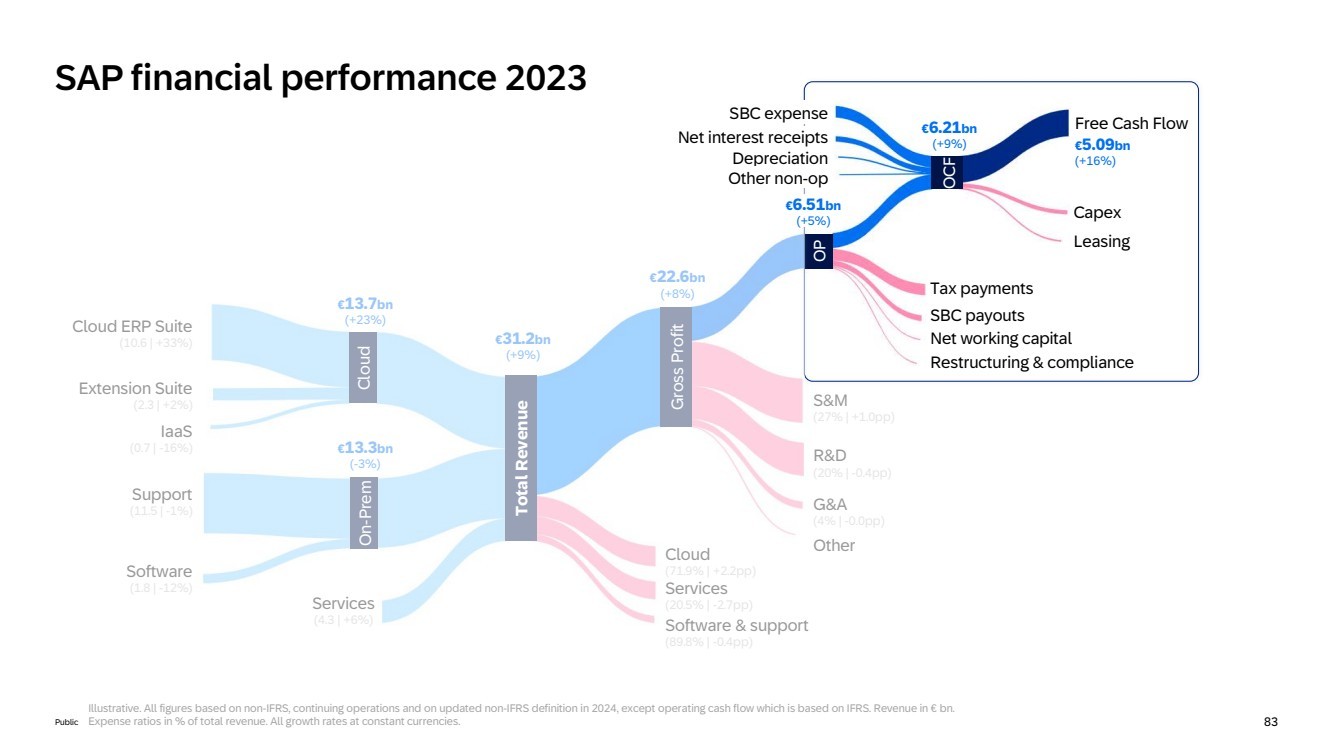
Total Revenue
On-Prem
Services
(4.3 | +6%)Cloud
Software
(1.8 | -12%)
Support
(11.5 | -1%)
Cloud ERP Suite
(10.6 | +33%)
Extension Suite
(2.3 | +2%)
IaaS
(0.7 | -16%)
Cloud
(71.9% | +2.2pp)
Services
(20.5% | -2.7pp)
Software & support
(89.8% | -0.4pp)
Free Cash Flow
S&M
(27% | +1.0pp)
R&D
(20% | -0.4pp)
G&A
(4% | -0.0pp)
Other
Tax payments
SBC payouts
Net working capital
Restructuring & compliance
SBC expense
Depreciation
Other non-op
Capex
Leasing
Gross Profit
OP
OCF
€13.7bn
(+23%)
€13.3bn
(-3%)
€22.6bn
(+8%)
€6.51bn
(+5%)
€6.21bn
(+9%) €5.09bn
(+16%)
Net interest receipts
SAP financial performance 2023
€31.2bn
(+9%)
Illustrative. All figures based on non-IFRS, continuing operations and on updated non-IFRS definition in 2024, except operating cash flow which is based on IFRS. Revenue in € bn |
expense ratios in % of total revenue | all growth rates at constant currencies. |
| Public
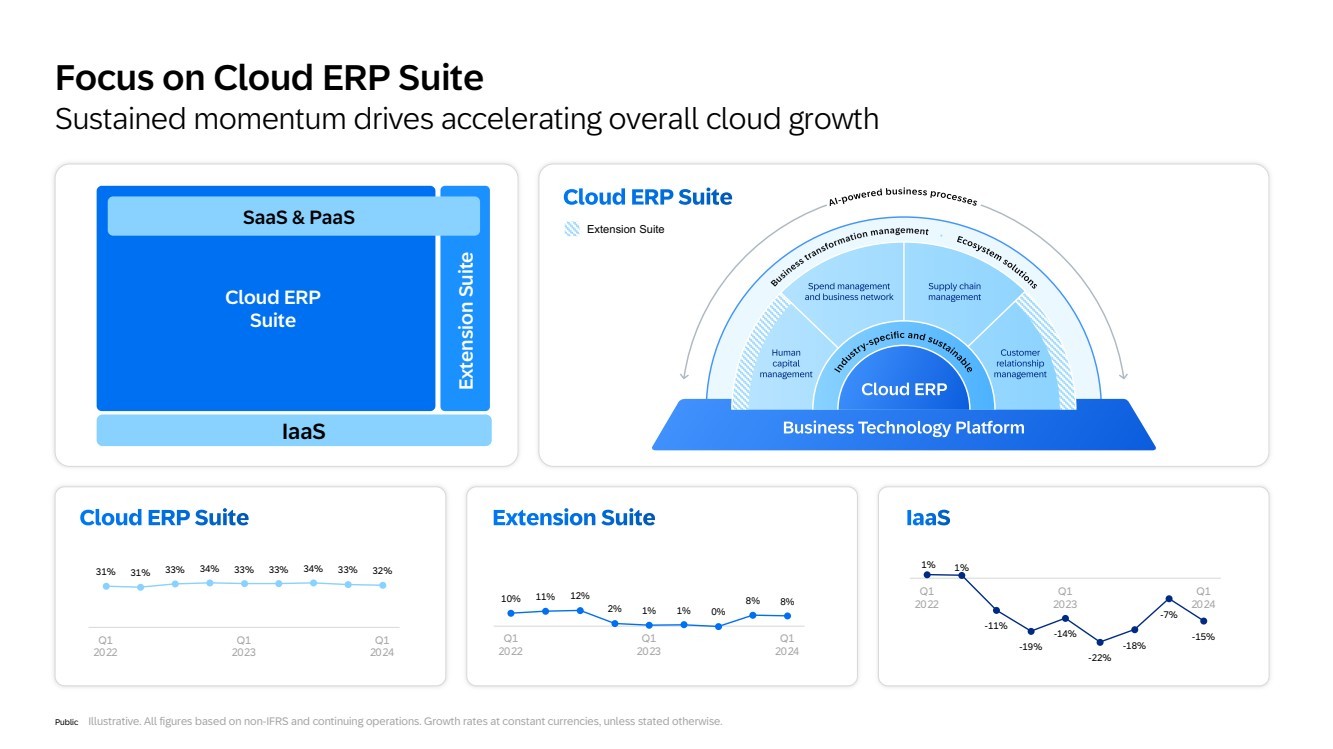
Focus on Cloud ERP Suite
Sustained momentum drives accelerating overall cloud growth
31% 31% 33% 34% 33% 33% 34% 33% 32%
Q1
2022
Q1
2023
Q1
2024
10% 11% 12%
2% 1% 1% 0%
8% 8%
Q1
2022
Q1
2023
Q1
2024
1% 1%
-11%
-19%
-14%
-22%
-18%
-7%
-15%
Q1
2022
Q1
2023
Q1
2024
Cloud ERP
Suite
Extension Suite
SaaS & PaaS
IaaS
Illustrative. All figures based on non-IFRS and continuing operations. Growth rates at constant currencies, unless stated otherwise.
Extension Suite |
| Public
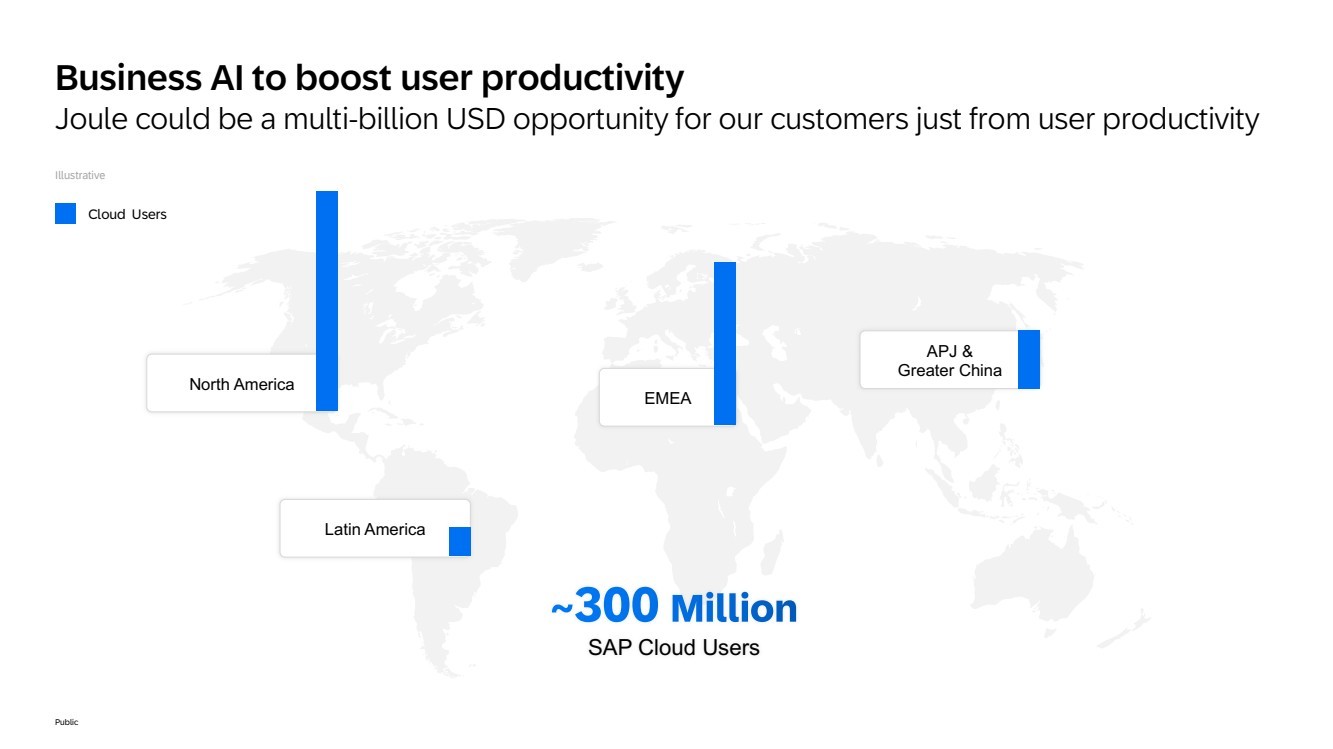
APJ &
Greater China
EMEA
Latin America
North America
Illustrative
SAP Cloud Users
Business AI to boost user productivity
Joule could be a multi-billion USD opportunity for our customers just from user productivity
Cloud Users |
| Public
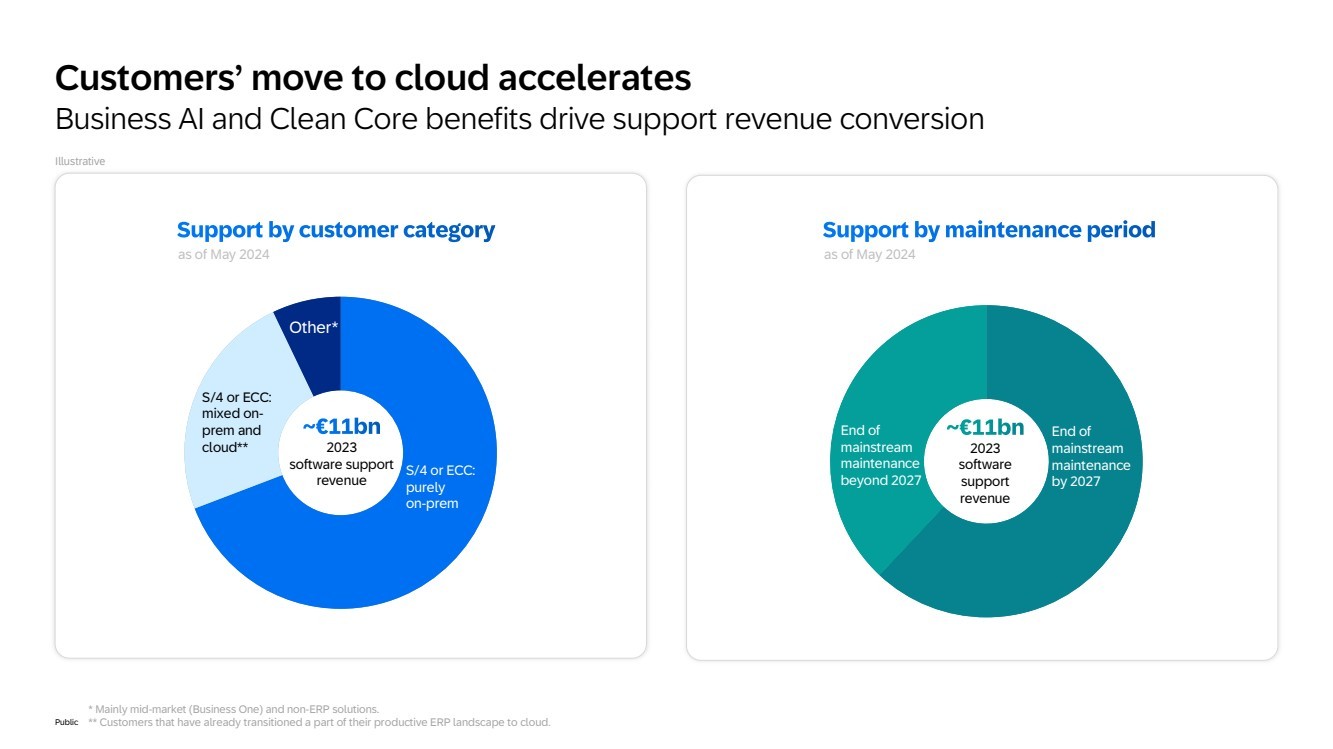
Oter
2023
software support
revenue
Other*
S/4 or ECC:
purely
on-prem
S/4 or ECC:
mixed on-prem and
cloud**
Oter
2023
software
support
revenue
End of
mainstream
maintenance
by 2027
End of
mainstream
maintenance
beyond 2027
as of May 2024 as of May 2024
Customers’ move to cloud accelerates
Business AI and Clean Core benefits drive support revenue conversion
* Mainly mid-market (Business One) and non-ERP solutions.
** Customers that have already transitioned a part of their productive ERP landscape to cloud.
Illustrative |
| Public
Total Revenue
On-Prem
Services
(4.3 | +6%)Cloud
Software
(1.8 | -12%)
Support
(11.5 | -1%)
Cloud ERP Suite
(10.6 | +33%)
Extension Suite
(2.3 | +2%)
IaaS
(0.7 | -16%)
Cloud
(71.9% | +2.2pp)
Services
(20.5% | -2.7pp)
Free Cash Flow
Tax payments
SBC payouts
Net working capital
Restructuring & compliance
SBC expense
Depreciation
Other non-op
Capex
Leasing
Gross Profit
OP
OCF
€13.7bn
(+23%)
€13.3bn
(-3%)
€22.6bn
(+8%)
€6.51bn
(+5%)
€6.21bn
(+9%) €5.09bn
(+16%)
Net interest receipts
SAP financial performance 2023
Software & support
(89.8% | -0.4pp)
€31.2bn
(+9%)
S&M
(27% | +1.0pp)
R&D
(20% | -0.4pp)
G&A
(4% | -0.0pp)
Other
Illustrative. All figures based on non-IFRS, continuing operations and on updated non-IFRS definition in 2024, except operating cash flow which is based on IFRS. Revenue in € bn.
Expense ratios in % of total revenue. All growth rates at constant currencies. |
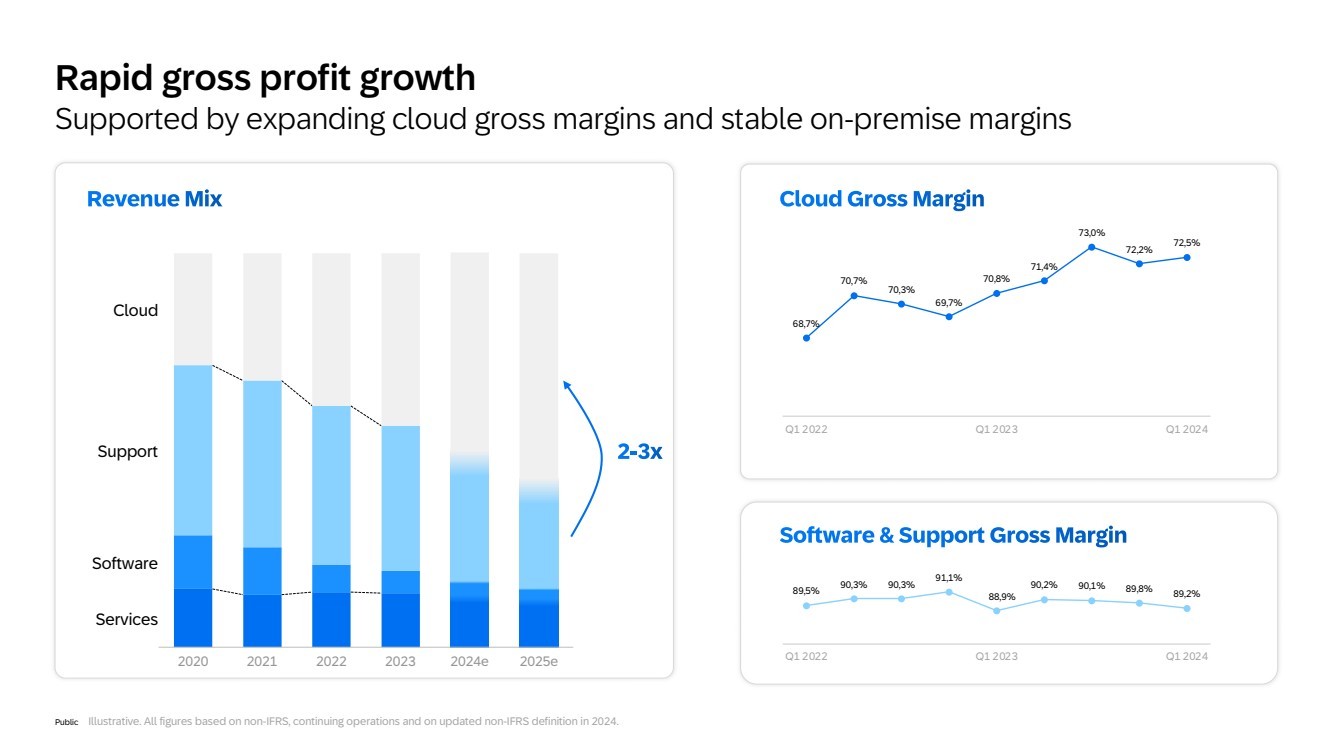
| Public Illustrative. All figures based on non-IFRS, continuing operations and on updated non-IFRS definition in 2024.
Cloud
2025e
Software
Services
2020 2021 2022 2023 2024e
Support
68,7%
70,7%
70,3%
69,7%
70,8%
71,4%
73,0%
72,2% 72,5%
Q1 2022 Q1 2023 Q1 2024
89,5% 90,3% 90,3% 91,1%
88,9%
90,2% 90,1% 89,8% 89,2%
Q1 2022 Q1 2023 Q1 2024
Rapid gross profit growth
Supported by expanding cloud gross margins and stable on-premise margins |
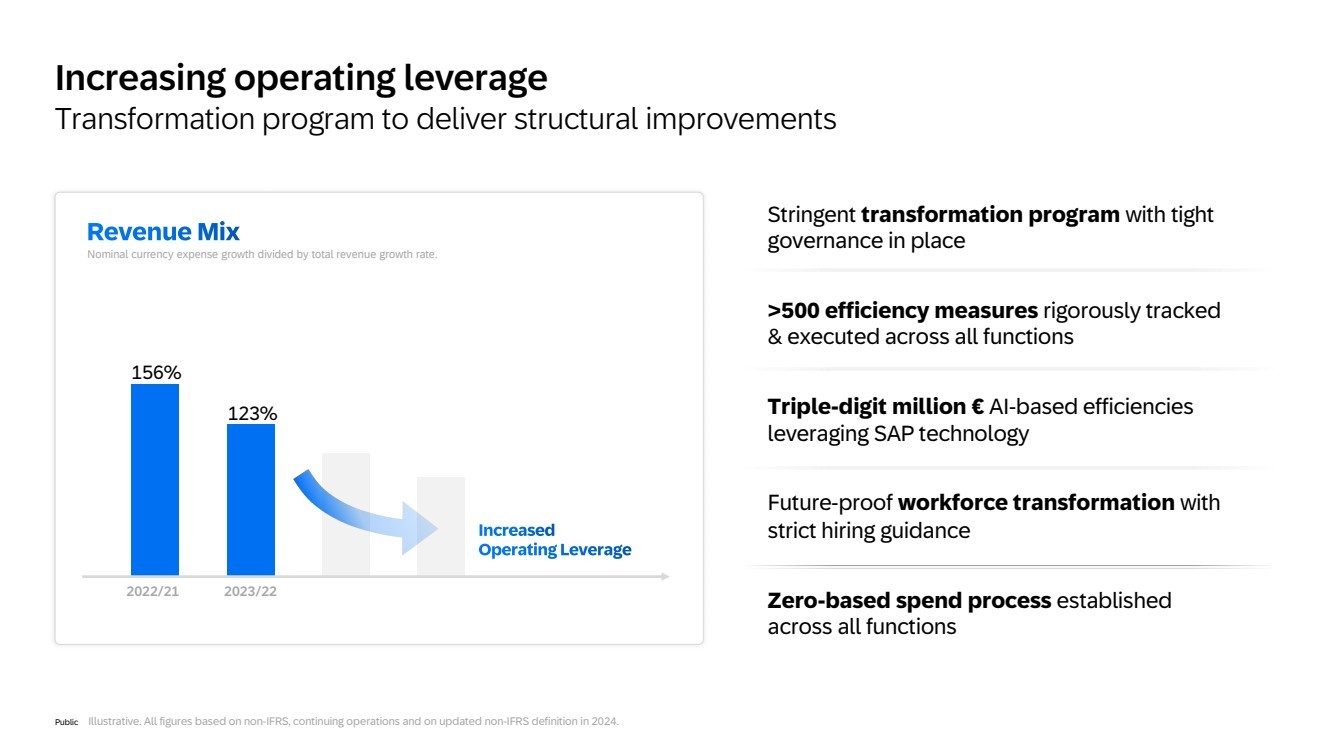
| Public Illustrative. All figures based on non-IFRS, continuing operations and on updated non-IFRS definition in 2024.
Stringent transformation program with tight
governance in place
>500 efficiency measures rigorously tracked
& executed across all functions
Triple-digit million € AI-based efficiencies
leveraging SAP technology
Future-proof workforce transformation with
strict hiring guidance
Zero-based spend process established
across all functions
123%
156%
2022/21 2023/22
Nominal currency expense growth divided by total revenue growth rate.
Increasing operating leverage
Transformation program to deliver structural improvements |
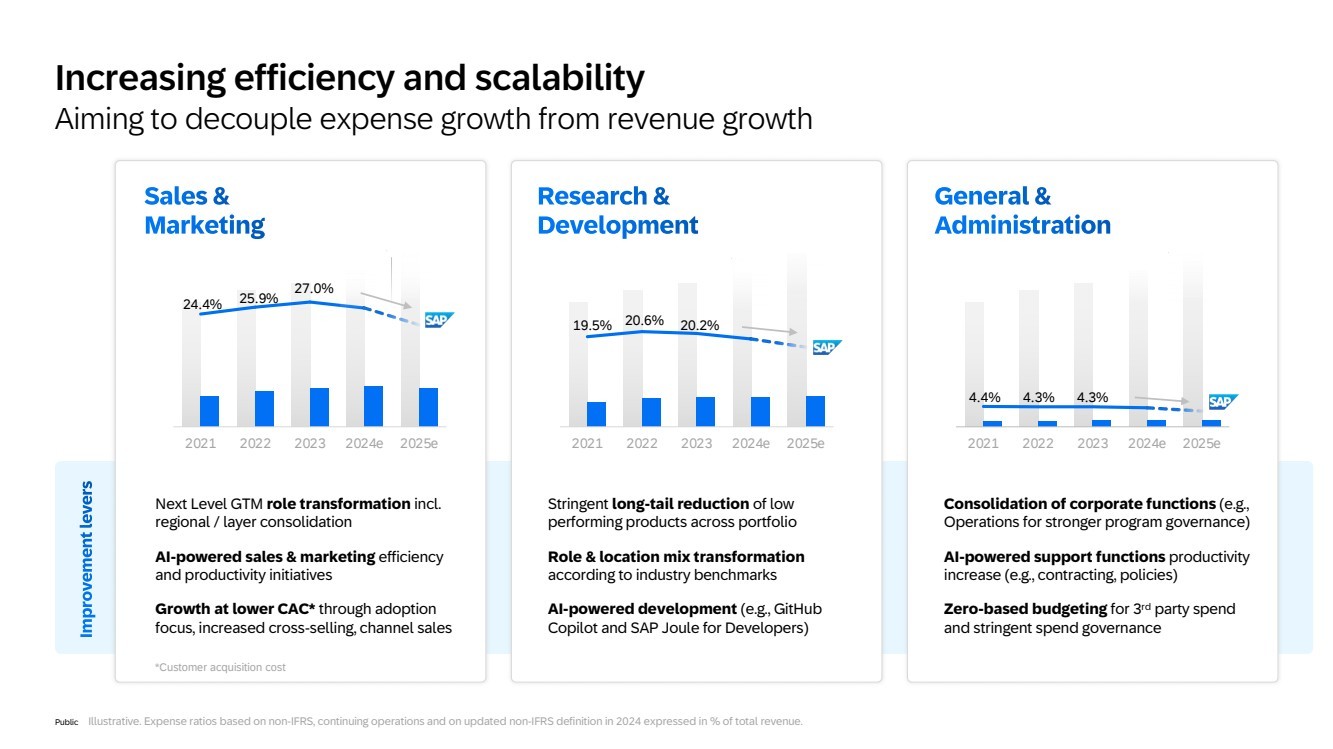
| Public
2021 2022 2023 2024e 2025e
27.0%
25.9% 24.4%
2021 2022 2023 2024e 2025e
19.5% 20.6% 20.2%
2021 2022 2023 2024e 2025e
4.4% 4.3% 4.3%
Next Level GTM role transformation incl.
regional / layer consolidation
AI-powered sales & marketing efficiency
and productivity initiatives
Growth at lower CAC* through adoption
focus, increased cross-selling, channel sales
*Customer acquisition cost
Stringent long-tail reduction of low
performing products across portfolio
Role & location mix transformation
according to industry benchmarks
AI-powered development (e.g., GitHub
Copilot and SAP Joule for Developers)
Consolidation of corporate functions (e.g.,
Operations for stronger program governance)
AI-powered support functions productivity
increase (e.g., contracting, policies)
Zero-based budgeting for 3rd party spend
and stringent spend governance
Increasing efficiency and scalability
Aiming to decouple expense growth from revenue growth
Illustrative. Expense ratios based on non-IFRS, continuing operations and on updated non-IFRS definition in 2024 expressed in % of total revenue. |
| Public 83 Total Revenue On-Prem
Services
(4.3 | +6%)Cloud
Software
(1.8 | -12%)
Support
(11.5 | -1%)
Cloud ERP Suite
(10.6 | +33%)
Extension Suite
(2.3 | +2%)
IaaS
(0.7 | -16%)
Cloud
(71.9% | +2.2pp)
Services
(20.5% | -2.7pp)
Software & support
(89.8% | -0.4pp)
Free Cash Flow
S&M
(27% | +1.0pp)
R&D
(20% | -0.4pp)
G&A
(4% | -0.0pp)
Other
Tax payments
SBC payouts
Net working capital
Restructuring & compliance
Capex
Leasing
Gross Profit
OP
OCF
€13.7bn
(+23%)
€13.3bn
(-3%)
€31.2bn
(+9%)
€22.6bn
(+8%)
€6.21bn
(+9%) €5.09bn
(+16%)
SAP financial performance 2023
SBC expense
Depreciation
Other non-op
Net interest receipts
€6.51bn
(+5%)
Illustrative. All figures based on non-IFRS, continuing operations and on updated non-IFRS definition in 2024, except operating cash flow which is based on IFRS. Revenue in € bn.
Expense ratios in % of total revenue. All growth rates at constant currencies. |
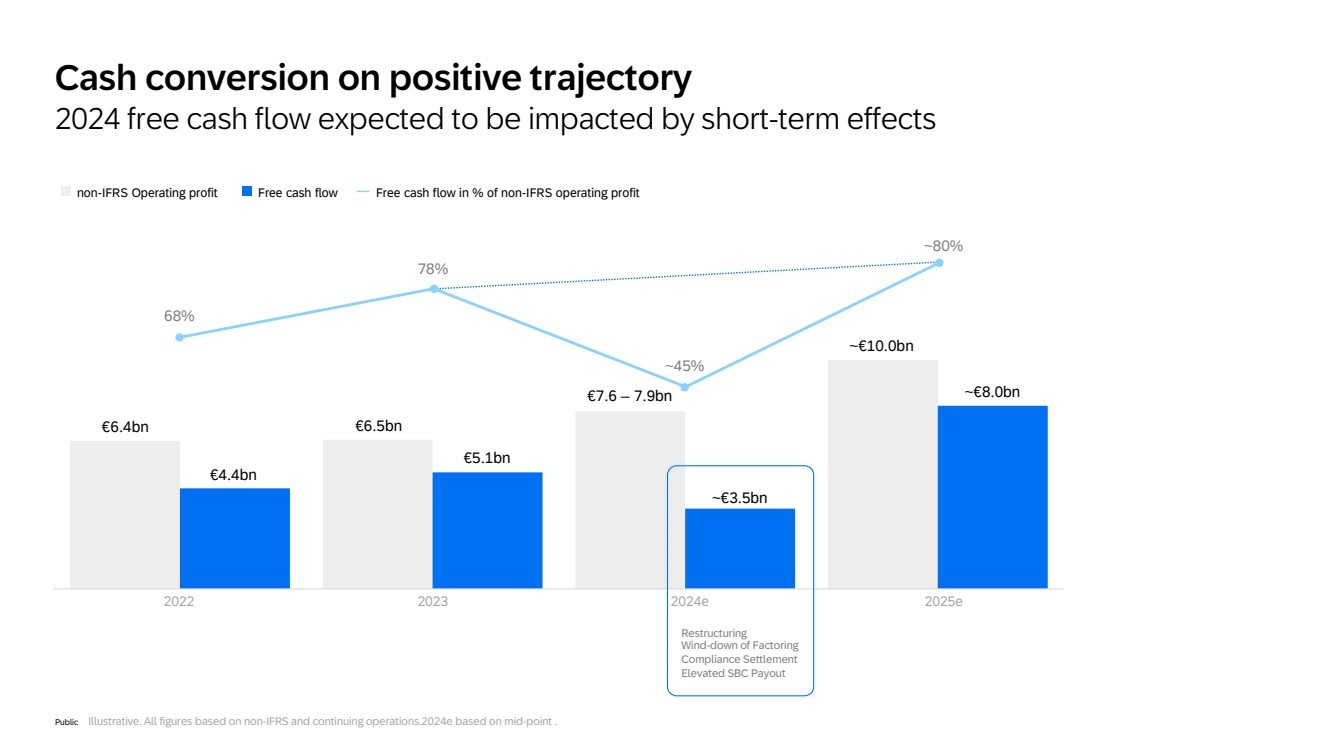
| Public Illustrative. All figures based on non-IFRS and continuing operations.2024e based on mid-point .
non-IFRS Operating profit Free cash flow Free cash flow in % of non-IFRS operating profit
2022 2023 2025e
€6.4bn
€4.4bn
€6.5bn
€5.1bn
~€10.0bn
~€8.0bn
2024e
~€3.5bn
€7.6 – 7.9bn
68%
78%
~45%
~80%
Restructuring
Wind-down of Factoring
Compliance Settlement
Elevated SBC Payout
Cash conversion on positive trajectory
2024 free cash flow expected to be impacted by short-term effects |
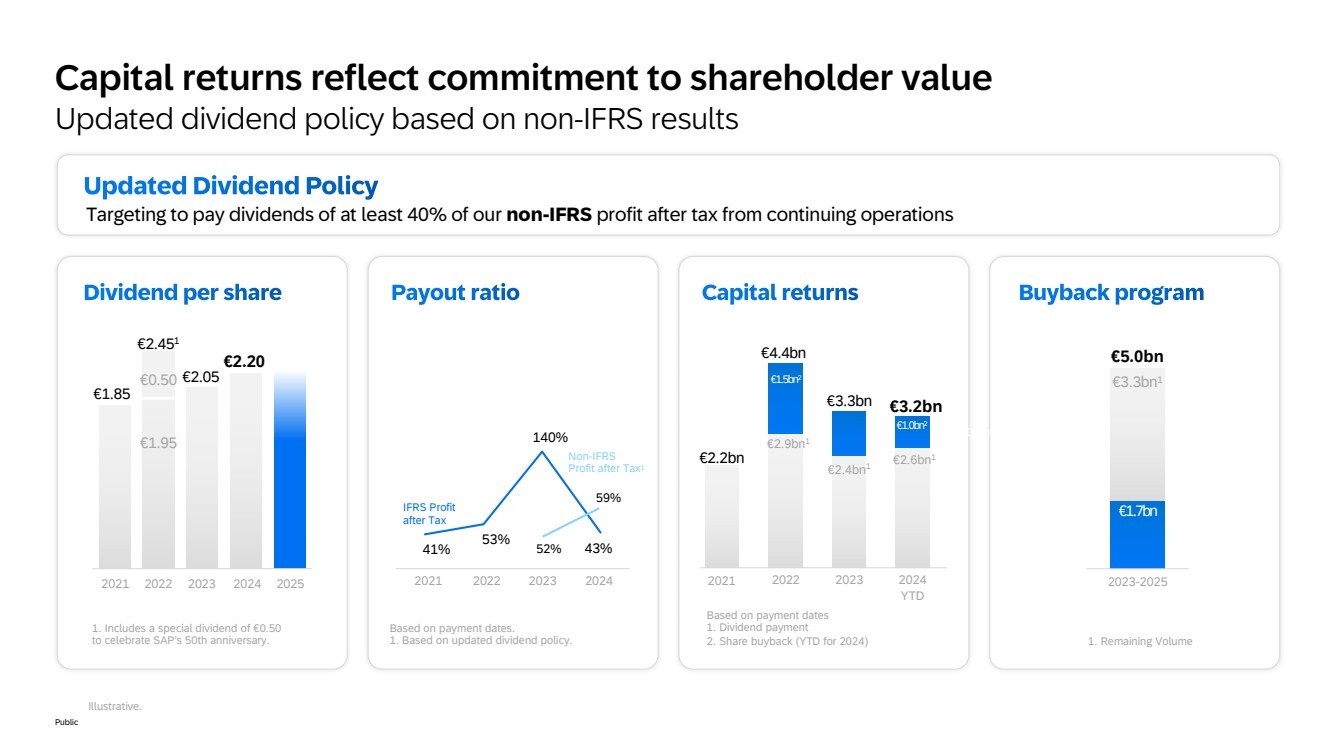
| Public
Capital returns reflect commitment to shareholder value
Updated dividend policy based on non-IFRS results
Targeting to pay dividends of at least 40% of our non-IFRS profit after tax from continuing operations
€1.85
2022 2023 2024
€2.20
€2.451
€2.05
1. Includes a special dividend of €0.50
to celebrate SAP’s 50th anniversary.
2021 2025
€1.95
€0.50
Based on payment dates.
1. Based on updated dividend policy.
41%
53%
140%
43%
2021 2022 2023 2024
IFRS Profit
after Tax
52%
59%
Non-IFRS
Profit after Tax1
2021 2022 2023
€2.2bn
€3.3bn
€2.9bn1
€1.0bn2
€3.2bn
€1.5bn2
Based on payment dates
1. Dividend payment
2. Share buyback (YTD for 2024)
2024
YTD
€4.4bn
€2.4bn1 €2.6bn1
€0.6bn2
€5.0bn
2023-2025
1. Remaining Volume
€3.3bn1
€1.7bn
Illustrative. |
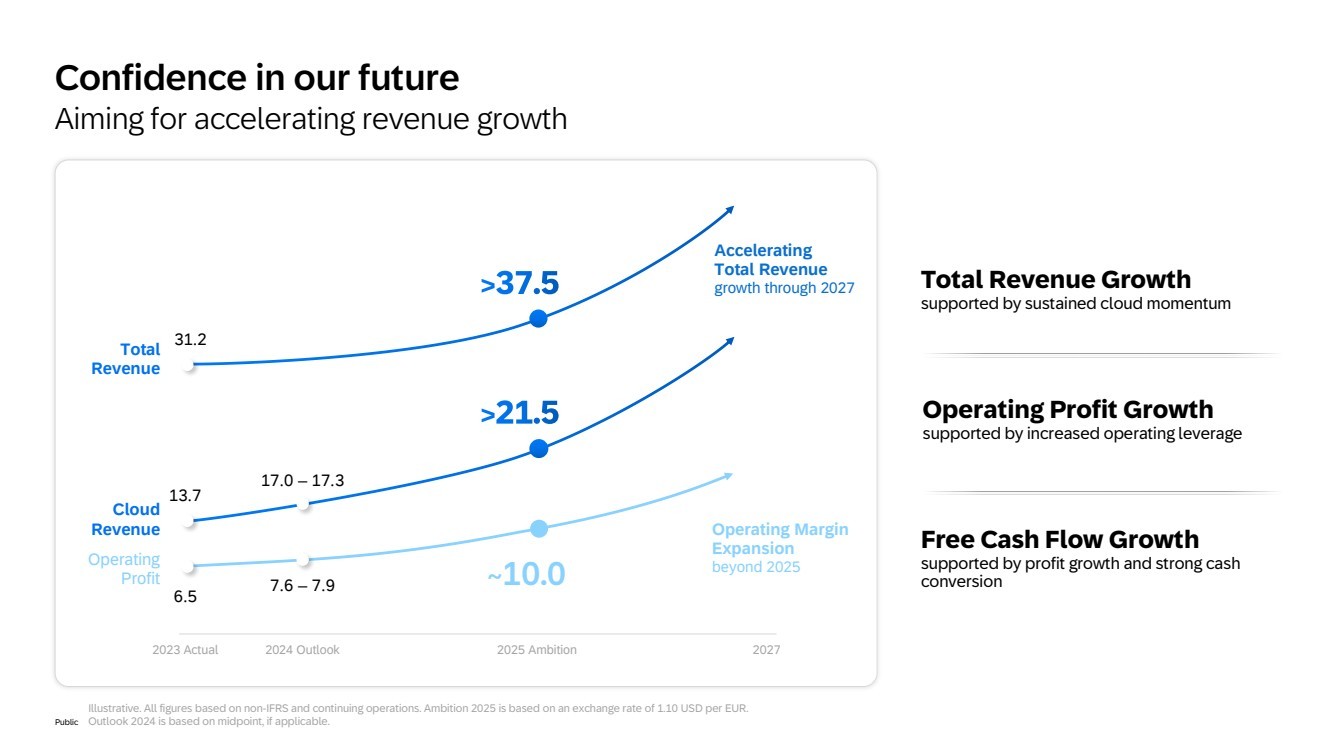
| Public
Confidence in our future
Aiming for accelerating revenue growth
Total Revenue Growth
supported by sustained cloud momentum
Free Cash Flow Growth
supported by profit growth and strong cash
conversion
Operating Profit Growth
supported by increased operating leverage
Total
Revenue
Cloud
Revenue
Operating
Profit
31.2
13.7
17.0 – 17.3
6.5 7.6 – 7.9
2023 Actual 2024 Outlook 2025 Ambition 2027
~10.0
Operating Margin
Expansion
beyond 2025
Accelerating
Total Revenue
growth through 2027
Illustrative. All figures based on non-IFRS and continuing operations. Ambition 2025 is based on an exchange rate of 1.10 USD per EUR.
Outlook 2024 is based on midpoint, if applicable. |
Sap (PK) (USOTC:SAPGF)
Historical Stock Chart
From Dec 2024 to Jan 2025
 Charts.")
Sap (PK) (USOTC:SAPGF)
Historical Stock Chart
From Jan 2024 to Jan 2025
 Charts.")