ReoStar Energy Corp. (OTCBB: REOS) today announced results of
operations for the second quarter of Fiscal Year 2010.
Second Quarter Fiscal Year 2010 Financial and Production
Summary
Oil sales during the quarter ended September 30, 2009, totaled
approximately 5,081 barrels, compared with approximately 11,565
barrels of oil for the quarter ended September 30, 2008. The
average price received for oil sold during the quarter ended
September 30, 2009 declined 45% to $64.16 per barrel, when compared
with an average price for the quarter ended September 30, 2008 of
$115.90 per barrel.
Natural gas sales during the quarter ended September 30, 2009
approximated 100,077 thousand cubic feet (Mcf), compared with
approximately 124,300 Mcf of gas sales in the same period a year
earlier. The price received for natural gas sold during the quarter
ended September 30, 2009 averaged $2.23 per Mcf (net of
transportation, compression and CO2 charges), compared with $7.57
per Mcf in the quarter ended September 30, 2009, a decrease of
approximately 70%.
Oil and gas revenues for the three months ended September 30,
2009 totaled $556,141, compared with $2,282,048 in the quarter
ended September 30, 2008. The primary reasons for the decrease in
revenue were lower production and lower average sales prices in the
second quarter of 2010 versus the same period the prior year.
On September 30, 2009, the Company had $105,000 in cash, and
total assets approximated $22.9 million. Liabilities consisted of
accounts and notes payable to non-related parties of $11 million,
of which $10.8 million was long-term. The Company also had accounts
and notes payable to related parties of $3.6 million.
During the quarter, the Company did not draw on the credit
facility secured by its assets. The material terms of the credit
facility were reported in the Company's Form 8-K filed on November
4, 2008. The remaining credit available under the credit facility
as of September 30, 2008 approximated $3.2 million.
Mark Zouvas, CEO of ReoStar, commented, "There are a number of
challenges we face during the remainder of the fiscal year.
Although we are disappointed with our second quarter results, much
of the production and revenue decline reflected our conservative
approach to managing cash reserves and slowing our drilling
expansion. We are comfortable with our financial outlook for the
remainder of Fiscal 2010, as we proceed with caution in our
expansion plans while remaining astute in managing budgets and
adjusting to uncertain industry and economic conditions. We
continue to seek strategic opportunities and valuable 'bolt-on'
acreage in our respective target areas, but we will remain
conservative with capital expenditures until management considers
it strategically appropriate to deploy our resources."
About ReoStar Energy Corporation
ReoStar Energy Corporation (OTCBB: REOS), headquartered in Fort
Worth, Texas, is an oil and gas company engaged in the acquisition,
development and production of natural gas and oil properties, with
operations primarily focused on developmental resource plays and
enhanced oil recovery projects. The Company has vertically
integrated its assets to remove potential obstacles to growth and
enable it to develop and produce assets without the risk, cost and
time involved in traditional exploration.
The Company's strategy is to cost effectively acquire an
attractive portfolio of oil reserves that have a high ratio of
possible, probable or proven undeveloped reserves. By converting
undeveloped reserves into proved producing reserves, the Company
seeks to realize an increase in overall value at low risk and
cost.
The Company's assets include approximately 9,500 gross mineral
leasehold acres located in Texas (Barnett & Corsicana).
ReoStar's assemblage of E&P assets allows for appreciable,
unimpeded growth into the foreseeable future.
Additional information is located on the company's website:
www.reostarenergy.com.
Certain statements in this news release may contain
forward-looking information within the meaning of Rule 175 under
the Securities Act of 1933 and Rule 3b-6 under the Securities
Exchange Act of 1934, and are subject to the safe harbor created by
those rules. All statements, other than statements of fact,
included in this release, including, without limitation, statements
regarding potential future plans and objectives of the company, are
forward-looking statements that involve risks and uncertainties.
There can be no assurance that such statements will prove to be
accurate and actual results and future events could differ
materially from those anticipated in such statements. Technical
complications which may arise could prevent the prompt
implementation of any strategically significant plan(s) outlined
above.
                        ReoStar Energy Corporation
                        Consolidated Balance Sheets


                                               September 30,    March 31,
                                                    2009          2009
                                                (unaudited)
ASSETS
Current Assets:
    Cash                                        $    105,457  $    426,430
    Accounts Receivable:
       Oil & Gas - Related Party                     382,987       337,879
       Related Party                                 773,219     1,107,854
       Other                                          41,554        15,760
    Inventory                                          2,445         7,514
    Hedging Account                                    6,317         6,317
                                                ------------  ------------
    Total Current Assets                           1,311,979     1,901,754
                                                ------------  ------------
Note Receivable                                      553,536       553,536
                                                ------------  ------------
Oil and Gas Properties - successful efforts
 method                                           26,316,823    25,254,777
    Less Accumulated Depletion and Depreciation   (7,328,208)   (6,206,558)
                                                ------------  ------------
       Oil & Gas Properties (net)                 18,988,615    19,048,219
                                                ------------  ------------

Other Depreciable Assets:                          2,322,167     2,171,654
    Less Accumulated Depreciation                   (425,303)     (315,093)
                                                ------------  ------------
       Other Depreciable Assets (net)              1,896,864     1,856,561
                                                ------------  ------------

Leasehold Held for Sale                              150,000       150,000

                                                ------------  ------------
Total Assets                                    $ 22,900,994  $ 23,510,070
                                                ============  ============
LIABILITIES
Current Liabilities:
    Accounts Payable                            $     59,466  $     22,033
    Payable to Related Parties                        29,812       148,550
    Accrued Expenses                                 132,902       106,141
    Accrued Expenses - Related Party                 109,664       130,870
    Hedging Liabilities - Current                    120,869
                                                ------------  ------------
       Total Current Liabilities                     452,713       407,594
                                                ------------  ------------

    Notes Payable                                 10,119,270     8,955,202
    Notes Payable - Related Parties                3,518,924     3,518,924
                                                ------------  ------------
       Total Long-Term Debt                       13,638,194    12,474,126
                                                ------------  ------------

    Asset Retirement Obligation                      387,353       344,079
    Hedging Liability - Noncurrent                    25,056             -
    Deferred Tax Liability                         1,010,794     1,702,782
                                                ------------  ------------
       Total Liabilities                          15,514,110    14,928,581
                                                ------------  ------------

    Commitments & Contingencies:                           -             -
                                                ------------  ------------

Stockholders' Equity
    Common Stock, $.001 par, 200,000,000 shares
     authorized and 81,643,912 shares outstanding
     on September 30, 2009 and 80,353,912 shares
     outstanding on March 31, 2009                    81,643        80,353
    Additional Paid-In-Capital                    11,685,345    10,959,965
    Retained Deficit                              (4,380,104)   (2,458,829)
                                                ------------  ------------
       Total Stockholders' Equity                  7,386,884     8,581,489
                                                ------------  ------------
       Total Liabilities & Stockholders' Equity $ 22,900,994  $ 23,510,070
                                                ============  ============


                        ReoStar Energy Corporation
                  Consolidated Statements of Operations


                                                   Three Months Ended
                                               --------------------------
                                               September 30, September 30,
                                                   2009          2008
                                               (unaudited)   (unaudited)
                                               ------------  ------------
Revenues
  Oil & Gas Sales                              $    556,141  $  2,282,048
  Sale of Leases                                    137,677        18,005
  Other Income                                       90,119       109,568
                                               ------------  ------------
                                                    783,937     2,409,621
                                               ------------  ------------

Costs and Expenses
  Oil & Gas Lease Operating Expenses                515,195       789,234
  Workover Expenses                                  43,998        87,982
  Severance & Ad Valorem Taxes                       31,129       132,125
  Depletion & Depreciation                          684,361       381,660
  ARO Accretion                                      11,031             -
  General & Administrative:
     Salaries & Benefits                            201,935       135,068
     Legal & Professional                           648,979       193,129
     Other General & Administrative                 126,406        40,295
  Interest, net of capitalized interest of
   $132,375 and $151,343 for the three months
   ended 9/30/09 and 9/30/08, respectively and
   $254,273 and $312,919 for the six months
   ended 9/30/09 and 9/30/08, respectively                -         2,900
                                               ------------  ------------
                                                  2,263,034     1,762,393
                                               ------------  ------------

Other Income (Expense)
  Interest Income                                    13,934            40
  Loss on Equity Method Investments                              (142,395)
  Hedging Gain (Loss)                              (103,643)          (93)

                                               ------------  ------------
  Income (Loss) from continuing operations
   Before income taxes                           (1,568,806)      504,780
                                               ------------  ------------

Income Tax Benefit (Expense)                        351,944      (211,323)
                                               ------------  ------------
Net Income (Loss)                              $ (1,216,862) $    293,457
                                               ============  ============


Basic & Diluted Loss per Common Share          $      (0.02) $       0.00
                                               ------------  ------------

Weighted Average Common Shares Outstanding       80,998,912    80,181,310
                                               ============  ============
Contact: ReoStar Energy Corporation Teresa Wright
817-546-7718
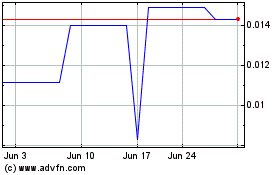
ReoStar Energy (PK) (USOTC:REOS)
Historical Stock Chart
From Dec 2024 to Jan 2025

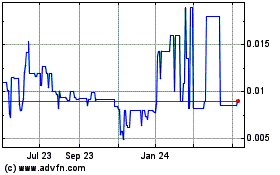
ReoStar Energy (PK) (USOTC:REOS)
Historical Stock Chart
From Jan 2024 to Jan 2025
