ALYI Verging on Technical Breakout from $0.02 to $0.06 with Potential to $0.09
April 03 2019 - 11:10AM
InvestorsHub NewsWire
ALYI Verging on Technical Breakout
from $0.02 to $0.06 with Potential to $0.09

New York, NY -- April 3, 2019
-- InvestorsHub NewsWire -- www.nextbigticker.com -- Alternet Systems, Inc. (USOTC:
ALYI) yesterday announced a potential $20 million order for the company’s electric
motorcycles that could result from a series of strategic meetings
next week. The stock is reacting
bullishly.
“We may be just
one inch away from going bullish in this security. The voices of
the bulls are louder now and the bears are in
retreat.”
AmericanBulls.com
ALYI is trading way above its $0.014 200
DAY MA and on the verge of breaking through its $0.029 50 DAY
MA. The MACD is on its way to a cross and the Candlestick
Pattern is Bullish Harami.

ALYI has a 52-Week High of over $0.06 and
an analyst recommended Target PPS of $0.09. Momentum today that sees a
close above $0.029 can take this stock to the next level all the
way back to its $0.06 52-Week High with a potential upside to the
$0.09 Target PPS.
Other market movers to watch today include
Kali-Extracts, Inc. (USOTC:
KALY), Hemp, Inc. (USOTC:
HEMP) and Coates International, LTD (USOTC:
COTE).
Disclaimer/Safe
Harbor:
This news release contains forward-looking
statements within the meaning of the Securities Litigation Reform
Act. The statements reflect the Company's current views with
respect to future events that involve risks and uncertainties.
Among others, these risks include the expectation that any of the
companies mentioned herein will achieve significant sales, the
failure to meet schedule or performance requirements of the
companies' contracts, the companies' liquidity position, the
companies' ability to obtain new contracts, the emergence of
competitors with greater financial resources and the impact of
competitive pricing. In the light of these uncertainties, the
forward-looking events referred to in this release might not
occur.
Source: www.nextbigticker.com
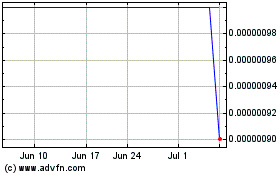
Hemp (CE) (USOTC:HEMP)
Historical Stock Chart
From Dec 2024 to Jan 2025

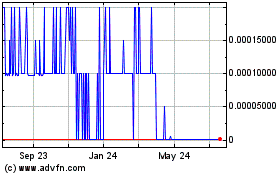
Hemp (CE) (USOTC:HEMP)
Historical Stock Chart
From Jan 2024 to Jan 2025
