Sparta Capital Ltd. Releases Second Quarter Financial Statements
May 29 2009 - 1:51PM
Marketwired Canada
Sparta Capital Ltd. ("Sparta") (TSX VENTURE:SAY) released today its unaudited
financial statements for its three month and six month periods ended March 31,
2009.


The net comprehensive loss for the three month and six month periods ended March
31, 2009 was $107,435 and 184,086 respectively.


SUMMARY OF INCOME STATEMENT INFORMATION

----------------------------------------------------------------------------
                                                January 1 to   October 1 to
Income Statement                              March 31, 2009 March 31, 2009
----------------------------------------------------------------------------
Sales                                          $           -  $           -
Cost of sales                                  $           -  $           -
Net comprehensive loss for period              $     107,435  $     184,086
Loss Per share - basic and diluted             $       0.003  $       0.005
Weighted average shares outstanding - basic       35,247,631     35,247,631
----------------------------------------------------------------------------


SUMMARY OF CASH FLOW INFORMATION

----------------------------------------------------------------------------
                                                January 1 to   October 1 to
Cash Flow                                     March 31, 2009 March 31, 2009
----------------------------------------------------------------------------
Cash from operating activities                   $  (124,746)  $   (193,938)
Cash from financing activities                   $         -   $          -
Cash from investing activities                   $    (6,095)  $    432,232
Increase (decrease) in cash and cash equivalents $  (130,841)  $    238,294
Cash and cash equivalents - beginning of period  $   770,510   $    401,375
Cash and cash equivalents - end of period        $   639,669   $    639,669
----------------------------------------------------------------------------


SUMMARY OF BALANCE SHEET INFORMATION

----------------------------------------------------------------------------
                                                    March 31,  September 30,
Balance Sheet                                           2009           2008
----------------------------------------------------------------------------
Cash and cash equivalents                        $   639,669    $   401,375
Total Assets                                     $ 1,232,575    $ 1,436,489
Total Liabilities                                $     9,983    $    29,811
Share capital                                    $ 5,221,199    $ 5,221,199
Total Shareholders' Equity                       $ 1,222,592    $ 1,406,678
Total Liabilities & Shareholders' Equity         $ 1,232,575    $ 1,437,489
----------------------------------------------------------------------------


RESULTS OF OPERTIONS

For the six month period ended March 31, 2009 the Corporation had a net
comprehensive loss of $184,086 as compared to the March 31, 2008 net
comprehensive loss of $159,418. For the three month period ended March 31, 2009
the Corporation had a net comprehensive loss of $107,435 as compared to the
March 31, 2008 loss of $103,254.


Advertising & Promotion increased slightly from $10,464 to $10,619 during the
six month period and from $5,746 to $7,507 in the three month period due to an
increase in promotional expense related to the evaluation of business growth
opportunities.


Consulting fees increased from $114,169 to $123,900 during the six month period
due to increased consulting fees related to evaluation of business growth
opportunities and remained relatively constant over the three month period
increasing from $63,800 to $64,800.


Licenses and fees increased from $9,671 to $13,725 during the six month period
and from $9,671 to $11,111 during the three month period resulting from
regulatory and exchange filing fees incurred during the period.


Office rent decreased from $12,486 to $7,518 during the six month period and
from $6,306 to $3,860 during the three month period due to office relocation
with decreased lease costs and subletting a part of the office space to a third
party.


Travel decreased from $6,657 to $3,644 during the six month period and $6,353 to
$1,931 during the three month period due to a decrease in travel related to
review of business growth opportunities.


The Corporation's March 31, 2009 financial statements and management discussion
and analysis may be viewed on SEDAR at www.sedar.com
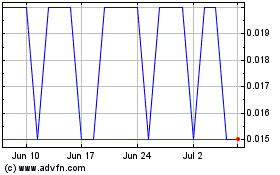
Sparta Capital (TSXV:SAY)
Historical Stock Chart
From Jun 2024 to Jul 2024

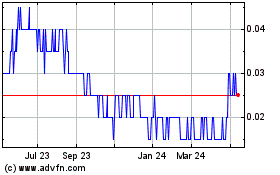
Sparta Capital (TSXV:SAY)
Historical Stock Chart
From Jul 2023 to Jul 2024
