E-L Financial Corporation Limited ("E-L Financial") (TSX: ELF)(TSX:
ELF.PR.F)(TSX: ELF.PR.G) today reported that for the quarter ended
June 30, 2011, it earned net consolidated operating income(1) of
$23.1 million or $5.23 per share compared with $7.7 million or
$1.31 per share for the comparable period in 2010. On a year to
date basis, E-L Financial earned consolidated net operating income
of $48.2 million or $10.97 per share compared with $20.1 million or
$3.83 per share for the comparable period in 2010.
--  E-L Corporate's $4.8 million increase in net operating income during the
    second quarter and $4.4 million on a year to date basis compared to the
    prior year was due primarily to increased dividends from the global
    portfolios.

--  The Dominion's $4.7 million increase in the quarter's operating income
    and $6.6 million on a year to date basis compared to the prior year
    reflects improved underwriting results and an increase in investment
    income. Improved underwriting results were driven by better automobile
    claims experience.

--  Empire Life's $5.8 million increase in net operating income for the
    quarter compared to the prior year was due primarily to improved
    segregated fund fee income in the Wealth Management business segment. On
    a year to date basis net operating income increased $17.1 million
    compared to the prior year due primarily to better mortality and
    surrender experience in the Individual Insurance product line in 2011.
    Net operating income also improved due to a non-recurring loss in the
    first quarter of 2010 related to a change in actuarial method. This
    change in actuarial method was related to the January 1, 2010 transition
    to IFRS.
Net income
For the three months ended June 30, 2011, E-L Financial incurred
a consolidated net loss of $11.4 million or $3.53 per share
compared with $38.1 million or $10.33 per share in 2010. On a year
to date basis, E-L Financial earned a consolidated net income of
$38.8 million or $8.58 per share compared with a loss of $19.4
million or $6.18 per share in 2010.
--  E-L Corporate's $7.5 million reduction in its net loss for the quarter
    compared with the prior year was mainly due to an increase in realized
    gains on available for sale ("AFS") investments. Income from investments
    in associates was impacted by a $25.6 million impairment write down. On
    a year to date basis, E-L Corporate's net income increased $20.0 million
    compared with the prior year reflecting improvements in global stock
    markets.

--  Both The Dominion's and Empire Life's net income increased for the
    quarter and year to date compared to the prior year as a result of
    improved operating income and an increase in realized gains on AFS
    investments.
Comprehensive income
For the three months ended June 30, 2011, E-L Financial had a
consolidated comprehensive loss of $10.8 million or $3.38 per share
compared with $47.3 million or $12.65 per share for the comparable
period in 2010. Other comprehensive income ("OCI") was $0.6 million
or $0.15 per share compared with other comprehensive loss ("OCL")
of $9.2 million or $2.32 per share for the comparable period in
2010.
On a year to date basis, E-L Financial earned consolidated
comprehensive income of $35.0 million or $7.62 per share compared
with a loss of $25.8 million or $7.82 per share for the comparable
period in 2010. Consolidated OCL was $3.8 million or $0.96 per
share compared with $6.4 million or $1.63 per share for the
comparable period in 2010.
--  E-L Corporate's OCI decreased $6.9 million in the quarter and $8.2
    million on a year to date basis compared to the prior year reflecting an
    increase in realized gains being reclassified to net income during both
    periods.

--  The Dominion's OCI increased $21.0 million during the quarter and $9.6
    million on a year to date basis compared to the prior year mainly due to
    net unrealized investment gains in bonds and debentures.

--  Empire Life's $4.3 million increase in OCL for the quarter compared to
    the prior year was due primarily to the reclassification to net income
    of a realized gain in 2011 versus reclassification of a realized loss in
    2010. On a year to date basis OCL decreased $1.3 million compared to the
    prior year due primarily to stronger Canadian stock markets in 2011 than
    2010.
CONSOLIDATED SUMMARY OF COMPREHENSIVE (LOSS) INCOME
----------------------------------------------------------------------------
                                     Three months ended June 30, 2011
                               ---------------------------------------------
                                        E-L         The   Empire
(thousands of dollars)            Corporate    Dominion     Life      Total
----------------------------------------------------------------------------

Net operating income            $     4,036  $    9,090 $  9,970  $  23,096

Realized gain on available for
 sale investments including
 impairment write downs               3,180       5,113    3,283     11,576

Share of loss of associates         (24,170)          -        -    (24,170)

Fair value change in fair value
 through profit or loss
 investments                        (21,876)                        (21,876)
----------------------------------------------------------------------------
Net (loss) income                   (38,830)     14,203   13,253    (11,374)

Other comprehensive (loss)
 income                                 (20)      6,738   (6,120)       598
----------------------------------------------------------------------------
Comprehensive (loss) income     $   (38,850) $   20,941 $  7,133  $ (10,776)
----------------------------------------------------------------------------

----------------------------------------------------------------------------
                                     Three months ended June 30, 2010
                              ----------------------------------------------
                                       E-L         The    Empire
(thousands of dollars)           Corporate    Dominion      Life      Total
----------------------------------------------------------------------------

Net operating (loss) income    $      (797) $    4,350  $  4,136  $   7,689

Realized (loss) gain on
 available for sale
 investments including
 impairment write downs             (3,615)      1,923    (2,177)    (3,869)

Share of loss of associates        (22,716)          -         -    (22,716)

Fair value change in fair
 value through profit or loss
 investments                       (19,250)                         (19,250)
----------------------------------------------------------------------------
Net (loss) income                  (46,378)      6,273     1,959    (38,146)

Other comprehensive income
 (loss)                              6,892     (14,254)   (1,791)    (9,153)
----------------------------------------------------------------------------
Comprehensive (loss) income    $   (39,486) $   (7,981) $    168  $ (47,299)
----------------------------------------------------------------------------

----------------------------------------------------------------------------
                                      Six months ended June 30, 2011
                              ----------------------------------------------
                                       E-L          The   Empire
(thousands of dollars)           Corporate     Dominion     Life      Total
----------------------------------------------------------------------------

Net operating income           $     7,344  $    22,479 $ 18,357  $  48,180

Realized gain on available for
 sale investments including
 impairment write downs              4,305       13,140    6,061     23,506

Share of loss of associates        (17,028)           -        -    (17,028)

Fair value change in fair
 value through profit or loss
 investments                       (15,858)                         (15,858)
----------------------------------------------------------------------------
Net (loss) income                  (21,237)      35,619   24,418     38,800

Other comprehensive (loss)
 income                             (2,607)       1,827   (2,998)    (3,778)
----------------------------------------------------------------------------
Comprehensive (loss) income    $   (23,844) $    37,446 $ 21,420  $  35,022
----------------------------------------------------------------------------

----------------------------------------------------------------------------
                                     Six months ended June 30, 2010
                             -----------------------------------------------
                                      E-L          The    Empire
(thousands of dollars)          Corporate     Dominion      Life      Total
----------------------------------------------------------------------------

Net operating income          $     2,983  $    15,882  $  1,261  $  20,126

Realized (loss) gain on
 available for sale
 investments including
 impairment write downs            (3,638)       2,280     2,463      1,105

Share of loss of associates       (24,636)           -         -    (24,636)

Fair value change in fair
 value through profit or loss
 investments                      (15,947)                          (15,947)
----------------------------------------------------------------------------
Net (loss) income                 (41,238)      18,162     3,724    (19,352)

Other comprehensive income
 (loss)                             5,596       (7,734)   (4,278)    (6,416)
----------------------------------------------------------------------------
Comprehensive (loss) income   $   (35,642) $    10,428  $   (554) $ (25,768)
----------------------------------------------------------------------------

(1)Use of non-GAAP measures:
"net operating income (loss)" is net income excluding realized gain (loss)
on AFS investments including impairment write downs, the Company's share of
income (loss) from associates and the fair value change in FVTPL investments
in the E-L Corporate portfolio, all net of tax. The term net operating
income (loss) does not have any standardized meaning according to GAAP and
therefore may not be comparable to similar measures presented by other
companies.
Contacts: E-L Financial Corporation Limited Mark M. Taylor
Executive Vice-President and Chief Financial Officer (416) 947-2578
(416) 362-2592 (FAX)
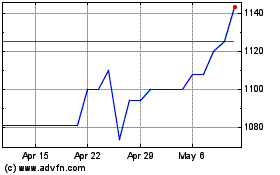
E L Financial (TSX:ELF)
Historical Stock Chart
From Oct 2024 to Nov 2024

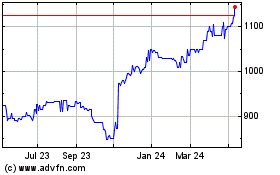
E L Financial (TSX:ELF)
Historical Stock Chart
From Nov 2023 to Nov 2024
