UNITED STATES
SECURITIES AND EXCHANGE COMMISSION
Washington, DC 20549
FORM 6-K
REPORT OF FOREIGN PRIVATE ISSUER
PURSUANT TO RULE 13a-16 OR 15d-16
UNDER THE SECURITIES EXCHANGE ACT OF 1934
For the month of August, 2024.
Commission File Number 001-38755
Suzano S.A.
(Exact name of registrant as specified in its charter)
SUZANO INC.
(Translation of Registrant’s Name into English)
Av. Professor Magalhaes Neto, 1,752
10th Floor, Rooms 1010 and 1011
Salvador, Brazil 41 810-012
(Address of principal executive office)
Indicate by check mark whether the registrant files or will file annual reports under cover of Form 20-F or Form 40-F.
Form 20-F ☒ Form 40-F ☐
Indicate by check mark if the registrant is submitting the Form 6-K in paper as permitted by Regulation S-T Rule 101(b)(1): ☐
Indicate by check mark if the registrant is submitting the Form 6-K in paper as permitted by Regulation S-T Rule 101(b)(7): ☐
Enclosures:
SIGNATURE
Pursuant to the requirements of the Securities Exchange Act of 1934, the registrant has duly caused this report to be signed on its behalf by the undersigned, thereunto duly authorized.
Date: August 09, 2024
| | | | | | | | |
| | SUZANO S.A. |
| | |
| By: | /s/ Marcelo Feriozzi Bacci |
| Name: | Marcelo Feriozzi Bacci |
| Title: | Chief Financial and Investor Relations Officer |
EarningsConference Call2Q24
Disclaimer
Thispresentationcontainswhatareconsidered“forward-lookingstatements,”asdefinedinSection27Aofthe1933SecuritiesActandSection21Eofthe1934SecuritiesExchangeAct,asamended.Someoftheseforward-lookingstatementsareidentifiedwithwordssuchas“believe,”“may,”“could,”“would,”“possible,”“will,”“should,”“expect,”“intend,”“plan,”“anticipate,”“estimate,”“potential,”“outlook”or“continue,”aswellasthenegativeformsofthesewords,othertermsofsimilarmeaningortheuseoffuturedates.
Theforward-lookingstatementsinclude,withoutlimitation,statementsrelatedtothedeclarationorpaymentofdividends,implementationofthekeyoperationalandfinancialstrategiesandinvestmentplans,guidanceaboutfutureoperationsandfactorsortrendsthatinfluencethefinancialsituation,liquidityoroperationalresults.Suchstatementsreflectthecurrentviewofthemanagementandaresubjecttodiverserisksanduncertainties.Thesearequalifiedinaccordancewiththeinherentrisksanduncertaintiesinvolvingfutureexpectationsingeneral,andactualresultscoulddiffermateriallyfromthosecurrentlyanticipatedduetovariousrisksanduncertainties.Thereisnoguaranteethattheexpectedevents,trendsorresultswillactuallyoccur.Thestatementsarebasedondiverseassumptionsandfactors,includinggeneraleconomicandmarketconditions,industryconditionsandoperatingfactors.Anychangesinsuchassumptionsorfactorscouldcauseactualresultstodiffermateriallyfromcurrentexpectations.Suzanodoesnotundertakeanyobligationtoupdateanysuchforward-lookingstatementsasaresultofnewinformation,futureeventsorotherwise,exceptasexpresslyrequiredbylaw.Allforward-lookingstatementsinthispresentationarecoveredintheirentiretybythisdisclaimer.
Inaddition,thispresentationcontainssomefinancialindicatorsthatarenotrecognizedbytheBRGAAPorIFRS.Theseindicatorsdonothaveastandardmeaningandmaynotbecomparabletoindicatorswithasimilardescriptionusedbyothercompanies.WeprovidetheseindicatorsbecauseweusethemasmeasurementsofSuzano'sperformance;theyshouldnotbeconsideredseparatelyorasareplacementforotherfinancialmetricsthathavebeendisclosedinaccordancewithBRGAAPorIFRS.
Important advances in all strategic avenues HIGHLIGHTS Pactiv Lenzing Cerrado Project Advancing in the links of the chain, always with a competitive advantage Being bold in expanding to new markets Playing a leading role in sustainability Be “Best-in-Class”in the total pulp cost vision Maintain relevance in pulp .Entry into the packaging segment in the USA Acquisition of 15% with option to acquire control Seats on the Board of Directors Investments: EUR230 M Integratedcapacity of ~420 ktons/year of paperboard Investments: USD110 M Closing expected in 4Q24 Closing expected in 4Q24
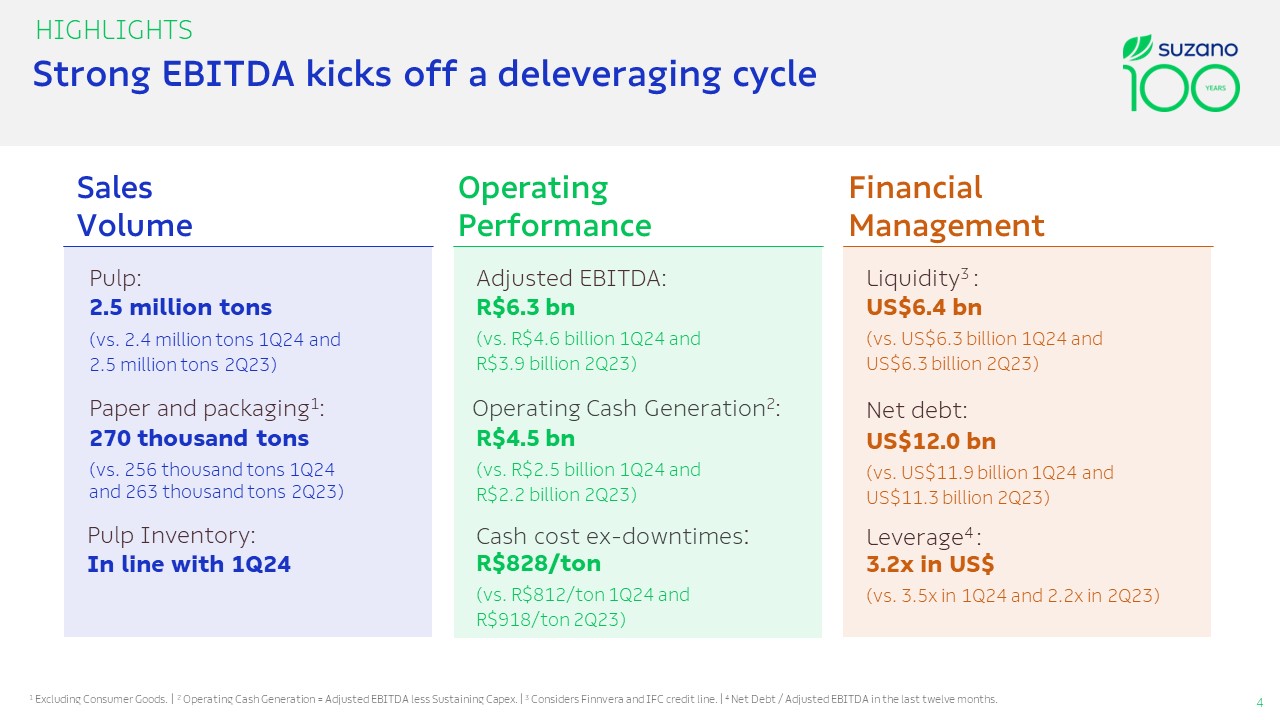
Strong EBITDA kicks off a deleveraging cycle HIGHLIGHTS Adjusted EBITDA: Liquidity3 : 2.5 million tons (vs. 2.4 million tons 1Q24 and 2.5 million tons 2Q23) Pulp: 270 thousand tons (vs. 256 thousand tons 1Q24 and 263 thousand tons 2Q23) Paper and packaging1:Pulp Inventory:In line with 1Q24 Operating Cash Generation2: Cash cost ex-downtimes: R$6.3 bn (vs. R$4.6billion 1Q24 and R$3.9 billion 2Q23) R$4.5 bn (vs. R$2.5billion 1Q24 and R$2.2 billion 2Q23) R$828/ton (vs. R$812/ton 1Q24 and R$918/ton 2Q23) US$12.0 bn (vs. US$11.9 billion 1Q24 and US$11.3 billion 2Q23) Leverage4 : US$6.4 bn (vs. US$6.3 billion 1Q24 and US$6.3 billion 2Q23) Net debt: 3.2x in US$ (vs. 3.5x in 1Q24 and 2.2x in 2Q23) Sales Volume Financial Management Operating Performance 1 Excluding Consumer Goods. | 2 Operating Cash Generation = Adjusted EBITDA less Sustaining Capex.| 3Considers Finnveraand IFC credit line. | 4Net Debt / Adjusted EBITDA in the last twelve months. 2,232 709 409 1,118 178 152 178 85 103 92 263 256 270 Paper Sales¹ (‘000 tons) Average Net Price (R$/ton) 2Q23 1Q24 2Q24 LTM 2Q24 2Q23 1Q24 2Q24 Paper Adjusted EBITDA and EBITDA Margin² R$ MM R$/ton Margin%
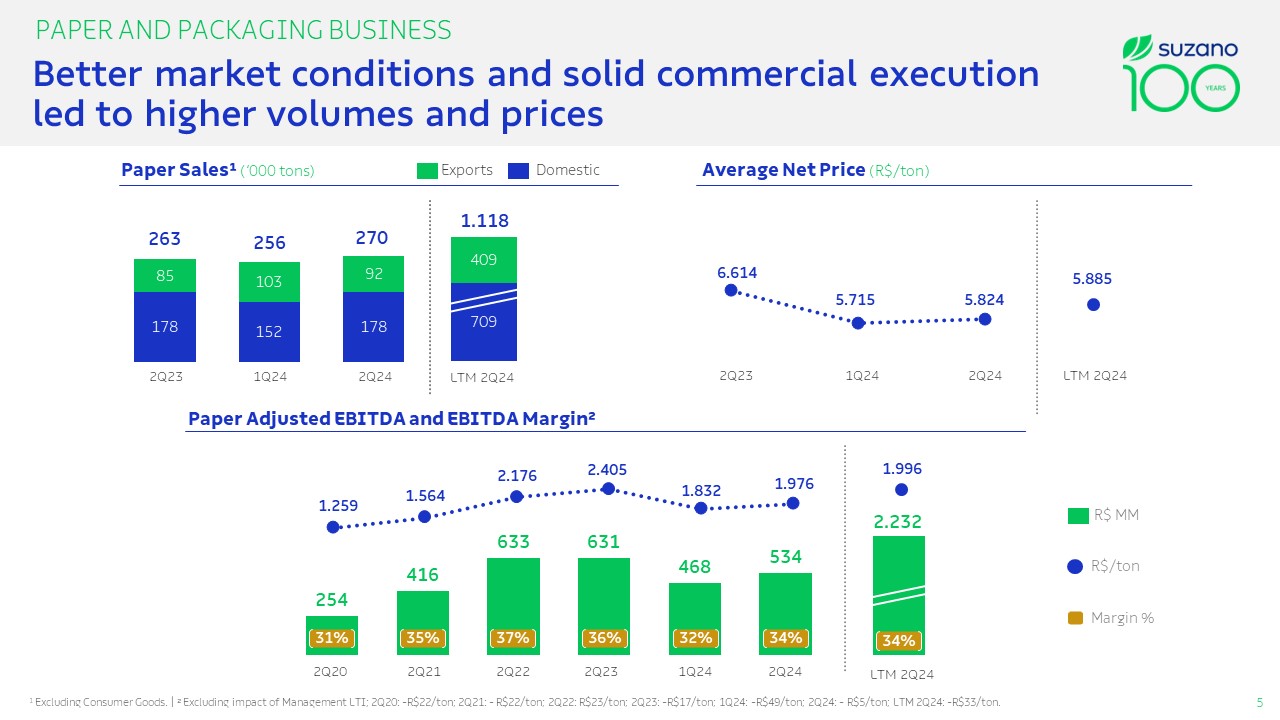
PAPER AND PACKAGING BUSINESS Better market conditions and solid commercial execution led to higher volumes and prices 1 Excluding Consumer Goods.| ² Excluding impact of Management LTI; 2Q20: -R$22/ton; 2Q21: -R$22/ton; 2Q22: R$23/ton; 2Q23: -R$17/ton; 1Q24: -R$49/ton; 2Q24: -R$5/ton; LTM 2Q24: -R$33/ton. LTM 2Q24 LTM 2Q24 2Q20 2Q21 2Q22 2Q23 1Q24 2Q24 Exports Domestic
5,885 6,614 5,715 5,824 1,996 1,259 1,564 2,176 2,405 1,832 1,976 254 416 633 631 468 534 3,190 3,902 5,537 1,269 1,625 2,176 16,108 1,580 2,513 2,401 2,545
PULP BUSINESS 2Q23 1Q24 2Q24 10,192 LTM2Q24 2Q23 1Q24 2Q24 LTM 2Q24 Average FX R$4.95 R$4.95 R$5.21 R$5.00 EBITDA increase driven by better prices, FX and sales volume R$ MM R$/ton
Margin % 2Q23 1Q24 2Q24 US$ BRL LTM2Q24 Sales Volume (‘000 tons) Average Net Price –Export Market ($/tons) Adjusted EBITDA and EBITDA Margin (%) Inventories: In line with1Q24 562 624 701 3,061 612 2,783 3,092 3,657
PULP BUSINESS Pulp Cash Cost–2Q24 vs. 1Q24 (ex-downtimes –R$/ton)Pulp Cash Cost –2Q24 vs. 2Q23 (ex-downtimes –R$/ton)Operational performance delivered as planned, keeping the cash cost stability Commodity price effect: -R$7/ton Commodity price effect: -R$42/ton Wood Input Fixed Cost Energy FX 186 342 318 337 333 1Q24 Wood Input Fixed Cost Energy FX 189 2Q24 812 828 190 400 363 337 333 2Q23 Wood Input Fixed Cost Energy FX 189 2Q24 918 828
CERRADO PROJECT New Ribas do Rio Pardo Mill Successful start-up and all eyes on learning curve progress
CERRADO PROJECT New Ribas do Rio Pardo Mill Successful start-up and all eyes on learning curve progress ¹ Inside the fence includes investments in industrial and infrastructure. | ² Total Capex Physical progress¹ and financial progress²: 500 1,000 1,500 2,000 2,500 3,000 3Q24 4Q24 1Q25 2Q25 3Q25 Learning curve conclusion Scheduled downtime 3% 10% 21% 31% 45% 57% 70% 78% 86% 94% 98% 100% 15% 23% 37% 45% 56% 65% 75% 82% 89% 94% 96% 100% 4Q21 1Q22 2Q22 3Q22 4Q22 1Q23 2Q23 3Q23 4Q23 1Q24 2Q24 3Q24 4Q24 2025 Physical progress Financial progress Expected production volume (kt) Start-up in 07/21! 2 Mt Expected accumulated production for the period Physical availability in the market
4.0 0.3 1.5 1.5 1.6 1.5 8.5 1.3 1.1 1.1 6.4 9.6 11.4 10.7 10.4 10.5 10.5 10.7 10.9 10.9 11.3 11.5 11.5 11.9 12.0 -1.5 0.5 2.5 4.5 6.5 8.5 10.5 12.5 14.5 2Q21 3Q21 4Q21 1Q22 2Q22 3Q22 4Q22 1Q23 2Q23 3Q23 4Q23 1Q24 2Q24 Leverage (Net debt/EBITDA LTM)and Net Debt (US$ billion)
FINANCIAL MANAGEMENT Financial discipline throughout the growth cycle and an even stronger balance sheet Amortization Schedule Cash on hand (33% inUS$) Stand-by facilities Average Cost(in US$): 5.1% p.a. Average Term: 78 months Liquidity 6M24 2025 2026 2027 2029 onwards 2028 Finnvera and IFC¹ ¹ Finnveraand IFC credit line. Financial Policy Limit Net debt US$ billion Leverage USD 11th Debentures Issuance Settlement 6thDebentures Issuance 3.3 2.7 2.4 2.4 2.3 2.1 2.0 1.9 2.2 2.7 3.1 3.5 3.2
Discipline in carrying out the business strategy CAPITAL ALLOCATION ¹Position upto08/08/2024 Shareholder remuneration (2Q21 to 2Q24)4 CONSECUTIVE REPURCHASE PROGRAMS1 (4th program - 84% completed) R$4.6 billion 93 million shares Average price: R$49.44 5th shares buyback program announced Authorized Volume: Up to 40 million shares Tenor: Up to 18 months DIVIDENDS/INTEREST ON EQUITY R$5.7 Billion
Investor Day2024 12.12.24 C-Level presentation + Q&A MS 12.13.24 SITE VISIT (Ribas do Rio Pardo) Takeaways oSolid operating performance as planned Cerrado Project delivered on-time and on-budget Proven financial discipline throughout the investment cycle Capital allocation focused on maximizing long-term returns Zero refinancing risk until 2029 Cash flow hedging portfolio well-aligned with the current exchange rate scenario 12 Q&A2Q24Investor Relations ir.suzano.com.br ri@suzano.com.br
Q&A2Q24Investor Relations ir.suzano.com.br ri@suzano.com.br
Suzano (NYSE:SUZ)
Historical Stock Chart
From Jul 2024 to Aug 2024

Suzano (NYSE:SUZ)
Historical Stock Chart
From Aug 2023 to Aug 2024
