Wider-than-Expected Loss at MGIC - Analyst Blog
November 14 2012 - 3:20AM
Zacks
Mortgage insurer, MGIC Investment Corporation
(MTG) reported third quarter 2012 operating loss of $1.25 per
share, substantially wider than the Zacks Consensus Estimate of a
loss of 59 cents. The company had reported an operating loss of 88
cents in the prior-year quarter.
MGIC’s GAAP net loss was $1.22 a share, compared with loss per
share of 82 cents for the year-ago quarter. The disappointing
results came on the back of elevated delinquency.
Total revenue for the quarter came in at $306.2 million, down 9.2%
year over year. Net premiums written were reported at $263.5
million, up 3.1% year over year. The company’s new insurance
written soared 80% year over year to $7.0 billion in the
quarter.
MGIC's primary insurance in force stood at $164.9 billion as of
September 30, 2012, compared with $172.9 billion as of December 31,
2011, and $179.0 billion as of September 30, 2011.
Losses incurred were $490.1 million, up 6% year over year,
primarily due to an increase in the claim rate.
Paid claims declined to $587 million, plummeting 22% year over
year. The average claim placement declined marginally to $48,000.
Management expects the current claim filing patterns to continue,
which will drag the claim payments lower in the rest of 2012 and in
2013.
Net underwriting and other expenses were $50.7 million, down 3.4%
year over year. Investment income plunged 38.0% year over year to
$30.4 million.
Persistency (the percentage of insurance remaining in force from
the previous year) was 80.2% as of September 30, 2012, compared
with 83.7% as of September 30, 2011 .
Overall, effects of the sluggish economy continue to challenge
MGIC’s financial results as well as its capital. Also, we do not
expect any reversal in the situation in the near term.
Peer Radian Group Inc. (RDN), posted third quarter
net income of 11 cents per share, substantially declining from a
profit of $1.37 per share in the year-ago quarter
MGIC INVSTMT CP (MTG): Free Stock Analysis Report
RADIAN GRP INC (RDN): Free Stock Analysis Report
To read this article on Zacks.com click here.
Zacks Investment Research
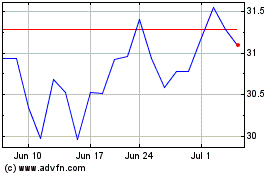
Radian (NYSE:RDN)
Historical Stock Chart
From Jun 2024 to Jul 2024

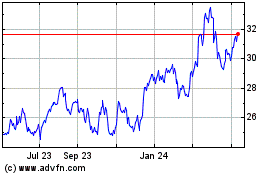
Radian (NYSE:RDN)
Historical Stock Chart
From Jul 2023 to Jul 2024
