Northeast Utilities Beats Earnings Est. - Analyst Blog
May 03 2013 - 3:49AM
Zacks
Northeast Utilities (NU) announced
first-quarter 2013 pro forma earnings of 73 cents per share,
beating the Zacks Consensus Estimate by 8 cents and year-ago level
by 30.4%.
Improvement in earnings was primarily driven by 72.6%, 13.4%, 59%,
36.2%, 31% and 194.6% year-over-year rises in Electric
Transmission, Electric Distribution and
Generation, Connecticut Light and
Power Company, Public Service Company of
New Hampshire, Western Massachusetts Electric
Company and Natural Gas Distribution
segments’ earnings, respectively. In addition, NSTAR
Electric and NU parent and other
businesses also contributed significantly.
On a GAAP basis, the company reported earnings of 72 cents per
share versus 56 cents per share a year ago. The difference between
GAAP and pro forma earnings was due to a penny cost associated with
the NSTAR merger.
Total Revenue
The company’s revenues of $1,995 million beat the Zacks Consensus
Estimate by $88 million. Quarterly revenues increased 81.4% year
over year owing to favorable performance from all the segments.
First Quarter Operational Highlights
Northeast Utilities' overall retail electric sales increased 3.2%
year over year to 13,796 Gigawatt hours. The company’s natural gas
sales were 39,422 million cubic feet, up 21.8% year over year.
Northeast Utilities’ total operating expenses increased 78.1% year
over year to $1.6 billion primarily due to higher purchased power,
fuel and transmission costs, operations and maintenance costs as
well as depreciation expenses. In addition, the company’s spending
under its Energy Efficiency Programs was also responsible for this
higher expense.
Financial Update
As of Mar 31, 2013, Northeast Utilities had cash balance of $60.8
million compared with $45.7 million as of Dec 31, 2012.
Long-term debt as of Mar 31, 2013 was $7.0 billion versus $7.2
billion as of Dec 31, 2012.
Net cash provided by operating activities during the first three
months of 2013 was $473.1 million, significantly higher than $8.8
million in the year-ago comparable period.
Capital expenditures increased to $389 million from $304.3 million
a year ago.
Guidance
Northeast Utilities reaffirmed its full-year 2013 earnings guidance
in the range of $2.40 to $2.60 per share.
Other Utility Company Releases
Exelon Corporation (EXC) announced first quarter
operating earnings of 70 cents per share, beating the Zacks
Consensus Estimate by 2 cents.
Entergy Corporation (ETR) reported first quarter
operational earnings of 94 cents per share that came at par with
the Zacks Consensus Estimate.
American Electric Power Co. Inc. (AEP) reported
first quarter earnings of 80 cents per share that were in line with
the Zacks Consensus Estimate.
Our View
In first-quarter 2013, Northeast Utilities experienced positive
impacts from its recently completed NSTAR-merger. Both NSTAR
Electric as well as NSTAR Gas Company performed well. We believe
this merger continues to aid the company to increase its scale of
operations and serve a wider customer base in the future.
In addition, the company expects its Greater Springfield
Reliability project to contribute significantly in 2013 as it will
be online by this year. Western Massachusetts Electric Company’s
improvement in earnings primarily generated from this project as
its 345 kilovolt (kV) portion energized in the first quarter.
However, over dependence on transmission and distribution
businesses, and stringent regulations, may to some extent restrict
the company’s future performance.
Hartford, Conn. and Boston, Mass.-based Northeast Utilities
provides energy delivery services to residential, commercial and
industrial customers in Connecticut, New Hampshire and
Massachusetts. The company currently has a Zacks Rank #2 (Buy).
AMER ELEC PWR (AEP): Free Stock Analysis Report
ENTERGY CORP (ETR): Free Stock Analysis Report
EXELON CORP (EXC): Free Stock Analysis Report
NORTHEAST UTIL (NU): Free Stock Analysis Report
To read this article on Zacks.com click here.
Zacks Investment Research
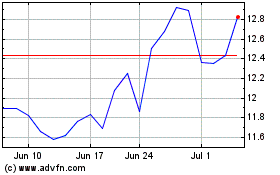
Nu (NYSE:NU)
Historical Stock Chart
From Jun 2024 to Jul 2024

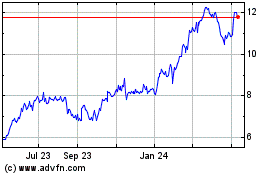
Nu (NYSE:NU)
Historical Stock Chart
From Jul 2023 to Jul 2024
