McKesson Down 44.06% From May 2015 All-Time High -- Data Talk
June 28 2018 - 5:15PM
Dow Jones News
McKesson Corporation (MCK) closed at $135.80, down $8.86 or
6.12%
-- Lowest close since Nov. 6, 2017, when it closed at
$135.21
-- Largest percent decrease since Jan. 26, 2017, when it fell
8.31%
-- Down five of the past six days
-- Down 44.06% from its all-time closing high of $242.75 on May
18, 2015
-- Today's preliminary volume is 4.68 million shares; highest
since Oct. 26, 2017 when 7.2 million shares were traded
-- Third worst performer in the S&P 500 today
Source: Dow Jones Market Data, FactSet
(END) Dow Jones Newswires
June 28, 2018 17:00 ET (21:00 GMT)
Copyright (c) 2018 Dow Jones & Company, Inc.
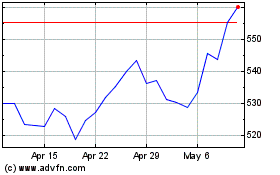
McKesson (NYSE:MCK)
Historical Stock Chart
From Jun 2024 to Jul 2024

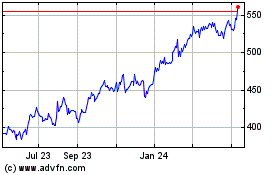
McKesson (NYSE:MCK)
Historical Stock Chart
From Jul 2023 to Jul 2024
