UNITED STATES SECURITIES AND EXCHANGE COMMISSION
Washington, D.C. 20549
Form 6-K
Report of Foreign Private Issuer
Pursuant to Rule 13a-16 or 15d-16 of the Securities
Exchange Act of 1934
For the quarter ended June 30, 2023
Commission File Number 001-35754
Infosys Limited
(Exact name of Registrant as specified in its charter)
Not Applicable
(Translation of Registrant's name into English)
Electronics City, Hosur Road, Bengaluru - 560 100,
Karnataka, India. +91-80-2852-0261
(Address of principal executive offices)
Indicate by check mark whether the registrant files
or will file annual reports under cover Form 20-F or Form 40-F:
Form
20-F þ Form
40-F o
Indicate by check mark if the registrant is submitting
the Form 6-K in paper as permitted by Regulation S-T Rule 101(b)(1): o
Indicate by check mark if the registrant is submitting
the Form 6-K in paper as permitted by Regulation S-T Rule 101(b)(7): o
TABLE OF CONTENTS
DISCLOSURE OF RESULTS OF OPERATIONS AND FINANCIAL
CONDITION
Infosys Limited (“Infosys” or “the Company” or “we”) hereby furnishes the United States Securities and Exchange Commission with copies of the following information concerning
our public disclosures regarding our results of operations and financial condition for the quarter ended June 30, 2023.
The following information shall not be deemed
"filed" for purposes of Section 18 of the Securities Exchange Act of 1934, as amended (the "Exchange Act"), or incorporated
by reference in any filing under the Securities Act of 1933, as amended, or the Exchange Act, except as shall be expressly set forth by
specific reference in such a filing.
On July 20, 2023, We announced our results of operations
for the quarter ended June 30, 2023. We issued press releases announcing our results under International Financial Reporting Standards
(“IFRS”) in U.S. dollars and Indian rupees, copies of which are attached to this Form 6-K as Exhibits 99.1 and 99.2, respectively.
On July 20, 2023, we held a press conference
to announce our results, which was followed by a question and answer session. The transcript of this press conference is attached to this
Form 6-K as Exhibit 99.3.
We have also made available to the public
on our website, www.infosys.com, a fact sheet that provides details on our profit and loss account summary for the quarters ended June 30, 2023 and 2022 (as per IFRS); revenue by client geography offering, business segment, revenue by offering; information regarding our client
concentration; employee information and metrics; and consolidated IT services information. We have attached this fact sheet to this Form
6-K as Exhibit 99.4.
On July 20, 2023, we also held a teleconference
with investors and analysts to discuss our results. The transcripts of the teleconference are attached to this Form 6-K as Exhibit 99.5.
We placed form of releases to stock exchanges
and advertisements in certain Indian newspapers concerning our results of operations for the quarter ended June 30, 2023, under Ind AS.
A copy of the release to the stock exchanges and the advertisement is attached to this Form 6-K as Exhibit 99.6.
We have made available to the public on our website,
www.infosys.com, the following: Audited Interim Condensed Financial Statements in compliance with IFRS in US dollars and the Auditors
Report; Audited Interim Condensed Financial Statements in compliance with IFRS in Indian Rupees and the Auditors Report; Audited Interim
Ind AS Condensed Standalone Financial Statements and the Auditors Report; Audited Interim Ind AS Condensed Consolidated Financial Statements
and the Auditors Report for the quarter June 30, 2023. We have attached these documents to this Form 6-K as Exhibits 99.7, 99.8, 99.9
and 99.10, respectively.
SIGNATURES
Pursuant to the requirements of the Securities Exchange Act of 1934, the
registrant has duly caused this report to be signed on its behalf by the undersigned, thereunto duly authorized.
| |
Infosys Limited
|
| |
|
|
Date: July 25, 2023 |
Inderpreet Sawhney
General Counsel and Chief Compliance Officer |
INDEX TO EXHIBITS
| Exhibit No. |
Description of Document |
| 99.1 |
IFRS USD press release |
| 99.2 |
IFRS INR press release |
| 99.3 |
Transcript of July 20, 2023 press conference |
| 99.4 |
Fact Sheet regarding Registrant's Statement of Profit and Loss for the quarters ended June 30, 2023 and 2022 (as per IFRS); revenue by Business Segment, Client Geography, information regarding Client Concentration; Employee Information and Metrics and Consolidated IT Services Information |
| 99.5 |
Transcript of July 20, 2023 earnings call |
| 99.6 |
Form of release to stock exchanges and advertisement placed in Indian newspapers |
| 99.7 |
Audited Interim Condensed Consolidated Financial Statements of Infosys Limited and its Subsidiaries in compliance with International Financial Reporting Standards (IFRS) in US Dollars and the Auditors Report thereon |
| 99.8 |
Audited Interim Consolidated Financial Statements of Infosys Limited and its Subsidiaries in compliance with IFRS in Indian Rupees and the Auditors Report thereon |
| 99.9 |
Audited
Interim Condensed Financial Statements of Infosys Limited for the quarter ended June 30, 2023 in compliance with Indian Accounting
Standards (INDAS) and the Auditors Report thereon |
| 99.10 |
Audited
Interim Condensed Consolidated Financial Statements of Infosys Limited and its subsidiaries in compliance with INDAS for the quarter
ended June 30, 2023 and the Auditors Report thereon |
Exhibit 99.1
IFRS USD Press Release
Solid
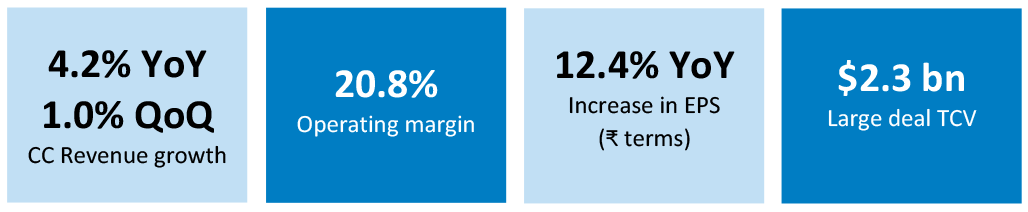
Q1 year on year revenue growth of 4.2% at 20.8% operating margins
Strong
large deal closures and robust deal pipeline position us well for future growth
Bengaluru,
India – July 20, 2023: Infosys (NSE, BSE, NYSE:INFY), a global leader in next-generation digital services and consulting, delivered
$4,617 million in Q1 revenues with year on year growth of 4.2% and sequential growth of 1.0% in constant currency. Large deal TCV for
the quarter was at $2.3 billion, with net new of 56.1%. Operating margin for the quarter was stable at 20.8%. ROE improved 180 bps to
32.8%. Attrition declined further to 17.3%. FY24 revenue guidance revised to 1.0%-3.5% and operating margin guidance retained at 20%-22%.
“We
had a solid Q1 with a growth of 4.2% and large deals of $2.3 billion which helps us to set a strong foundation for future growth. Our
generative AI capabilities are expanding well, with 80 active client projects. Topaz, our comprehensive AI offering, is resonating well
with clients. We see this being transformative for clients and enhancing our overall service portfolio” said Salil Parekh, CEO
and MD. “We have expanded the margin improvement program with a holistic set of actions for the short, medium and long-term,
working on five key areas, supported by our leadership team“, he added.
Guidance
for FY24:
| · | Revenue
growth of 1.0%-3.5% in constant currency |
| · | Operating
margin of 20%-22% |
| For
the quarter ended June 30, 2023 |
·
Revenues in CC terms grew by 4.2% YoY and by 1.0% QoQ
·
Reported revenues at $4,617 million, growth of 3.9% YoY
·
Operating margin at 20.8%, growth of 0.8% YoY and decline of 0.2% QoQ
·
Basic EPS at $0.17, growth of 6.6% YoY
·
FCF at $699 million, growth of 6.6% YoY; FCF conversion at 96.6% of net profit
|
“Q1
operating margins were resilient in an uncertain macro environment on the back of our continued focus on cost optimization. Company’s
rigorous operational discipline including improved productivity measures and higher utilization helped margins for the quarter”
said Nilanjan Roy, CFO. “Free Cash conversion was robust at 96.6% of net profits. Execution of strong capital allocation
policy resulted in higher payouts to investors and improved ROE to 32.8%” he added.
2. Client
wins & Testimonials
| · | Danske
Bank recently signed a strategic collaboration with Infosys to accelerate the bank’s digital transformation initiatives with speed
and scale. Frans Woelders, Chief Operating Officer, Danske Bank, said, “Our Forward ’28 strategy sets clear ambitions
for Danske Bank to be a leading bank in a digital age. This is backed by significant investments in digitalisation and technology, including
plans to further develop our customer-facing digital solutions, and modernising our technology infrastructure to enable even better customer
experiences and drive operational efficiency. We have a strong starting point, and we want to further accelerate our digital and technology
transformation. We have conducted a thorough process to find a partner that can help us achieve that. Infosys has the tools, experience,
and expertise to support us in accelerating our transformation using cloud and AI technologies. Given Infosys’ global presence and
scale, this collaboration will also give us access to wider talent pools and capabilities.” |
| · | bp
recently signed an MoU with Infosys to demonstrate their intent for Infosys to be bp’s
primary partner for end-to-end application services. Leigh-Ann Russell, EVP, Innovation
& Engineering, bp, said, “We are delighted to further develop our relationship
with Infosys to help accelerate our digital transformation and scale growth through tech-enabled
operations. Together, we look forward to delivering innovative solutions that meet the evolving
needs of our customers and drive growth for the future." |
| · | Infosys
and Aramco signed a Memorandum of Understanding (MoU) to bring new insights to HR data and analytics, scale the use of automation tools,
and enhance employee experience through artificial intelligence (AI) technologies. Faisal A. Al-Hajji, SVP Human Resources, Aramco,
said, “At Aramco, we are constantly looking to improve employee experience and make our company the best place to work. This collaboration
will allow us to explore ways to further upgrade our focus on customer-centricity and transform our digital HR offerings.” |
| · | Infosys
recently launched Infosys Topaz - an AI-first set of services, solutions and platforms using generative AI technologies. Hemanth Adapa,
Product Owner, Predictive Analytics at British Telecom, said, “As part of our continuous efforts to deliver value for our clients,
at British Telecom, we engaged with Infosys Topaz to offer AI-powered predictive analytics for various domains such as network performance,
sustainability, and security. This has been recognized and appreciated by our clients who can now amplify their mission-critical services
with never-before reliability.” |
| · | Infosys
and Walmart Commerce Technologies collaborated to deliver scalable omni-channel solutions to retailers. Sunil Kumar, Vice President
and General Manager of Walmart Commerce Technologies, said, “Infosys is a trusted partner to businesses that are navigating
their digital transformation. We are excited to have Infosys help streamline implementation of the Store Assist app and to serve as a
trusted system integration team for our customers.” |
| · | Infosys
collaborated with vidaXL as their India IT Partner to set up their business technology support in a scalable and cost-effective way. Ted
van Dongen, CIO, vidaXL, said, “vidaXL needed a partner to help them with their growth strategy, with a professional agile approach,
and a very broad range technology expertise. In Infosys, vidaXL has found a partner that proved to be dedicated in delivering this by
transitioning 8 agile development teams in less than 4 months. This collaboration establishes a mechanism to steer our corporation significantly
on every aspect of the technology stack.” |
| · | Infosys
extended its collaboration with LexisNexis to provide end-to-end information services across their range of content, enterprise, and product
applications. Jeff Reihl, Executive Vice President & Chief Technology Officer, LexisNexis, said, “Our longstanding association
with the highly experienced Infosys team has shown excellent results. We at LexisNexis aim to deliver the best content, enterprise, and
product application services in the market and we firmly believe that by leveraging Infosys for its downstream, discretionary, and strategic
programs, will be in our best interest and we are excited to further expand our relationship with Infosys.” |
| · | Infosys
and ATP collaborated to launch a digital Carbon Tracker to enable ATP players to track and mitigate their carbon emissions from travel
on Tour. Massimo Calvelli, Chief Executive Officer, ATP, said, “Tennis is on a mission to Net Zero and like many sports,
our travel footprint is our biggest challenge. ATP’s new Carbon Tracker makes it simple for players to join that journey, mitigating
their impact today and inspiring greener choices tomorrow. This is a story of addressing difficult problems through innovation, and we
would thank our partners Infosys for their collaboration and commitment to the project. The potential of this app is massive and we’re
just getting started.” |
| · | Keytrade
Bank selected Infosys Finacle as the preferred partner for the modernization of its core banking system. Thierry Ternier, CEO, Keytrade
Bank, said, “As the sponsor of the project, I am a strong believer in the program because it will strengthen the foundations
of our company and make us future-proof to tackle the challenges of a fast-moving environment. Our ultimate goal is to create value and
satisfaction for our customers and employees. I am convinced that this program will be a major enabler in reaching those strategic goals.
We have chosen Infosys Finacle as our partner for the program because of their worldwide expertise, implementation plan, and price offering.” |
| · | Infosys
Finacle helped successfully transform XacBank’s technology landscape with Finacle Digital Banking Suite enabling a robust digital
foundation for the bank to achieve its growth strategy. Tsevegjav Gumenjav, Chief Executive Officer, XacBank, said, “We are
happy at the successful completion of this much-awaited digital transformation, drawing us closer to our vision to be the preferred universal
bank in Mongolia. In this digital-first era, the Finacle platform provides us with the right platform to offer custom offerings for our
customers in Mongolia across segments, serving their financial needs in a secure manner. We look forward to scaling new heights with world-class
banking and contribute to the larger economic development of Mongolia.” |
3. Recognitions
| · | Infosys has been recognized in BrandZ's
prestigious Top 100 Most Valuable Global Brands list, ranked at #66 |
| · | Recognized as one of India's Best
Employers Among Nation Builders 2023 by the Great Place to Work™ Institute |
| · | Won
PeopleFirst HR Award under two categories, ‘Leading Practices in HR Risk Management’ and ‘Leading Practices in HR Business
Partnership’ |
| · | Recognized
as one of the ‘Most Honored’ companies, receiving multiple awards at the 2023 All-Asia Executive Team Rankings from Institutional
Investor |
| · | Won the 2023 Microsoft US Partner
of the Year Award in the Dynamics 365 Services category |
| · | Awarded
the Nasscom ER&D Spotlight Award in the ‘Concept to Engineering Leadership’ category for the Market First Innovation –
Digital transformation of B2B sales with Engineering configurator as a core |
| · | Recognized
as ServiceNow Telco Partner of the Year 2023 |
| · | Recognized
as HPE Global System Integrator of the Year 2023 and HPE System Integrator of the Year 2023 for Asia Pacific and Central Europe |
| · | Infosys
Finacle won the MEA Finance ‘Best Composable Banking Technology Solution Provider’ award at the MEA Finance Banking Technology
Summit 2023 |
| · | Infosys
BPM won the SS&C Blue Prism Partner Excellence Awards 2023 across 3 categories: ‘Client Business Impact – FSI (Global)’,
‘Client Business Impact – FSI (APAC)’, and ‘Client Business Impact – Telco (APAC)’ |
| · | Recognized
as a leader in Low-Code Application Development Services PEAK Matrix® Assessment 2023 by Everest |
| · | Recognized
as a leader in Microsoft Dynamics 365 Services PEAK Matrix® Assessment 2023 by Everest |
| · | Recognized
as a leader in Application Automation Services PEAK Matrix® Assessment 2023 by Everest |
| · | Recognized
as a leader in 5G Engineering Services PEAK Matrix® Assessment 2023 by Everest |
| · | Recognized
as a leader in Wealth and Asset Management PEAK Matrix® Assessment 2023 by Everest |
| · | Rated
as a leader in Adobe Experience Cloud Services NEAT 2023 by NelsonHall |
| · | Rated
as a leader in SAP Cloud Migration Services NEAT 2023 by NelsonHall |
| · | Rated
as a leader in Quality Engineering NEAT 2023 by NelsonHall |
| · | Positioned
as a leader in HFS Horizons: ServiceNow Services, 2023 |
| · | Positioned
as a leader in HFS Horizons: Data modernization services, 2023 |
| · | Positioned
as a leader in IDC MarketScape: Worldwide Retail Commerce Platform Service Providers 2023 Vendor Assessment |
| · | Positioned
as a leader in IDC MarketScape Worldwide Artificial Intelligence Services 2023 Vendor Assessment |
| · | Positioned
as a leader in IDC MarketScape: Asia/Pacific Oracle Application Implementation Services 2023 Vendor Assessment |
| · | Infosys
recognized as a leader in Digital Engineering Services 2023 ISG Provider Lens™ study in US and Europe |
| · | Infosys
recognized as a leader in Microsoft Cloud Ecosystem 2023 ISG Provider Lens™ study in US, UK, Singapore and Malaysia, Australia and
Germany |
| · | Infosys
rated as a leader in SAP Ecosystem ISG Provider Lens™ study in US, UK, Nordics, Germany and Brazil |
| · | Infosys
recognized as #1 Top IT Service Providers in the Nordics in Whitelane Research and PA Consulting Sourcing Study 2023 |
| · | Infosys
rated as a leader in Avasant’s Multisourcing Service Integration 2022–2023 Radarview™ |
| · | Infosys
rated as a leader in Avasant’s Financial Services Digital Services 2023–2024 Radarview™ |
| · | Infosys
rated as a leader in Avasant’s Media and Entertainment Digital Services 2023–2024 Radarview™ |
About
Infosys
Infosys
is a global leader in next-generation digital services and consulting. Over 300,000 of our
people work to amplify human potential and create the next opportunity for people, businesses
and communities. We enable clients in more than 56 countries to navigate their digital transformation.
With over four decades of experience in managing the systems and workings of global enterprises,
we expertly steer clients, as they navigate their digital transformation powered by the cloud.
We enable them with an AI-powered core, empower the business with agile digital at scale
and drive continuous improvement with always-on learning through the transfer of digital
skills, expertise, and ideas from our innovation ecosystem. We are deeply committed to being
a well-governed, environmentally sustainable organization where diverse talent thrives in
an inclusive workplace.
Visit
www.infosys.com to see how Infosys (NSE, BSE, NYSE: INFY) can help your enterprise navigate your next. |
 |
Safe
Harbor
Certain
statements in this release concerning our future growth prospects, or our future financial or operating performance are forward-looking
statements intended to qualify for the 'safe harbor' under the Private Securities Litigation Reform Act of 1995, which involve a number
of risks and uncertainties that could cause actual results or outcomes to differ materially from those in such forward-looking statements.
The risks and uncertainties relating to these statements include, but are not limited to, risks and uncertainties regarding the execution
of our business strategy, our ability to attract and retain personnel, our transition to hybrid work model, economic uncertainties, technological
innovations such as Generative AI, the complex and evolving regulatory landscape including immigration regulation changes, our ESG vision,
our capital allocation policy and expectations concerning our market position, future operations, margins, profitability, liquidity,
capital resources, and our corporate actions including acquisitions. Important factors that may cause actual results or outcomes to differ
from those implied by the forward-looking statements are discussed in more detail in our US Securities and Exchange Commission filings
including our Annual Report on Form 20-F for the fiscal year ended March 31, 2023. These filings are available at www.sec.gov. Infosys
may, from time to time, make additional written and oral forward-looking statements, including statements contained in the Company's
filings with the Securities and Exchange Commission and our reports to shareholders. The Company does not undertake to update any forward-looking
statements that may be made from time to time by or on behalf of the Company unless it is required by law.
Contact
| Investor
Relations |
Sandeep
Mahindroo
+91
80 3980 1018
Sandeep_Mahindroo@infosys.com |
|
| Media
Relations |
Rishi
Basu
+91
80 4156 3998
Rajarshi.Basu@infosys.com |
Harini
Babu
+1
469 996 3516
Harini_Babu@infosys.com |
Infosys
Limited and subsidiaries
Extracted
from the Condensed Consolidated Balance Sheet under IFRS as at:
(Dollars
in millions)
| |
June
30, 2023 |
March
31, 2023 |
| ASSETS |
|
|
| Current
assets |
|
|
| Cash
and cash equivalents |
1,501 |
1,481 |
| Earmarked
bank balance for dividend(3) |
885 |
- |
| Current
investments |
675 |
841 |
| Trade
receivables |
3,191 |
3,094 |
| Unbilled
revenue |
1,783 |
1,861 |
| Other
Current assets |
1,408 |
1,349 |
| Total
current assets |
9,443 |
8,626 |
| Non-current
assets |
|
|
| Property,
plant and equipment and Right-of-use assets |
2,497 |
2,516 |
| Goodwill
and other Intangible assets |
1,082 |
1,095 |
| Non-current
investments |
1,462 |
1,530 |
| Unbilled
revenue |
168 |
176 |
| Other
non-current assets |
1,355 |
1,369 |
| Total
non-current assets |
6,564 |
6,686 |
| Total
assets |
16,007 |
15,312 |
| LIABILITIES
AND EQUITY |
|
|
| Current
liabilities |
|
|
| Trade
payables |
458 |
470 |
| Unearned
revenue |
894 |
872 |
| Employee
benefit obligations |
310 |
292 |
| Other
current liabilities and provisions |
4,005 |
3,135 |
| Total
current liabilities |
5,667 |
4,769 |
| Non-current
liabilities |
|
|
| Lease
liabilities |
812 |
859 |
| Other
non-current liabilities |
407 |
460 |
| Total
non-current liabilities |
1,219 |
1,319 |
| Total
liabilities |
6,886 |
6,088 |
| Total
equity attributable to equity holders of the company |
9,069 |
9,172 |
| Non-controlling
interests |
52 |
52 |
| Total
equity |
9,121 |
9,224 |
| Total
liabilities and equity |
16,007 |
15,312 |
Extracted
from the Condensed Consolidated statement of Comprehensive Income under IFRS for:
(Dollars
in millions except per equity share data)
| |
3
months ended June 30, 2023 |
3
months ended June 30, 2022 |
| Revenues |
4,617 |
4,444 |
| Cost
of sales |
3,211 |
3,144 |
| Gross
profit |
1,406 |
1,300 |
| Operating
expenses: |
|
|
| Selling
and marketing expenses |
217 |
193 |
| Administrative
expenses |
228 |
219 |
| Total
operating expenses |
445 |
412 |
| Operating
profit |
961 |
888 |
| Other
income, net (4) |
57 |
80 |
| Profit
before income taxes |
1,018 |
968 |
| Income
tax expense |
294 |
279 |
| Net
profit (before minority interest) |
724 |
689 |
| Net
profit (after minority interest) |
724 |
689 |
| Basic
EPS ($) |
0.17 |
0.16 |
| Diluted
EPS ($) |
0.17 |
0.16 |
NOTES:
| 1. | | The
above information is extracted from the audited condensed consolidated Balance sheet and
Statement of Comprehensive Income for the quarter ended June 30, 2023, which have been taken
on record at the Board meeting held on July 20, 2023. |
| 2. | | A
Fact Sheet providing the operating metrics of the Company can be downloaded from www.infosys.com. |
| 3. | | Represents
bank balance earmarked for final dividend. Payment date for dividend was July 3, 2023 |
| 4. | | Other
income is net of Finance Cost. |
Exhibit 99.2
IFRS INR Press Release
Solid
Q1 year on year revenue growth of 4.2% at 20.8% operating margins
Strong
large deal closures and robust deal pipeline position us well for future growth
Bengaluru,
India – July 20, 2023: Infosys (NSE, BSE, NYSE:INFY), a global leader in next-generation digital
services and consulting, delivered $4,617 million in Q1 revenues with year on year growth of 4.2% and sequential growth of 1.0% in constant
currency. Large deal TCV for the quarter was at $2.3 billion, with net new of 56.1%. Operating margin for the quarter was stable at 20.8%.
ROE improved 180 bps to 32.8%. Attrition declined further to 17.3%. FY24 revenue guidance revised to 1.0%-3.5% and operating margin guidance
retained at 20%-22%.
“We
had a solid Q1 with a growth of 4.2% and large deals of $2.3 billion which helps us to set a strong foundation for future growth. Our
generative AI capabilities are expanding well, with 80 active client projects. Topaz, our comprehensive AI offering, is resonating well
with clients. We see this being transformative for clients and enhancing our overall service portfolio” said Salil Parekh, CEO
and MD. “We have expanded the margin improvement program with a holistic set of actions for the short, medium and long-term,
working on five key areas, supported by our leadership team“, he added.
Guidance
for FY24:
| · | Revenue
growth of 1.0%-3.5% in constant currency |
| · | Operating
margin of 20%-22% |
| For
the quarter ended June 30, 2023 |
·
Revenues in CC terms grew by 4.2% YoY and by 1.0% QoQ
·
Reported revenues at  37,933 crore, growth of 10.0% YoY 37,933 crore, growth of 10.0% YoY
·
Operating margin at 20.8%, growth of 0.7% YoY and decline of 0.2% QoQ
·
Basic EPS at 14.37, growth of 12.4% YoY
·
FCF at 5,749 crore, growth of 12.6% YoY; FCF conversion at 96.7% of net
profit
|
“Q1
operating margins were resilient in an uncertain macro environment on the back of our continued focus on cost optimization. Company’s
rigorous operational discipline including improved productivity measures and higher utilization helped margins for the quarter”
said Nilanjan Roy, CFO. “Free Cash conversion was robust at 96.6% of net profits. Execution of strong capital allocation
policy resulted in higher payouts to investors and improved ROE to 32.8%” he added.
2. Client
wins & Testimonials
| · | Danske
Bank recently signed a strategic collaboration with Infosys to accelerate the bank’s digital transformation initiatives with speed
and scale. Frans Woelders, Chief Operating Officer, Danske Bank, said, “Our Forward ’28 strategy sets clear ambitions
for Danske Bank to be a leading bank in a digital age. This is backed by significant investments in digitalisation and technology, including
plans to further develop our customer-facing digital solutions, and modernising our technology infrastructure to enable even better customer
experiences and drive operational efficiency. We have a strong starting point, and we want to further accelerate our digital and technology
transformation. We have conducted a thorough process to find a partner that can help us achieve that. Infosys has the tools, experience,
and expertise to support us in accelerating our transformation using cloud and AI technologies. Given Infosys’ global presence and
scale, this collaboration will also give us access to wider talent pools and capabilities.” |
| · |
bp recently signed an MoU with Infosys to demonstrate their intent for Infosys to be bp’s primary partner for end-to-end application services. Leigh-Ann Russell, EVP, Innovation & Engineering, bp, said, “We are delighted to further develop our relationship with Infosys to help accelerate our digital transformation and scale growth through tech-enabled operations. Together, we look forward to delivering innovative solutions that meet the evolving needs of our customers and drive growth for the future." |
| · | Infosys
and Aramco signed a Memorandum of Understanding (MoU) to bring new insights to HR data and analytics, scale the use of automation tools,
and enhance employee experience through artificial intelligence (AI) technologies. Faisal A. Al-Hajji, SVP Human Resources, Aramco,
said, “At Aramco, we are constantly looking to improve employee experience and make our company the best place to work. This collaboration
will allow us to explore ways to further upgrade our focus on customer-centricity and transform our digital HR offerings.” |
| · | Infosys
recently launched Infosys Topaz - an AI-first set of services, solutions and platforms using generative AI technologies. Hemanth Adapa,
Product Owner, Predictive Analytics at British Telecom, said, “As part of our continuous efforts to deliver value for our clients,
at British Telecom, we engaged with Infosys Topaz to offer AI-powered predictive analytics for various domains such as network performance,
sustainability, and security. This has been recognized and appreciated by our clients who can now amplify their mission-critical services
with never-before reliability.” |
| · | Infosys
and Walmart Commerce Technologies collaborated to deliver scalable omni-channel solutions to retailers. Sunil Kumar, Vice President
and General Manager of Walmart Commerce Technologies, said, “Infosys is a trusted partner to businesses that are navigating
their digital transformation. We are excited to have Infosys help streamline implementation of the Store Assist app and to serve as a
trusted system integration team for our customers.” |
| · | Infosys
collaborated with vidaXL as their India IT Partner to set up their business technology support in a scalable and cost-effective way. Ted
van Dongen, CIO, vidaXL, said, “vidaXL needed a partner to help them with their growth strategy, with a professional agile approach,
and a very broad range technology expertise. In Infosys, vidaXL has found a partner that proved to be dedicated in delivering this by
transitioning 8 agile development teams in less than 4 months. This collaboration establishes a mechanism to steer our corporation significantly
on every aspect of the technology stack.” |
| · | Infosys
extended its collaboration with LexisNexis to provide end-to-end information services across their range of content, enterprise, and product
applications. Jeff Reihl, Executive Vice President & Chief Technology Officer, LexisNexis, said, “Our longstanding association
with the highly experienced Infosys team has shown excellent results. We at LexisNexis aim to deliver the best content, enterprise, and
product application services in the market and we firmly believe that by leveraging Infosys for its downstream, discretionary, and strategic
programs, will be in our best interest and we are excited to further expand our relationship with Infosys.” |
| · | Infosys
and ATP collaborated to launch a digital Carbon Tracker to enable ATP players to track and mitigate their carbon emissions from travel
on Tour. Massimo Calvelli, Chief Executive Officer, ATP, said, “Tennis is on a mission to Net Zero and like many sports,
our travel footprint is our biggest challenge. ATP’s new Carbon Tracker makes it simple for players to join that journey, mitigating
their impact today and inspiring greener choices tomorrow. This is a story of addressing difficult problems through innovation, and we
would thank our partners Infosys for their collaboration and commitment to the project. The potential of this app is massive and we’re
just getting started.” |
| · | Keytrade
Bank selected Infosys Finacle as the preferred partner for the modernization of its core banking system. Thierry Ternier, CEO, Keytrade
Bank, said, “As the sponsor of the project, I am a strong believer in the program because it will strengthen the foundations
of our company and make us future-proof to tackle the challenges of a fast-moving environment. Our ultimate goal is to create value and
satisfaction for our customers and employees. I am convinced that this program will be a major enabler in reaching those strategic goals.
We have chosen Infosys Finacle as our partner for the program because of their worldwide expertise, implementation plan, and price offering.” |
| · | Infosys
Finacle helped successfully transform XacBank’s technology landscape with Finacle Digital Banking Suite enabling a robust digital
foundation for the bank to achieve its growth strategy. Tsevegjav Gumenjav, Chief Executive Officer, XacBank, said, “We are
happy at the successful completion of this much-awaited digital transformation, drawing us closer to our vision to be the preferred universal
bank in Mongolia. In this digital-first era, the Finacle platform provides us with the right platform to offer custom offerings for our
customers in Mongolia across segments, serving their financial needs in a secure manner. We look forward to scaling new heights with world-class
banking and contribute to the larger economic development of Mongolia.” |
3. Recognitions
| · | Infosys has been recognized in BrandZ's
prestigious Top 100 Most Valuable Global Brands list, ranked at #66 |
| · | Recognized as one of India's Best
Employers Among Nation Builders 2023 by the Great Place to Work™ Institute |
| · | Won
PeopleFirst HR Award under two categories, ‘Leading Practices in HR Risk Management’ and ‘Leading Practices in HR Business
Partnership’ |
| · | Recognized
as one of the ‘Most Honored’ companies, receiving multiple awards at the 2023 All-Asia Executive Team Rankings from Institutional
Investor |
| · | Won the 2023 Microsoft US Partner
of the Year Award in the Dynamics 365 Services category |
| · | Awarded
the Nasscom ER&D Spotlight Award in the ‘Concept to Engineering Leadership’ category for the Market First Innovation –
Digital transformation of B2B sales with Engineering configurator as a core |
| · | Recognized
as ServiceNow Telco Partner of the Year 2023 |
| · | Recognized
as HPE Global System Integrator of the Year 2023 and HPE System Integrator of the Year 2023 for Asia Pacific and Central Europe |
| · | Infosys
Finacle won the MEA Finance ‘Best Composable Banking Technology Solution Provider’ award at the MEA Finance Banking Technology
Summit 2023 |
| · | Infosys
BPM won the SS&C Blue Prism Partner Excellence Awards 2023 across 3 categories: ‘Client Business Impact – FSI (Global)’,
‘Client Business Impact – FSI (APAC)’, and ‘Client Business Impact – Telco (APAC)’ |
| · | Recognized
as a leader in Low-Code Application Development Services PEAK Matrix® Assessment 2023 by Everest |
| · | Recognized
as a leader in Microsoft Dynamics 365 Services PEAK Matrix® Assessment 2023 by Everest |
| · | Recognized
as a leader in Application Automation Services PEAK Matrix® Assessment 2023 by Everest |
| · | Recognized
as a leader in 5G Engineering Services PEAK Matrix® Assessment 2023 by Everest |
| · | Recognized
as a leader in Wealth and Asset Management PEAK Matrix® Assessment 2023 by Everest |
| · | Rated
as a leader in Adobe Experience Cloud Services NEAT 2023 by NelsonHall |
| · | Rated
as a leader in SAP Cloud Migration Services NEAT 2023 by NelsonHall |
| · | Rated
as a leader in Quality Engineering NEAT 2023 by NelsonHall |
| · | Positioned
as a leader in HFS Horizons: ServiceNow Services, 2023 |
| · | Positioned
as a leader in HFS Horizons: Data modernization services, 2023 |
| · | Positioned
as a leader in IDC MarketScape: Worldwide Retail Commerce Platform Service Providers 2023 Vendor Assessment |
| · | Positioned
as a leader in IDC MarketScape Worldwide Artificial Intelligence Services 2023 Vendor Assessment |
| · | Positioned
as a leader in IDC MarketScape: Asia/Pacific Oracle Application Implementation Services 2023 Vendor Assessment |
| · | Infosys
recognized as a leader in Digital Engineering Services 2023 ISG Provider Lens™ study in US and Europe |
| · | Infosys
recognized as a leader in Microsoft Cloud Ecosystem 2023 ISG Provider Lens™ study in US, UK, Singapore and Malaysia, Australia and
Germany |
| · | Infosys
rated as a leader in SAP Ecosystem ISG Provider Lens™ study in US, UK, Nordics, Germany and Brazil |
| · | Infosys
recognized as #1 Top IT Service Providers in the Nordics in Whitelane Research and PA Consulting Sourcing Study 2023 |
| · | Infosys
rated as a leader in Avasant’s Multisourcing Service Integration 2022–2023 Radarview™ |
| · | Infosys
rated as a leader in Avasant’s Financial Services Digital Services 2023–2024 Radarview™ |
| · | Infosys
rated as a leader in Avasant’s Media and Entertainment Digital Services 2023–2024 Radarview™ |
About
Infosys
Infosys
is a global leader in next-generation digital services and consulting. Over 300,000 of our
people work to amplify human potential and create the next opportunity for people, businesses
and communities. We enable clients in more than 56 countries to navigate their digital transformation.
With over four decades of experience in managing the systems and workings of global enterprises,
we expertly steer clients, as they navigate their digital transformation powered by the cloud.
We enable them with an AI-powered core, empower the business with agile digital at scale
and drive continuous improvement with always-on learning through the transfer of digital
skills, expertise, and ideas from our innovation ecosystem. We are deeply committed to being
a well-governed, environmentally sustainable organization where diverse talent thrives in
an inclusive workplace.
Visit
www.infosys.com to see how Infosys (NSE, BSE, NYSE: INFY) can help your enterprise navigate your next. |
|
Safe
Harbor
Certain
statements in this release concerning our future growth prospects, or our future financial or operating performance are forward-looking
statements intended to qualify for the 'safe harbor' under the Private Securities Litigation Reform Act of 1995, which involve a number
of risks and uncertainties that could cause actual results or outcomes to differ materially from those in such forward-looking statements.
The risks and uncertainties relating to these statements include, but are not limited to, risks and uncertainties regarding the execution
of our business strategy, our ability to attract and retain personnel, our transition to hybrid work model, economic uncertainties, technological
innovations such as Generative AI, the complex and evolving regulatory landscape including immigration regulation changes, our ESG vision,
our capital allocation policy and expectations concerning our market position, future operations, margins, profitability, liquidity,
capital resources, and our corporate actions including acquisitions. Important factors that may cause actual results or outcomes to differ
from those implied by the forward-looking statements are discussed in more detail in our US Securities and Exchange Commission filings
including our Annual Report on Form 20-F for the fiscal year ended March 31, 2023. These filings are available at www.sec.gov. Infosys
may, from time to time, make additional written and oral forward-looking statements, including statements contained in the Company's
filings with the Securities and Exchange Commission and our reports to shareholders. The Company does not undertake to update any forward-looking
statements that may be made from time to time by or on behalf of the Company unless it is required by law.
Contact
| Investor
Relations |
Sandeep
Mahindroo
+91
80 3980 1018
Sandeep_Mahindroo@infosys.com |
|
| Media
Relations |
Rishi
Basu
+91
80 4156 3998
Rajarshi.Basu@infosys.com |
Harini
Babu
+1
469 996 3516
Harini_Babu@infosys.com |
Infosys
Limited and subsidiaries
Extracted
from the Condensed Consolidated Balance Sheet under IFRS as at:
(In crore)
|
June 30, 2023 |
March 31, 2023 |
| ASSETS |
|
|
| Current assets |
|
|
| Cash and cash equivalents |
12,310 |
12,173 |
| Earmarked bank balance for dividend(3) |
7,262 |
- |
| Current investments |
5,536 |
6,909 |
| Trade receivables |
26,183 |
25,424 |
| Unbilled revenue |
14,628 |
15,289 |
| Other Current assets |
11,555 |
11,086 |
| Total current assets |
77,474 |
70,881 |
| Non-current assets |
|
|
| Property, plant and equipment and Right-of-use assets |
20,487 |
20,675 |
| Goodwill and other Intangible assets |
8,876 |
8,997 |
| Non-current investments |
11,991 |
12,569 |
| Unbilled revenue |
1,379 |
1,449 |
| Other non-current assets |
11,115 |
11,245 |
| Total non-current assets |
53,848 |
54,935 |
| Total assets |
131,322 |
125,816 |
| LIABILITIES AND EQUITY |
|
|
| Current liabilities |
|
|
| Trade payables |
3,759 |
3,865 |
| Unearned revenue |
7,330 |
7,163 |
| Employee benefit obligations |
2,543 |
2,399 |
| Other current liabilities and provisions |
32,863 |
25,759 |
| Total current liabilities |
46,495 |
39,186 |
| Non-current liabilities |
|
|
| Lease liabilities |
6,659 |
7,057 |
| Other non-current liabilities |
3,340 |
3,778 |
| Total non-current liabilities |
9,999 |
10,835 |
| Total liabilities |
56,494 |
50,021 |
| Total equity attributable to equity holders of the company |
74,443 |
75,407 |
| Non-controlling interests |
385 |
388 |
| Total equity |
74,828 |
75,795 |
| Total liabilities and equity |
131,322 |
125,816 |
Extracted
from the Condensed Consolidated statement of Comprehensive Income under IFRS for:
(In crore except per equity share data)
|
3 months ended June 30, 2023 |
3 months ended June 30, 2022 |
| Revenues |
37,933 |
34,470 |
| Cost of sales |
26,382 |
24,369 |
| Gross profit |
11,551 |
10,101 |
| Operating expenses: |
|
|
| Selling and marketing expenses |
1,783 |
1,493 |
| Administrative expenses |
1,877 |
1,694 |
| Total operating expenses |
3,660 |
3,187 |
| Operating profit |
7,891 |
6,914 |
| Other
income, net (4) |
471 |
620 |
| Profit before income taxes |
8,362 |
7,534 |
| Income tax expense |
2,417 |
2,172 |
| Net profit (before minority interest) |
5,945 |
5,362 |
| Net profit (after minority interest) |
5,945 |
5,360 |
| Basic EPS () |
14.37 |
12.78 |
| Diluted EPS () |
14.35 |
12.76 |
NOTES:
| 1. | | The
above information is extracted from the audited condensed consolidated Balance sheet and
Statement of Comprehensive Income for the quarter ended June 30, 2023, which have been taken
on record at the Board meeting held on July 20, 2023. |
| 2. | | A
Fact Sheet providing the operating metrics of the Company can be downloaded from www.infosys.com. |
| 3. | | Represents
bank balance earmarked for final dividend. Payment date for dividend was July 3, 2023 |
| 4. | | Other
income is net of Finance Cost. |
Exhibit 99.3
Press Conference
Infosys Limited
Q1 FY24 Media Conference Call
July 20, 2023
CORPORATE PARTICIPANTS:
Salil Parekh
Chief Executive Officer & Managing Director
Nilanjan Roy
Chief Financial Officer
Rishi Basu (Emcee)
Corporate Communications
JOURNALISTS
Ritu Singh
CNBC TV18
Haripriya Sureban
The Hindu BusinessLine
Shilpa Phadnis
The Times of India
Chandra Ranganathan
and Haripriya Suresh
Moneycontrol
Sai Ishwarbharath
The Economic Times
Ayushman Baruah
Business Standard
Uma Kannan
The New Indian Express
Sameer Ranjan Bakshi
Financial Express
Varun Vyas
Reuters
Shraddha Goled
Mint
Reshab Shaw
Informist
Rishi Basu
On behalf of
Infosys, I would like to welcome all of you. We request one question, or let us say, restricted number of questions from each media house
to accommodate everyone over the next hour. And with that, let me invite our Chief Executive Officer, Mr. Salil Parekh, for his opening
remarks. Over to you, Salil.
Salil Parekh
Thanks Rishi
and good evening, good afternoon, welcome to everyone that is here. It is always wonderful to have all of you here with us on the campus.
I am sure you have seen there are a lot more people on the campus as well, and we are also benefiting from that.
We have had
a very strong Q1. Our Q1 growth was solid at 4.2% year-on-year, 1% Q-on-Q in constant currency. We had 20% growth in manufacturing, 13%
in life sciences. Our European business grew by 10%. Our operating margin for the quarter was strong at 20.8%.
Our large deals
value for Q1 was at $2.3 bn - 56% of this was net new. This included one mega deal win. We also announced a mega deal with a value of
$2 bn after the close of Q1, but before our results. With strong large deal and mega deal wins, we are building well for the future.
We are delighted
that Topaz, our Generative AI platform is resonating well with our clients. We are working on 80 Generative AI projects for our clients
at this time. The work we are doing, covers large language models for software development, for text, document, voice, and video.
Internally,
we have developed Generative AI tools based on open-source model of Generative AI platforms that are focused on software development.
We have trained 40,000 employees in this area, and we see Generative AI and Topaz being transformational for all of our clients.
In the short
term, we see some clients stopping or slowing down transformation programs and discretionary work. This is especially so in financial
services, in mortgages, asset management, investment banking, payments, and in telecom. We also see some impact in hi-tech industry and
in parts of retail.
Even as we
have won two mega deals recently, we have a strong pipeline of large and mega deals. We see revenue from some of these and other large
deals towards the later part of our financial year. Keeping that in mind, we are changing our revenue growth guidance for this financial
year to growth of between 1% to 3.5% in constant currency.
We have launched
a broad comprehensive margin expansion program. The program will work across five areas: pyramid efficiency, automation, improvements
in critical portfolios, reducing indirect costs, and communicating and deriving value across our portfolio.
We have an
ambition to improve our operating margins in the future periods. Our operating margin guidance for this financial year remains unchanged
at between 20% and 22%.
With that,
let us open it up for questions. Rishi.
Rishi Basu
Thank you,
Salil. We will now open the floor for questions. Joining Salil is Mr. Nilanjan Roy, Chief Financial Officer, Infosys. With that, we have
the first question from Ritu Singh from CNBC TV18.
Ritu Singh
Hi.. The first
question, of course, is on your guidance cut. It was a steady quarter for Infosys, whether it is the constant currency growth, the mega
deals that you have announced, couple in the quarter and after the quarter close. And your TCV is also higher than the previous quarter.
What has so drastically changed in the last three months for you to cut your guidance from 4% - 7% to 1% - 3.5%, and given that top-line
you are expecting lower now for the year, how are you confident of maintaining margins at 20% to 22% for the year? That is the first question.
And also, you
know, your commentary from clients in terms of when you see, revival in your discretionary spends from whether it is BFSI, retail, hitech
all these areas of concern that you have outlined. And your net employee reductions for the last couple of quarters, that has also been
coming down. So, we wanted to understand what your hiring plans are? We understand you have already deferred pay hikes for some of the
employees, if you could give us a sense on that? Thank you.
Salil Parekh
On the first
point, on the revenue growth guidance, we have, as you rightly pointed out, had a good Q1. We have had good large and mega deals. We
have also seen some of these deals, the signings and the start dates being delayed. With that, we see a lot of that revenue from that
sort of large and mega deals towards the later part of the financial year. And through the quarter, we have seen volumes in some of our
clients, in the industries that I shared, were impacted where they were reducing transformational projects or slowing down decision making.
So, when we combined those two and we looked out for the full year, we saw that sort of a range in terms of the growth guidance and decided
that we should change our growth guidance.
Rishi Basu
Thank you.
We will try to come back to you.
Ritu Singh
That did not
answer my question.
Salil Parekh
On the margin,
we have an extremely strong discipline for our operating margin. We have put in place this expanded margin program that I was referring
to. There are five elements of that program, each of them being driven to make sure we have efficiency. You have also seen utilization
in Q1 go up, and we will continue to see that with all the focus we are putting into productivity. We are also looking at reducing, within
those five elements, indirect spends, and cuts of that nature. So, we feel comfortable with our operating margin guidance. And our operating
margin for Q1 at 20.8% was more towards the middle part of that range.
Ritu Singh
We have seen
a reduction in the headcount for the last couple of quarters, keeping that in mind, what are your hiring plans for the year?
Salil Parekh
So, we still
have a target for recruiting for the year, but we will see how that plays out with respect to, what are the changes in terms of the demand
environment and what we do in terms of the attrition numbers that we are seeing. The attrition that we saw in the quarter was stable versus
last quarter. Our trailing last 12-month attrition is down to around 17%. So, we see that driving some of the decisions on the recruitments.
Ritu Singh
What did you
say, your target for hiring for the year was?
Salil Parekh
We have not
given that target. We said, we will look at that based on what that demand environment looks like and how we see the rest of the year
playing out.
Rishi Basu
Thanks, Ritu.
The next question is from Haripriya Sureban from The Hindu Business Line.
Haripriya
Sureban
What is it
just for the transformational deals that you are seeing? Or has it translated to the cost takeout kind of - regular kind of deals as well?
And given that AI, you have mentioned, you have many active projects, do you think that will sort of help you with margins as well, given
that it is coming at a higher price point?
Salil Parekh
So, on the
first, the decision making we see has slowed down across large programs. The way a lot of the transformation programs that are running
today, they are funded from cost efficiency that comes through that program itself. So overall, the decision making sometimes is slowing
down. And we are seeing the start dates in terms of where some of these programs are likely to start, more towards the back end of the
year. And that is the reason we are seeing the revenue impact through the year.
On Generative
AI, we are excited to be doing 80 projects. AI programs generally have a good margin. They have a lot of work which is focused on enhancing
productivity, driving new areas of growth. But at this stage, it is a start. So, we will see when that scales up what the impact of margin
is.
Rishi Basu
Thank you.
The next question is from Shilpa Phadnis from The Times of India.
Shilpa Phadnis
Hello Sir.
If you just look at your sequential revenue growth of 1%,
On an annualized
basis, you could have grown at 4% and your guidance is sub-par. So, I just wanted to understand from you, are there deep client concerns
that has, you know, made Infosys scale down the guidance significantly?
Salil Parekh
So, the discussion
on the guidance is sort of similar. We have seen many of these large and mega deal wins really give us much more confidence in the way
clients are working with us, especially on cost efficiency, even with financial services, when we announce on transformation and also
consolidation. However, there have been delays in the start of some of these programs and the decision-making in those.
Coupled with
that, we have also seen some of the volume during the quarter coming down because of clients in the industries that I mentioned, so financial
services, asset management, payments, mortgages, telco, etc., in those specific industries, reducing their volume of work. And those two
things have combined for reducing the guidance.
Shilpa Phadnis
I had one more
question on your deal win. You spoke about the $2 bn deal win. Would that qualify as Infosys' biggest win that could potentially surpass
Daimler?
Salil Parekh
So first, we
are now sharing the deal value making sure that that is aligned to the regulations that are there. For the past, we have actually never
shared the deal value. So, it will be difficult to compare that.
Shilpa Phadnis
And one last
thing on the headcount, Sir. The sector itself is going through a lot of people challenges, you know, deferments of hikes and increments.
So, if you can please clarify, what is the kind of hikes that you plan to roll out this year? Is it going to be deferred at all levels?
We are getting to hear that senior level hikes are getting deferred. Can you please throw some light on that?
Nilanjan
Roy
Yes. So
actually, on the compensations, we are actively under consideration as we speak. So, I am sure, you will hear of it even before we finalize
that, but it is under active consideration.
Rishi
Basu
Thank you.
The next question is from Chandra Ranganathan and Haripriya Suresh from Moneycontrol.com.
Chandra
Ranganathan
Hi. Salil,
you know, on the guidance, again, I wanted to understand what has changed in one quarter, 4%-7% to, you know, 1%-3.5%, any specific ramp-downs
that you are seeing, what exactly is happening? And when we spoke to other managements, they say that, even though transformative programs,
discretionary has slowed down, clients are still going in for short-term ROI projects. So, you know, is that something that you are looking
at in the pipeline?
Secondly,
Nilanjan, on the hikes, you said it is under consideration, by when do you expect to announce?
Haripriya
Suresh
Hi, also wanted
to get some perspective on your, you have seen some top level exits recently as well. Is that a matter of concern? And what are you doing
to sort of stem top level attrition? Just wanted to understand that.
Salil Parekh
So, the first
question on the guidance, I think the way we have seen it is, what we saw in the start of the quarter, we had a certain view of where
our large and mega deals were in terms of, when they would close and when some of that work would start. Plus, what was the volume on
the other programs, on the transformation programs, on the digital programs, on our overall volume of work across the portfolio.
What we
saw is some of the start dates for the large deals, the mega deals were more later in the year. And the decision making, even as we have
announced two of them, we still have some in our pipeline and we will see those over the course of the year as the pipeline evolves, and
the volume which we saw the changes in for many discretionary projects or some of the transformation work.
Combining
all of that is where we decided that this was the guidance in terms of the growth that we could see today in terms of the outlook. What
we do see is, as we look towards the back end of the year, much more growth orientation, because some of these deals will at that stage
start to deliver their revenue as well.
Chandra
Ranganathan
Short term,
are you seeing more, the nature of the deals becoming more short term, ROI, cost takeout?
Salil Parekh
Yes, so
we are definitely seeing consolidation, cost efficiency, automation, but we are not seeing short term, meaning short projects like that.
But those are the types of deals we are seeing which is more focused on the efficiency as opposed to transformation.
On
the compensation, Nilanjan will come, I will just go with the third one first. We have seen, we have announced and rolled out our
new leadership structure within the company. We have the great fortune of having incredible leadership talent within the company. And
each of them, several of them are stepping up into new roles, driving the growth of this business.
As you can
see from these two mega deals and other large deals, overall strength of the business, those people have stepped in, and my sense is Infosys
will continue to produce those sort of leaders.
Nilanjan
Roy
Yes, so
I think, like I said, this is under consideration, so we will come back on the timing etc., but as of now, we are looking at it. We are
looking at it as we speak.
Rishi
Basu
Thank you.
The next question is from Sai Ishwar from the Economic Times.
Sai Ishwarbharath
Hello, gentlemen.
So, Salil, you were talking about the fall in volumes across the portfolio, right? So, what exactly is the reason for this fall in volume?
Are clients fearing the recession and tightening their spends. And I just wanted to ask about the $100 mn-plus clients, it is falling
by 2 sequentially. So, is that because of the ramp-down or is it because of projects getting completed? Thank you.
Salil Parekh
On the first
one, the volumes, there mainly, it is clients in the industries that I was referencing, trying to maintain their cost discipline to reduce
what they consider discretionary in the short term. So, we see many of these sorts of actions, for example, in mortgages and financial
services, or we see that in telecom, or we see that in investment banking, or we see that in hitech. Those are the sorts of projects that
typically have got less attention in Q1.
Sai Ishwarbharath
So, have you
priced in, like you said a lot of these start dates are baked in the second half of the year, right? So, the guidance now has baked in
all the expected revenues, or do we see any improvement in guidance?
Salil Parekh
What we have
announced as our wins on large deals and mega deals that is already in the guidance we have given. As we go through the year, as there
are more events in terms of wins, we will see what impact that has. There could be impacts which are positive there could be impacts,
depending on some of things, gets delayed or not. But as of what we see today is what we have put into the guidance.
Nilanjan
Roy
On those two,
I mean, I cannot specifically comment on those two specific clients. But generally, as Salil said, the overall impact had a discretionary
spend cut rather than any projects fundamentally getting over, that is the general theme.
Sai Ishwarbharath
So, they shifted
one bucket lower?
Nilanjan
Roy
Yes, they shifted.
So, if you see above 50, that is not changed.
Rishi
Basu
Thank you,
Sai. The next question is from Ayushman Baruah from the Business Standard.
Ayushman
Baruah
Hi. A lot has
been spoken about AI, so keen to know, what percentage of deals are AI led? Do you see a component of AI in majority of the deals? Is
AI integrated in most of the deal conversations that you have? That is first.
And secondly,
on the pricing, are you seeing any pricing pressure as such? Thank you.
Salil Parekh
On pricing,
Nilanjan will come back on that. On AI, first, we do not disclose the percentage of AI within our portfolio. However, AI or Generative
AI is really transformative, and it is something that is changing everything that is going on. For example, we are doing work, which is
related to software development, which is related to new code enhancements, migration, maintenance that covers the spectrum of the work
that we do. And it is also related to other areas, for example, voice, video, text. These are areas where we do work, which is expanding
the type of work we are doing. So, my sense is Generative AI is really going to transform everything that is happening within our portfolio.
And Topaz that we have launched, being the leading platform or set of capabilities for Generative AI, I think will make a huge impact.
Having 80 active projects is a massive step and it is moving with rapid speed.
Nilanjan
Roy
The pricing
environment remains quite stable. We have seen in some places, we are able to get some increases from cola, etc. Some cases isolated again,
you get some discounts, but by and large it is a very stable environment.
Rishi Basu
Thank you.
The next question is from Uma Kannan from The New Indian Express.
Uma Kannan
Good evening,
gentlemen. You said, there are some softeners in verticals like BFSI, hitech. So, will this continue, or will it be better going forward
in H2? And I also want to know, where are the headwinds coming from? And is it really paradoxical times for the IT industry as such?
Salil Parekh
So there, on
the first part, what we look at is, what we see within our portfolio on a daily, weekly, monthly basis. It is, from our perspective, not
something we look at as to when something will stop or not stop. We have within our portfolio, work that we can do on digital transformation,
cloud, Generative AI, which are really growth drivers in the market. When clients or industries are looking at that we are ready with
that, and we have that as one of our growth engines.
On the other
hand, when clients are looking at cost, efficiency, consolidation, we also have deep capability in that, and that is some of these wins
that you have seen, that we have announced, are reflective of that. So that is what will kick in, in the other side, but we do not have
a specific view on when something will change in that.
Rishi Basu
Thank you.
The next question is from Sameer Bakshi from the Financial Express.
Sameer Ranjan
Bakshi
Hello, Sir.
So, in these times, do you see challenges in winning smaller deals, when there is a cut in discretionary spend? And the second one is,
when your peers are focusing on Europe, why are you not able to consolidate the European market? Your revenue has fallen by 2%. Thank
you.
Salil Parekh
In Europe,I
will come to that, on a constant currency basis, we are at a growth of 10%. So, Europe, in fact, you are absolutely right, is an area,
we have a lot of attention and focus on. And in many of those markets, we are expanding quite well.
On the smaller
projects, we do not see a difference. We are comfortable to win larger programs and smaller programs. It is just that there are some,
which are more, not smaller but more discretionary from the perspective of a client, which is where we see some of the volume impact.
On the larger mega deals, actually we are seeing very good traction in the two wins but also a good pipeline of large and mega deals.
Rishi Basu
Thank you.
The next question is from Varun Vyas from Reuters News.
Varun Vyas
Hello. I was
wondering if you could tell me, if the results missed the company's own expectations and when you might see some recovery? And could you
explain how you classify large and mega deals? Like, is there a certain threshold above which a deal is considered that?
Salil Parekh
So, the way
we see this, we find that when we look at things like Generative AI or if you look at the mega deals or the large deals, we see very good
traction and momentum. When we see volumes on discretionary projects, we see some of those slowing down. So, in that sense it is not one
size that fits all, we are seeing really good traction on the former. In terms of classification, it is $50 mn or larger that is classified
within our system as large deal, and $500 mn or larger is a mega deal.
Varun
Vyas
I was wondering,
if you could also tell me what kind of variable pay you are paying.
Salil
Parekh
So, we do
not comment on that externally.
Rishi
Basu
Thanks,
Varun. The next question is from Shraddha Goled from the Mint.
Shraddha
Goled
Hi, good
evening. I wanted to ask about the Generative AI training that you mentioned. About 40,000 employees are being trained. So, what kind
of training are they undergoing, more details on that? And also wanted to know, if any Generative AI apps or tools are being used internally
for any of the operations or functions?
Salil
Parekh
So, on the
training, we are working with clients on both open-source Generative AI platforms and proprietary Generative AI platforms. These span
from different tech companies. Our training internally is on many of these different platforms. Plus, we have built some tools on an open-source
Generative AI platform that we are using internally for areas where we do software development. For example, in our products business,
in some other areas of services, where we are doing new code development, enhancements or migration.
So for all
of those we have built some tools on open-source platforms. So, the training is on those elements of those platforms. We have in fact,
rolled out what we call ‘AI assistance’ for our employees where the employees are focused on delivery work, which is in the
software development area, on the sales work, on training, on knowledge management, on different components of the work. So, for us, really,
we are becoming an AI-first company, driving through the change internally as well as externally.
Shraddha
Goled
Are you
also using for your internal operations?
Salil
Parekh
Yes, absolutely.
So those are the ones which we are using internally as well.
Rishi
Basu
Thanks, Shraddha.
The next question is from Reshab Shaw from The Informist.
Reshab
Shaw
Hi, gentlemen.
We have seen utilization going up by 2 basis points and attrition coming down. What stopped us from reaching the upper end of the margin
guidance?
Nilanjan
Roy
Yes. So,
I think guidance of 20% to 22%, I mean, we ended the year as you know at 21% for the full year and for the quarter. So, at 20.8%, it is
about a 20-basis points reduction. We know, we have levers available, like utilization is definitely, one of them. And the program which
we have put into place has actually got five pillars.
The first is
automation through Generative AI. The second is a much more beneficial hierarchy index. The third is through more critical portfolio of
projects. Fourth is value-based selling, the pricing, and the fifth is a whole indirect cost initiative. So, this is a five-pillar holistic
approach we are taking. It has got about 20 tracks and it is being led by Jayesh.
So, we have
30 leaders leading all these tracks. And definitely the aspiration is to continue to grow our margins in the medium term and long term.
Rishi
Basu
Thank you.
With that, we come to an end of this Q&A session. We thank our friends from media for being here today. Thank you Salil. Thank you
Nilanjan.
Before we
conclude, please note that the archived webcast of this press conference will be available on the Infosys website and on our YouTube channel
later today. We request our friends from media to join us for high tea outside. Thank you once again. Have a lovely evening.
Exhibit 99.4
Fact
Sheet
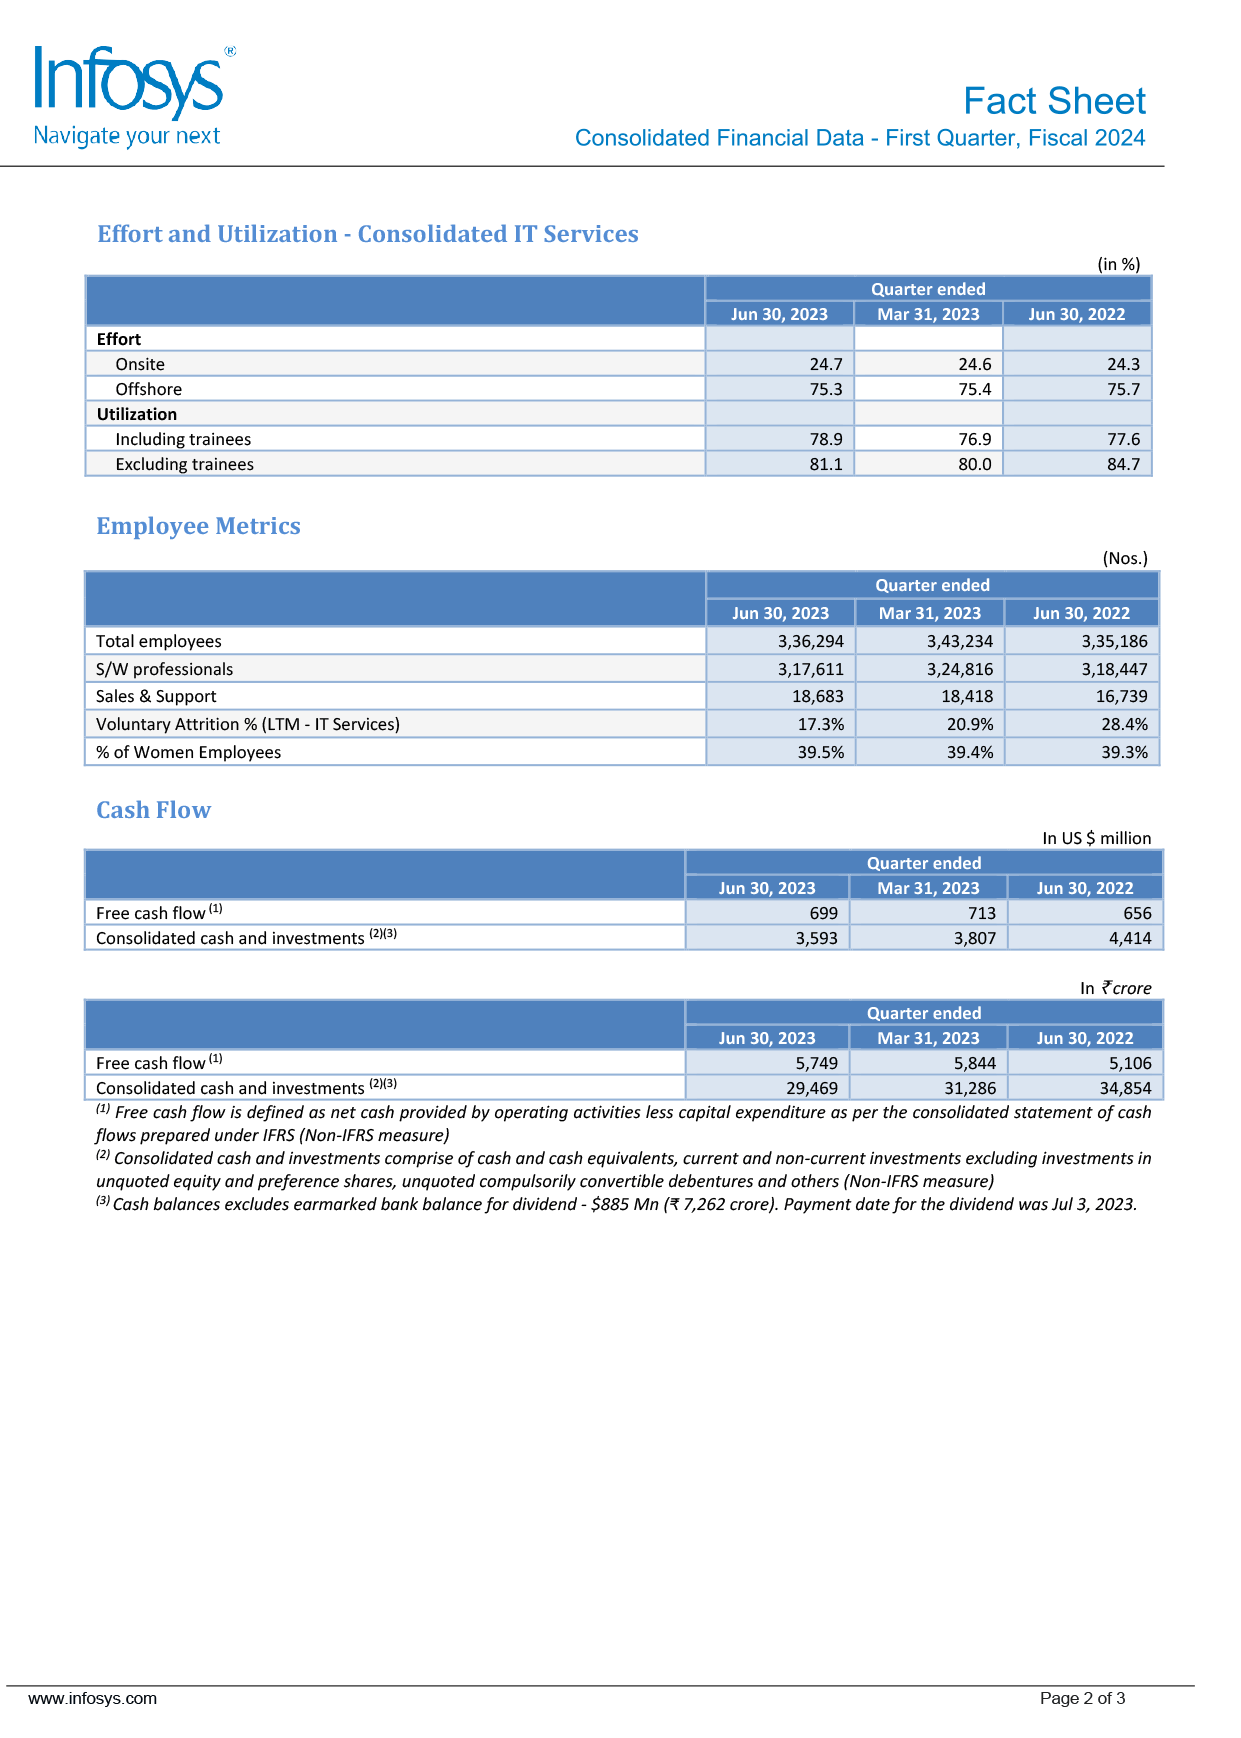
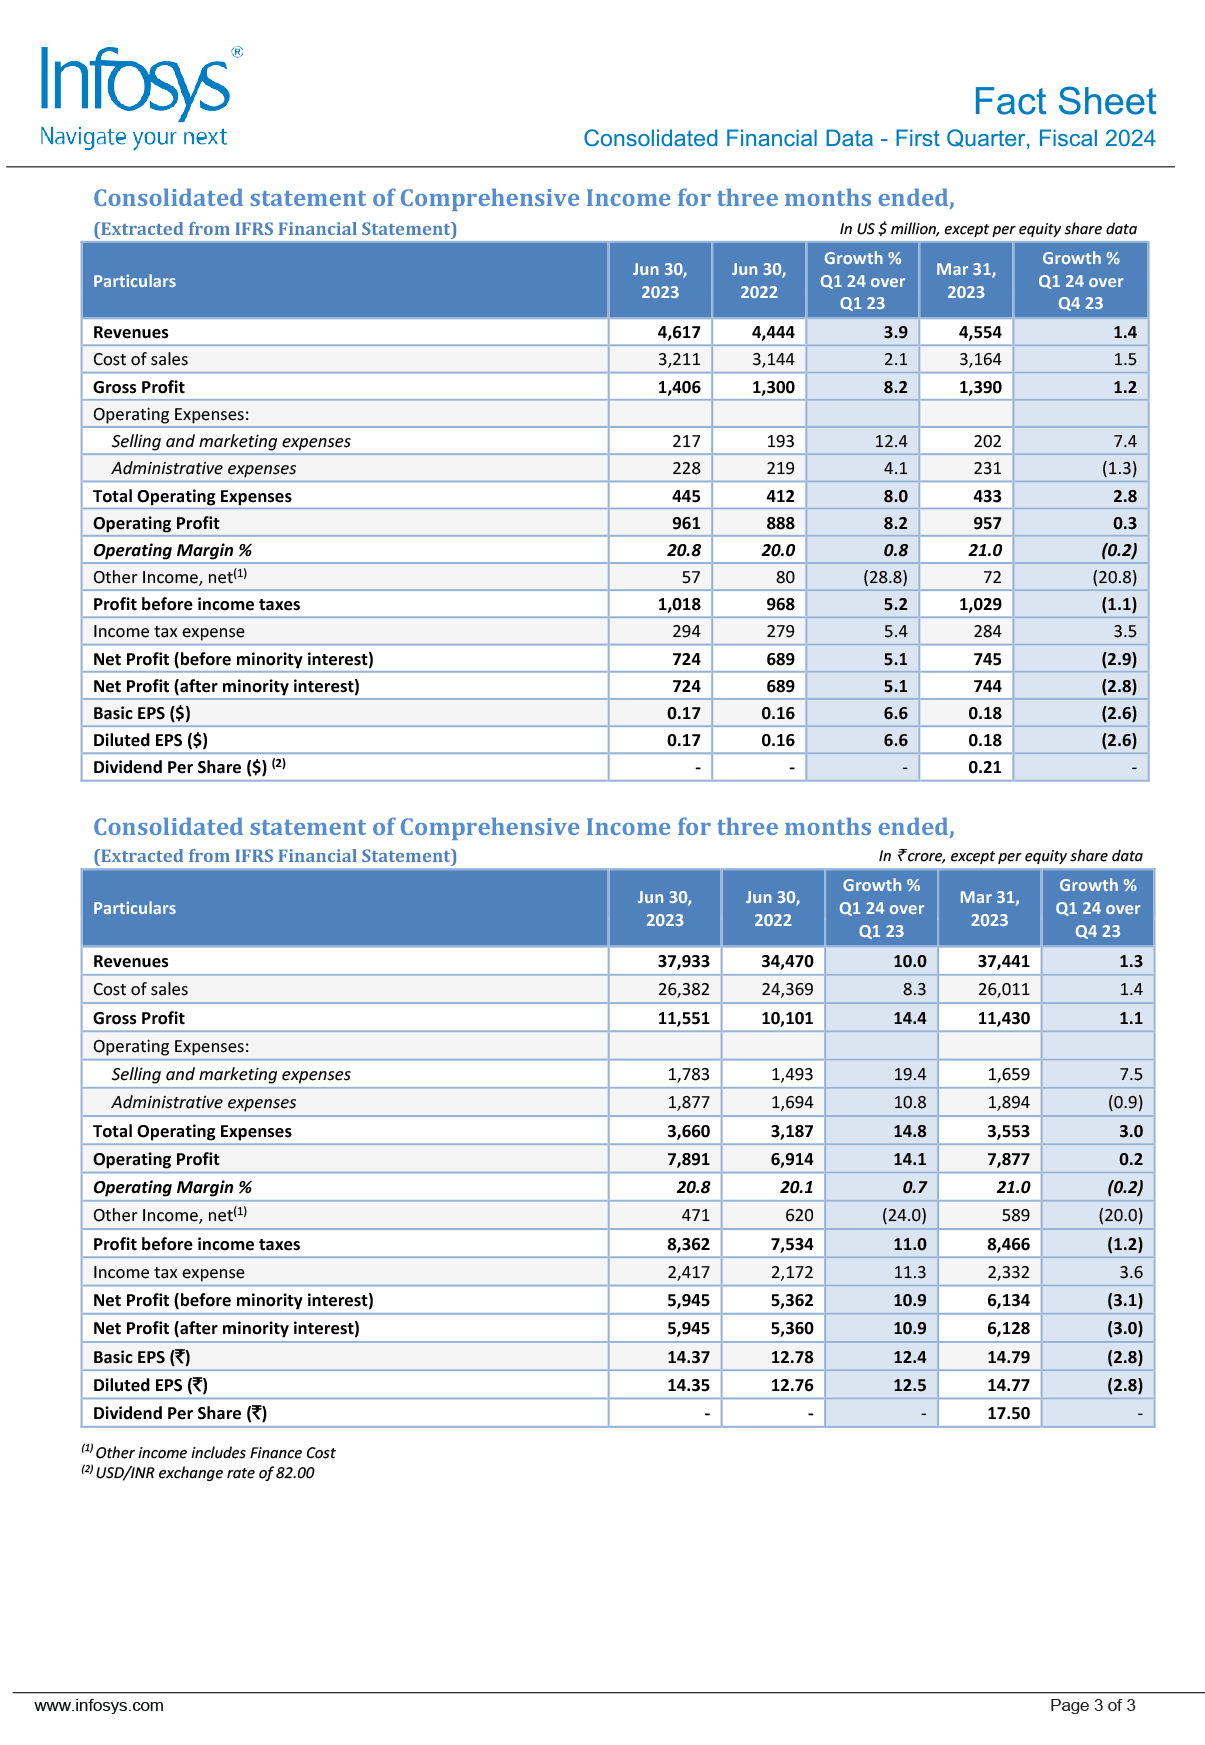
Exhibit 99.5
Earnings Call
"Infosys
Limited
Earnings
Conference Call"
July 20,
2023
CORPORATE PARTICIPANTS:
Salil Parekh
Chief Executive Officer and
Managing Director
Nilanjan Roy
Chief Financial
Officer
Sandeep
Mahindroo
VP, Financial Controller & Head of Investor Relations
journalists
Kawaljeet
Saluja
Kotak
Yogesh
Aggarwal
HSBC
Ankur Rudra
J.P. Morgan
Apurva Prasad
HDFC Securities
Kumar Rakesh
BNP Paribas
James
Friedman
Susquehanna
Abhishek
Bhandari
Nomura
Moshe Katri
Wedbush Securities
Mukul Garg
Motilal Oswal
Financial
Services
Surendra Goyal
Citigroup
Prashant Kothari
Pictet
Bryan Bergin
TD Cowen
Nitin Padmanabhan
Investec
Vibhor Singhal
Nuvama Equities
Moderator
Ladies and
gentlemen good day and welcome to the Infosys Earnings Conference Call. As a reminder, all participant lines
will be in the listen-only
mode and there will be an opportunity for you to ask questions after the presentation concludes. Should you
need assistance during the
conference call, please signal an operator by pressing star then zero on your touchtone phone. Please note
that this conference is being
recorded.
I now hand
the conference over to Mr. Sandeep Mahindroo. Thank you, and over to you, sir.
Sandeep
Mahindroo
Hello, everyone,
and welcome to Infosys earnings call for Q1 FY '24. Joining us here on this call is CEO and MD, Mr. Salil
Parekh, CFO, Mr. Nilanjan Roy
and other members of the senior management team. We will start the call with some remarks on the performance
of the company for the quarter
by Salil and Nilanjan, subsequent to which the call will be opened up for questions.
Kindly, note
that anything which we say that refers to our outlook for the future is a forward-looking statement which must
be read in conjunction
with the risk that the company faces. A full statement explanation of these risks is available in our filings
with the SEC, which can
be found on www.sec.gov.
I would now
like to pass it on to Salil.
Salil
Parekh
Thanks Sandeep.
Good evening, and good morning to everyone on the call. Thank you for joining us.
We had a strong
quarter in Q1. Our Q1 growth was solid at 4.2% year-on-year and 1.0% quarter-on-quarter in constant currency.
We had 21% growth in manufacturing,
14% in Life Sciences. Our Europe region grew by 10%. Our operating margin for the quarter was strong at 20.8%.
We generated robust free
cash flow of $699 mn in Q1.
Our large deal
value for Q1 was $2.3 bn, 56% of this was net new. We had one mega deal win in Q1. Our value of deals of
financial services was 50% of
the overall large deal value in Q1. We announced a mega deal of $2 bn value after the close of Q1 and before
our results, before today.
With a strong large deal and mega deal wins, we are building well for the future. Our pipeline of large deals
is strong and we continue
to have megadeals in our pipeline.
We are delighted
that Topaz, our AI and generative AI platform is resonating well with our clients. We are working on 80
generative AI projects for our
clients at this time. The work we are doing encompasses large language models for software development, text,
document, voice and video.
Internally,
we have developed generative AI tools using an open-source model for software development. We are working with
open-source and proprietary
generative AI platforms and modules. We have trained 40,000 employees on generative AI. We see opportunities
for new work and for productivity
improvements through this technology. All of these elements are available within our Topaz set of
capabilities. We see this area of generative
AI and Topaz being really transformative for our clients.
As we look
ahead with the large and mega deal successes and our strength in cost efficiency, automation and
consolidation, we feel confident. In
the short term, we see some clients stopping or slowing down work on transformation programs and discretionary
work. This is especially
so in financial services, in mortgages, asset management, investment banking and payments and in the telecom
industry. We also see some
impact in the hitech industry and in parts of retail.
Even as we
won two mega deals recently and have a strong pipeline of large and mega deals, we will see revenue from some
of these and other large
deals towards the later part of our financial year. Keeping that in mind, we are changing our revenue growth
guidance for this financial
year to growth of 1.0% to 3.5% in constant currency.
As a consequence
of our mega deal wins, overall traction in cost efficiency, automation, a differentiated digital cloud and
generative AI capabilities,
we are well positioned for the medium term and especially towards the end of our financial year and the period
after that.
We have launched
a broader and comprehensive margin expansion program. The program will work across five areas: pyramid
efficiency, automation and generative
AI, improvements in critical portfolios, reducing our indirect costs and communicating and deriving value
across the portfolio.
Our senior
leadership is mobilized on this. We're working on this program with our clients, our employees and partners,
and we're taking steps for
the short, medium and long term, while keeping the overall strategic direction of the company in mind. We have
an ambition to improve
our operating margin in the future periods. Our operating margin guidance for the financial year remains
unchanged at 20% to 22%.
With that,
let me hand it over to Nilanjan.
Nilanjan
Roy
Thanks, Salil.
Good evening, everyone, and thank you for joining the call.
We entered
FY '24 on the backdrop of uncertain macroeconomic environment with clients reassessing the IT spend and
continue to focus on cost and
efficiency programs.
Q1 revenue
growth was 4.2% on a Y-on-Y basis in constant currency. Sequentially, revenue grew by 1% in constant currency
and 1.4% in dollar terms.
Operating margin
for Q1 was 20.8%, 20 basis points lower sequentially. This was primarily due to a 70 basis points of benefit
from cost optimization, including
utilization and automation, which was offset by a balanced 90 basis point impact from employee-related costs,
including higher variable
pay, promotions, etc.
Client metrics
remained strong with the number of $50 mn clients increasing to 79 and $200 mn clients at 15, reflecting our
strong ability to mine top
clients by providing them multiple relevant services.
Headcount at
the end of the quarter stood at 336,000 employees, which is a decline of 2% from the previous quarter. A
substantial portion of attrition
has been backfilled by training and reskilling existing pool of talent and deployment of freshers.
Consequently, our utilization excluding
trainees improved to 81.1%, which has further headroom for growth. We will calibrate the hiring for FY '24
based on available pool of
employees, growth expectations and attrition trends.
Free cash flow
for the quarter was robust at $699 mn and the conversion to net profit for Q1 remained strong at 96.6%, led by
strong collections. DSO
increased by one day sequentially to 63. Consolidated cash and equivalents stood at $4.5 bn at the end of the
quarter. This is before
the payout of final dividend that happened in the first week of July.
EPS grew by
6.6% in dollar terms and 12.4% in rupee terms.
Yield on cash
balance was 6.71% in Q1.
ROE increased
to 32.8% in Q1, a 1.8% increase year-on-year, which is a reflection of our strong cash generation and capital
allocation policy.
Large deal
momentum continued and we signed 16 large deals in Q1; TCV was $2.3 bn with 56% net new. 3 deals reach were in
FS, EURS and communication;
4 in retail; 2 in manufacturing and 1 in Life Sciences vertical. Region wise this split by 11 in America, 4 in
Europe and 1 in ROW.
Coming to vertical
segment performance.
Financial services
vertical witnessed continued softness in areas like mortgage, asset management, investment banking, cards and
payments. Large and super
regional banking clients in US have been resilient during this quarter. Large banking clients are focusing on
vendor consolidation, cost
takeout and self-funding transformation programs. Many financial institutions are looking at outsourcing the
non-core business that includes
taking away existing employees across technology and operations. While delayed decision-making is impacting
the vertical, our recent deal
wins and the strong pipeline will help create momentum and opportunity for future growth.
In retail,
cost efficiency and consolidation continues to remain top priority for our clients. There is intense focus on
leveraging AI to accelerate
digital transformation for enhanced customer and employee experience, predictive analytics and real-time
insights. While decision cycles
are long, large deal pipelines remain healthy in infra, apps and process modernization, cloud and workload
migration.
Communication
sector is witnessing continued impact from budget cuts, delayed decision making for newer spend and slow
ramp-up. Growth challenges for
the clients persist due to increasing opex pressures. Cost optimization and vendor consolidation are top
priority for clients who are
open to innovative solutions and are asking for AI to amplify productivity. OEM clients are showing greater
interest in revenue-generating
services, decreased time to market, increased product quality and improved customer experience. Large deal
pipeline in this vertical remains
very healthy.
Outlook for
the energy, utilities, resources and services vertical continues to be positive, though there slowdown in
decision-making. Energy clients
are coming to us for large-scale transformation programs such as digital capabilities for energy transition
and journey to net zero. Utilities
clients are focused on in-flight transformation programs or those required for regulatory compliance. Service
clients are focused on consolidation
and M&A, cloud cost optimization and legacy transformation. Our investment in industry cloud and solutions
in the energy transition
area had helped us differentiate in these sectors to win multiple deals and build a very strong pipeline.
Manufacturing
clients are focusing on controlling the spend and awarding deals which are focused on differentiation. Despite
the volatile environment,
deal pipeline is strong. Areas like, engineering, IoT, supply chain, cloud, ERP and digital are seeing
increased traction. There is a
need to increase paper migration to cloud, increasing productivity by transforming to smart factories and
transitioning to smart products.
We are seeing opportunities across auto, aerospace and industrial.
We have revised
our revenue growth guidance for FY '24 to 1.0% to 3.5% in constant currency terms. This is due to
lower-than-expected volumes, due to
ramp-down in discretionary spend, coupled with lower mega deal volumes arising from delayed timing and longer
ramp-up times due to regulatory
approvals and transition.
Margin guidance
remained at 20% to 22% for FY '24. We continue to aspire for higher margins over the medium term with the
razor-sharp focus on cost optimization
and efficiency improvements. As Salil mentioned, we have launched a new margin maximization program across the
five pillars comprising
over 20 tracks.
With that, we can
open up the call for questions.
Moderator
Thank you very
much. We will now begin the question-and-answer-session. The first question is from the line of Kawaljeet
Saluja from Kotak. Please go
ahead.
Kawaljeet
Saluja
Yeah, hi. Thank
you. You know, my first question is the fact that in the prepared remarks, both Nilanjan and Salil, both of
you mentioned that the guidance
cut is partly due to a delay in volumes or the delay in timing of mega deals. But as far as I remember, your
guidance at the lower end
was not predicated on mega deal closures, which is 4%, and 7% was predicated on mega deal closures and volumes
flowing through.
So I'm just
trying to understand, if you can just delayer your guidance, you know basically just highlight what percentage
of the cut is attributable
to your perception of change in view in the external environment and what percentage is really the delayed
signing of mega deals here?
Nilanjan
Roy
Yes. So Kawal
as you know, there was a guidance of 4% to 7%. Of course, the higher end of the guidance had a larger amount
of the mega deals. And the
4%, of course, was predicated a lot on the base volumes, which by default would be in quarter 1, quarter 2.
And this is where we have
seen discretionary spend cuts in quarter 1 in some clients, and of course, in Q2 as well, some of that
softness continues.
As you know,
if you have to meet the year, quarter 1 and quarter 2 are very critical for that really to happen. So
fundamentally, that is the base
reason. As we exit the year, of course, at the higher end, there was the impact of mega deals and our guidance
on both ends have come
down. And one more reason is that the top-end has come down is also largely also due to the delay in mega
deals signing and the transition
time. But the pipeline, as Salil said is very healthy. We got two deals under the belt, and we are as
confident as we exit the year.
Kawaljeet
Saluja
But Nilanjan,
just to try to know, when you basically spoke in the last quarter, you did highlight that 1Q would be weaker
and we expect pickup in 2Q,
whereas right now you are saying that 1Q and 2Q are strong quarters. I'm just trying to understand the
disconnect in commentary.
The second
part to the question Nilanjan is that, two consecutive quarters, two consecutive misses. I guess last time
around as well, there were
a lot of pushback saying that the environment has deteriorated and how you built any extra cushion into your
guidance, etc. So what are
your learnings in the last two quarters? And what are the steps you have taken to ensure that the forecasting
process is a little bit
more robust than what the guidance cut in the last two quarters indicate?
Nilanjan
Roy
Yeah. So Kawal
see, when we give the guidance, we see the outlook at that point of time. We have a semblance of what is a
pipe. We assume some convertibility.
There is an existing book of business. But like I just said, in Q1, from a sequential basis, we are lower than
where we thought we would
end up to be, right?
Because like
I said, Q1 and Q2 was critical for us to meet that guidance. And we have seen these discretionary cuts in
clients in some sectors which
we have just called out. And that is, what I would say, the base business. And on the other side, there is the
mega deal impact. We have
got a good pipeline and some of these deals which was supposed to kick-in earlier, are getting delayed later
into the year as we speak.
Kawaljeet
Saluja
Okay, that
is clear. Just a final comment on how the pipeline after the conversion of the $2 bn mega deal as such? Can
you just comment on the pipeline?
That will be useful.
Salil
Parekh
So Kawal, this
is Salil. The pipeline, we still have a good pipeline of both large deals. We have some mega deals in the
pipeline as well. We see a lot
of the work that we are doing on cost, on efficiency, automation, in consolidation those are tracking well
with clients. There are some
transformation programs which are funded from within the cost efficiency those are also something that we are
tracking through. So we
do see with the two mega deals signed, a good pipeline today of large deals and we have mega deals in the
pipeline as well.
Kawaljeet
Saluja
Right. And
just one thing, is the upper end of the guidance band in any way predicated on future mega deal closures, or
it's based on the deals closed
up to now?
Salil
Parekh
So here, the
way we have built this guidance, or our view of the 3.5% is based on what we have closed today in large and
mega deals, and then we have
a way of estimating based on what we see into the future as an aggregate, not as a one-off, or not as a binary
discussion, but in aggregate
with what we see as the probabilities and also the probability of when that work will transition and the
revenues are . So those are what
we see in the pipeline and are baked into it.
Kawaljeet
Saluja
Thank you.
Moderator
Thank you.
The next question is from the line of Yogesh Aggarwal from HSBC. Please go ahead.
Yogesh
Aggarwal
Yeah, hi. Thanks
for letting me come. Salil, just a couple of questions. Firstly, on banking, your banking weakness has been
there for a few quarters and
now most other companies are showing weakness as well. Whereas if you look at the clients itself, most of
their financial results, the
tech commentaries and the data is not that weak. So where is the disconnect you think? Are they spending more
with captives or smaller
subcontractors? Where is this market share loss coming from?
Salil
Parekh
Yogesh, I think,
what we see in our financial services or banking part of financial services, there are different clients of
ours that have different patterns
in terms of their own pressures within their business. Some of our clients have had good results, but there
are some which have had more
difficult economic situations.
Also with a
mix from geography between Europe, Asia Pacific, and US, when you break it down into specific sub-industry
areas, when you look at asset
management, when you look at investment banking, when you look at payments or mortgages, those are the ones
where we are seeing the impact.
Our sense is,
generally our clients are not spending on those projects. It is not that they are spending somewhere else.
Typically, they are choosing
not to spend at this time. And as the environment changes, we will see how that pattern changes.
Yogesh
Aggarwal
Okay, thanks.
And just a quick follow-up. The revised guidance now, at the lower end, I wanted to ask, you have already won
few mega deals and the lower
end of the guidance suggests almost negative or flattish growth for the next three quarters, which would also
mean that for six quarters,
seven quarters now, revenues would be flat. So what are the assumptions for the lower end of the guidance I
wanted to know?
Salil
Parekh
See, here as
Nilanjan was sharing about the guidance, the approach is really focused on what we have seen in terms of
volumes, discretionary projects
in Q1 and an overlay then of the actual mega deals and large deals we have already won, and the estimate that
we are looking at.
Some of those
deals have start dates have moved out, whereas the volume and discretionary project slowing is still in
quarter. So our view is based
on how that plays out between those trends, we saw the 1% in terms of the lower end of the guidance when you
combine that and then, of
course, the high end we talked about earlier.
Yogesh
Aggarwal
Great. Thanks,
Salil. Thank you.
Moderator
Thank you.
The next question is from the line of Ankur Rudra from J.P. Morgan. Please go ahead.
Ankur Rudra
Thank you.
Salil, thank you for the updated guidance. I just wanted to get a sense of, obviously, the ask rate for the
next three quarters has now
moderated from, maybe it could have been 2% to 4%. With the same old guidance, it's 0% to 1.5% as discussed.
Just curious about the discretionary
cuts and the delays you referenced in your guidance change description. Has this happened more towards the
latter half of the quarter?
Has there been a linear change over the course of the quarter?
Salil
Parekh
So there, Ankur,
the way we have seen it is, there will be no difference in the pattern at the beginning or the end of the
quarter. It is more focused
on the industry that we referenced in our opening remarks between Nilanjan and me. We have seen in different
places the discretionary
work and some transformation work, where it has either slowed or stopped based on different industries.
Ankur Rudra
Okay. And also,
I just want to get a sense of maybe asking this in a slightly different way. Obviously, the guidance change is
quite drastic. Is this
just the change in environment of spending over the course of the last three months? Or is this also a
difference in the way you measure
the likelihood of success of when the deals ramp-up, or the win rate of future deals? Just curious about that
and if this guidance is
more conservative anyway versus the last time you said it?
Salil
Parekh
So there, it
is a combination, as you pointed out, of the environment in terms of the discretionary or transformational
projects in the quarter. And
then some of the mega deals and large deals, we saw a delay in decision-making in closing and also delay or
changes in the start time
or ramp-up of the profile of that deal. We have actually not seen any change in the win rate. And in fact,
internally, we had a good win
rate in Q1, and we continue to see good traction, whether it is consolidation, cost efficiency on the win rate
side.
Ankur Rudra
Appreciate
that. Just one clarification, if you could. I know this $2 bn framework agreement that you referenced is the
second large deal. Could
you clarify if this is fully contracted? And is this type of deal historically also been disclosed in your
TCV’s over the last few
quarters or years?
Salil
Parekh
This deal,
while we have first made the announcement, and I'm sure you have seen, we have completed the contract signing
of the deal, that is when
the deal was announced. These types of deals were also included in the past within our large deal mix. Of
course, in the past, there was
no requirement of disclosing the specific values.
Ankur Rudra
Okay. Understood.
Last question if I can. On margins, they were obviously flattish this time, it seemed like you have done well
given what the growth has
been. The five-point margin maximization plan you have highlighted, is this you playing offense or defense on
margins? In other words,
is Infosys confident of potentially expanding margins in F '24? Or is it more for margin defense because
growth outlook does not look
very strong, at least at the lower end of guide?
Nilanjan
Roy
Yes. So like
we said, I mean, this is a two-year program we have started. It is quite comprehensive. It is just not looking
at cost, it is looking
at portfolio. And this is now being led personally by Jayesh with 20 tracks, 30 leaders. Of course, our
aspiration continues to be that
we will aspire for higher margins than where we are today. So from that perspective, it is offensive -- on
offense, I would say offensive,
but on offense, this thing to increase our margins. That is the intent.
Ankur Rudra
Appreciate
it, thank you, and best of luck.
Moderator
Thank you.
The next question is from the line of Apurva Prasad from HDFC Securities. Please go ahead.
Apurva
Prasad
Yes, thanks
for taking my question. Salil, just wanted a broad further on the guidance. In the last quarter, you had
referred to achieving top-end
basis the strength of pipeline and factors that are binary. So are those binary factors still in the pipeline
or converted but transition
is taking longer? So what I am trying to get at is how should we really reconcile the change in revenue guide
in the last three months
between delay and volume cuts, which is as large as $600 mn?
Salil
Parekh
So there, we
have already announced two mega deals, which is a positive. We have large and mega deals in the pipeline. The
way we have seen it is really
the two points you mentioned, which is the volume discretionary work in quarter and the delay in the start of
the realization, transition
of some of the large and mega deals, those are what have translated to the change in the guidance.
Apurva
Prasad
Any way that
you could split those factors, how much of an impact would that have been?
Salil
Parekh
We will not
be in a position to quantify that further between those two, unfortunately.
Apurva
Prasad
So okay. And
just how would you characterize the business environment and your client conversations at the end of the
quarter as compared to how it
was at the beginning of the quarter?
Salil
Parekh
So there, it
is really, the way we see it is, our pipeline for large and mega deals is in excellent shape as we closed the
quarter. We see good traction
for mega deals and our large deals. The focus is much more when you are talking to clients on efficiency or
cost or consolidation. We
have a real traction with them. We see less discussions on digital transformation.
And then in
general, across the client base for those industries that I referenced in the opening remark, we see where
there are discretionary programs
where the client feels that they can slow them or pause them for some time, we see that action. So those are
the two sort of actions we
are seeing. Very good traction, in fact, on the large and mega deals.
Moderator
Apurva, does
that answer your question?
Apurva
Prasad
Yes, thanks.
Moderator
Thank you.
The next question is from the line of Kumar Rakesh from BNP Paribas Please go ahead.
Kumar
Rakesh
Hi, good evening.
Thank you for taking my question. My first question was more of a clarification. So can you just confirm the
process of deciding the revenue
growth guidance? Is it the same, which was last fiscal year versus this year? Or have you changed some of the
assumptions for the processes
that you follow?
Salil
Parekh
Hi, Rakesh.
This is Salil. So we have following the same approach that we followed over the last several years as we build
our outlook or our guidance
that we share with the market.
Kumar
Rakesh
Great. Got
it. Thanks. My second question was on the margin side. So this quarter, we had a slight decline on the margin
sequentially. Now wage hike
is yet to be given out. So how confident are you on holding on to the current margin or the margins which we
had last year? And the cost
saving program also you are going to start running? Or there would be more of headwinds than tailwinds on the
margin side?
Nilanjan
Roy
As you saw
my margin walk, we had a 70 basis points benefit from utilization, cost optimization. So we are seeing the
tailwinds of that. And the
big part of that, we actually put back into employee-related compensation, which is variable pay, that is a
big part - promotion. So it
is not that we are losing that to the market. That is a conscious decision for us to plow it back towards
employees.
So as we look
ahead, we are actively considering compensation hikes, we announced this as well at press conference earlier.
And the new program that
kicks-in, we think in optimization will give us the necessary tailwinds to be well within the margin guidance
band.
Kumar
Rakesh
Thanks for
that. My last question was around the volume commentary which you gave. So last quarter in April when we had
the discussion. You had talked
about that volume through the quarter, you were seeing signs of improvement. However, in this quarter, you
have seen performing much below
your expectation. So which are specific pockets you are seeing the weakness specifically? Is it more client
specific or the entire industry
working a much sharper weakness?
Nilanjan
Roy
It is a
client-specific,
like this time iIn fact, we saw slightly more resilience in the US-based clients. Europe turned out to be
slightly weaker. So it is very
client specific actually across. I mean, it is sort of a leaking bucket in a number of clients. There is no
large drop-off. And this is
largely with the discretionary part. So it is some programs which can be pulled back and are discretionary in
the nature, those are the
ones we are seeing.
Kumar
Rakesh
Thanks for
that.
Moderator
Thank you.
The next question is from the line of James Friedman from Susquehanna. Please go ahead.
James Friedman
Hi, thank you.
Salil, I think many investors are wondering, so I appreciate your thoughts. Does it seem to you that the soft
demand was primarily due
to macro factors, which are presumably temporary? Or is it potentially something more profound like perhaps
related to the relevance of
services or mindshare? So is this just macro it is going to go away, or is it a question of services in
itself?
Salil
Parekh
So this is
Salil. Thanks for the question. The way we see it today, we see this demand environment, especially on
discretionary, that we have been
discussing so far, as a function of the macro environment. We can see, for example, if you look at different
industries, manufacturing
growing at 21%, other industry is doing well, whereas financial service is weaker. So our service portfolio,
we believe, works well.
We have already
transformed the company, moved it predominantly into a digital business. We are very strong on cloud with our
cobalt offering. And now
with generative AI and broadly with AI, we have launched our Topaz offering.
My sense is
that those are resonating well with clients. And the places where we see the constraints have been more with
the macro. Even some of the
large and mega deals we are winning, we are winning against a fairly intense competition where we are
demonstrating our capabilities,
whether it is on transformation or on cost or efficiency or consolidation.
James Friedman
Okay, thank
you for that context, Salil. I will drop back in the queue.
Moderator
Thank you.
The next question is from the line of Abhishek Bhandari from Nomura. Please go ahead.
Abhishek
Bhandari
Yeah. Thank
you. I have two questions. First of all, Salil, congrats to you for this $2 bn mega deal. And if you could
share some more details around
this project given that it is probably the largest you announced anywhere globally. Is it pure services deal?
Or there is an element of
any hardware purchase along with it? And do you think this will get into revenue translation more in the
second half of this year?
Salil
Parekh
So thanks for
the question. On this specific deal, what we have shared in the public domain is as per the filing with the
stock exchange. It really
focuses on work that we are doing related to AI and automation-led development, modernization and maintenance
services. We do not have
anything more to add to that comment.
Abhishek
Bhandari
Sure. And
do you think this goes into revenue translation in second half?
Salil
Parekh
Yes. So again,
there, we do not have anything more on the specific deal. It is more about the general comments that we have
talked about the large and
mega deals. We do see, in general, across our large and mega deals, the revenue coming through in terms of the
transitions and revenue
realization more towards the later part of the year.
Abhishek
Bhandari
Got it. Thank
you Salil for that. Nilanjan, my final and second question is to you. So you commented that the salary hikes
are under active consideration.
So do you think this year, the hike cycle could differ compared to a usual cycle? And it could be more linked
to when the growth comes
back, we probably will be in a better position to give the hikes for employees?
Nilanjan
Roy
So like I said,
we are considering everything. Nothing to add more than that really in terms of timing or anything like that.
Abhishek
Bhandari
Okay, got it.
Thank you and all the best.
Moderator
Thank you.
The next question is from the line of Moshe Katri from Wedbush Securities. Please go ahead.
Moshe Katri
So far, Europe
has really been holding up well, much better than the US. Can you talk a bit about what you are seeing in
Europe, maybe areas where you
are seeing some strength in terms of verticals? I am assuming the UK is a big part of it. And if that trend
continues based on what you
are seeing, i.e. is Europe still holding in there or is it also slowing down? That is my first question,
thanks.
Salil
Parekh
So thanks to
your question. This is Salil. We saw good traction, and we have seen that over the last several quarters in
Europe, as you pointed out.
We have seen that, especially in the manufacturing segment. We have had good traction in multiple geographies
in Europe. So we have a
good traction in the Nordics. We also announced a strategic win in the Nordics, which was public a few weeks
ago. We have good traction
in Germany, as you referenced, a good traction in the UK. So we have had good traction so far.
Now the macro
environment, we feel, as Nilanjan also pointed earlier, is definitely something that is affecting overall in
Europe. So we are seeing
within the segments we referenced, for example, Financial Services and the sub-segments there in telco, in
some parts of retail, those
being impacted in Europe as well, and we will see how that plays out into the future.
Moshe Katri
Okay. And my
follow-up is about an article that came out this week in the local media in India, suggesting that there is an
uptick in demand for lateral
hires in the industry. And these hires will probably start happening in the month of October and on. Does that
make sense to you versus
what you are seeing out there in terms of demand and pipeline and the ramp up, that is kind of, as you said,
it is going slower than expected?
Salil
Parekh
So for that,
my sense is, again, some of the comments you might have heard earlier from Nilanjan, our utilization has gone
up. Our total headcount
number is reduced, and we believe, we have some headroom for the utilization to go up further. So that would
be the context in which we
are operating.
Moshe Katri
Understood.
Thanks for the color.
Moderator
Thank you.
The next question is from the line of Mukul Garg from Motilal Oswal Financial Services. Please go ahead.
Mukul Garg
Yes. Hi, thanks.
Salil, just wanted to kind of probe a bit further on the change in the guidance, and I'm just focusing on the
lower end of your previous
guidance. Where it does not look like the miss in Q1 from what you are kind of thinking about last quarter was
that meaningful for the
guidance at the lower end to come down so drastically.
So is it fair
to assume that, the incremental slowdown which you have witnessed is more front ended, i.e. in Q2? Or was
there an expectation of a meaningful
pickup-in the business in the second half, which is now no longer there?
Salil
Parekh
So on the
guidance,
again, some of the comments that Nilanjan shared earlier, we saw in Q1, the volume and discretionary projects
slowing. And based on that,
plus the delay in some of the large or mega deals are starting up in terms of revenue, we felt that has given
us the view of the lower
end of the guidance.
What we see
really the function of the way, the volume in the discretionary project evolves. The macro environment, as we
look out, is changing as
we see things, which are from US to Europe, to Asia, keeping those factors in mind is how we build that lower
end of the guidance.
Mukul Garg
Sure. And
similarly,
on similar track, is there something, we need to kind of see, visualize in terms of sanctity of large deal
TCV, which we disclosed. The
commentary on pipeline and large deal wins continues to remain very robust. But there is a fair bit of pain,
which you are kind of talking
about from a discretionary side, which would be coming out of the large deal number.
So can you
share the impact on overall TCV? Or is that something, which you would kind of start reassessing simply
because it is giving a misleading
picture, when you look at only the large deals wins?
Salil
Parekh
So there are
some distinctions, what we are seeing in the large deals, mega deals, wins in the pipeline and what is more
recent in the past quarters
is more on cost or efficiency or consolidation. And so that work is continuing.
What we referenced
on the slowdown is more on discretionary projects, which are projects or transformation projects, which are
from before, which could have
been paused or slowed down by the client, and specifically in the industries, where we referenced the impact.
Those are the ones, we are
seeing. So they are not, in a sense, correlated with the large deals that we are looking at today.
Mukul Garg
Sure. And if
I may just ask one clarification. You know, is there any impact in terms of your growth guidance from any
client-specific issue, specifically,
as Nilanjan kind of highlighted in Europe, in terms of client in-sourcing or kind of slowing down business to
you, in any vertical?
Salil
Parekh
So there, what
Nilanjan was referencing to is not that it is client specific, as you know, in one or two clients. It was more
in terms of clients within
that industry vertical and more now shifting, what we had in the US to the European market. So it is not that
we have specific one or
two clients, where we have seen this impact showing up from there.
Mukul Garg
Sure. I think
that is helpful. Thanks for taking my questions. I will get back in the queue.
Moderator
Thank you.
The next question is from the line of Surendra Goel from Citigroup. Please go ahead.
Surendra
Goyal
Yeah. Good
evening. So, I know that you do not share this data point, but could you give us a directional sense of how
ACV, annualized contract value
trends would have moved or would compare Y-o-Y, given the changing nature of the things towards the large and
mega cost takeout deals?
Salil
Parekh
Thanks for
the questions, Surendra. We are not in a position to share that information.
Surendra
Goyal
Okay. And on
this recently announced mega deal in terms of renewal versus new?
Salil
Parekh
The one that was announced after
the quarter, before the results?
Surendra Goyal
Yes.
Salil
Parekh
Okay. So again,
we are not announcing the net new in a specific deal. What I mentioned earlier was the type of work, and that
is what, we can say, in
addition to what we filed with the stock exchange.
Surendra
Goyal
Sure. Thanks,
Salil.
Moderator
Thank you.
The next question is from the line of Prashant Kothari from Pictet. Please go ahead.
Prashant
Kothari
Yeah. A couple
of questions. One is, when you are looking at the revenue growth guidance this year, it seems we will be
growing maybe worse than the
peer group that we track, even in terms of the deciding on management compensation, how do we think about
that? What are the things that
we need to do in order to regain the kind of competitiveness in the market, so we can continue to outgrow out
there? Or do you think,
it is all down to discretionary demand being weak and therefore, there is nothing much that we can do, and we
just need to wait for the
cycle to come back? That is the first question.
Salil
Parekh
So there, we
have a view with our portfolio. There is a portfolio of services that works well with our clients. We
absolutely have the intensity in
the client environment with a large and mega deal wins to be back into the growth mode that we have been in
for the last several years.
We also have
a high base for comps. Q1 of last year was a 21% growth year-on-year, in the previous year, whereas the
environment of other peers were
not there. So all of those factors coming into play, we are very much of the view that, we have what we need,
and we are continuing to
go into new areas, like, generative AI or continued investments in cloud to build out, what we want, what our
clients are looking for,
to continue with the growth situation.
Prashant
Kothari
Okay. Thank
you. So if it is kind of more about the external environment then, what would be a good kind of a leading
indicator that you would use
may be internally to figure out that, this weak discretionary demand phase is kind of coming to an end?
Salil
Parekh
So internally,
we have several elements, that we look at. These are not typically data we share externally. But in terms of
the overall translation of
that is what we translate into the guidance there.
Prashant
Kothari
All right.
Yeah, which is presenting a bit of a weak picture as of now. All right. Okay. Thank you very much.
Moderator
Thank you.
The next question is from the line of Bryan Bergin from TD Cowen. Please go ahead.
Bryan
Bergin
Hi, good evening.
Thank you. I wanted to ask on the margin expansion program. So I understand that this is a two-year
initiative. Can you give us a sense
of materiality to just how are you thinking about the potential cost savings or an approximate margin
expansion potential that you expect
to achieve from these pillars?
Nilanjan
Roy
Yes. So we
cannot really quantify it. These are five critical tracks, pricing and a more holistic sort of value-based
selling approach. That is a
big one. We know from a pyramid perspective, we have a lot of scope as well. We understand the generative AI
and our ongoing automation
projects, which we have. That is a continuously and actually with generative AI, we think, we can up the
productivity from baseline even
more.
Some of our
portfolios in our mix, how do we improve margins, – a dedicated head team looking at these accounts. And
finally, the indirect cost
side and how do we keep a cap on that, looking at more efficient buying, procurement, savings, etc.
So it is a
quite a holistic approach, like I said, across 20 tracks. And these are being kicked-off. We cannot quantify
the number at this stage.
But like we said, our aspiration continues to be to improve our margin in the medium term.
Bryan
Bergin
Okay. And then
my follow-up, I understand you have got a lot of questions here on the fiscal '24 growth outlook. Just trying
to clarify maybe here and
maybe tie all these questions together. Is it right to say that at the low end of your '24 growth guidance,
that you are assuming a worsening
of volume reductions and a worsening of decision-making pace for the balance of the year? And then at the
upper end, that the decision-making
improves? Just trying to really get to the point of are you assuming more of the same in the improvement or
further deterioration, within
this range?
Salil
Parekh
There, the
way we have constructed this guidance, we see that, there is a change or a difference in the environment, in
the decision-making. We have
seen some of the impact in some of the industries that we shared earlier. And we will see how that volume,
discretionary work translates
itself over time. So we baked in some range of possibilities into that. We wanted to see how those
possibilities play out.
Bryan
Bergin
Thank you.
Moderator
Thank you.
The next question is from the line of Nitin Padmanabhan from Investec. Please go ahead.
Nitin
Padmanabhan
Yeah. Hi, good
evening. Thanks for the opportunity. So Nilanjan, the employee headcount is down 3% over the last two
quarters, but the absolute employee
cost is up 2%. So what explains that dynamic?
Nilanjan
Roy
Yeah. So like
I said, this time, we have about 90 bps of impact, we do not see the entire thing in employee cost because
even third-party costs have
come down. But if you see about 90 basis points, actually more than 120 basis points and then 90 basis points
is actually in employee
costs, variable pay is a big one, which we have upped consciously, in this quarter, a little bit of promotion,
then there are other balancing
items.
Nitin
Padmanabhan
Yeah. So, just
a clarification there. So in the context of the deteriorating environment and attrition sort of falling, the
assumption was that employee
cost would be something relatively easier to manage. And obviously, because the performance, company-wide
performance itself is lower,
the variable also should be lower. So what is driving the dynamic on higher variable pay and the compensation?
Nilanjan
Roy
So we look
at this holistically. And we do not look at just one quarter and decide these decisions. We are looking at the
overall environment and
attrition, etc, and that is a decision we collectively take. It is just not on a quarter-to-quarter basis.
We have enough
headroom in our utilization to grow volumes. And therefore, the attrition, which we see is not entirely
replaced by lateral hiring. A
part of that happens through lateral hiring, and we continue to re-skill and move up our fresher bench and
rotate people through projects.
So that benefit, we continue to get.
And like I
said, the 70 bps benefit, which we are seeing is coming partly because of improved utilization.
Nitin
Padmanabhan
Sure. And lastly,
the $2.1 bn deal that we announced, in which vertical is that? If you could clarify that would be helpful?
Nilanjan
Roy
No, we do not
mention that on what vertical it is.
Nitin
Padmanabhan
Okay, sir.
Thank you so much all the very best.
Nilanjan
Roy
Thank you.
Moderator
Thank you.
The next question is from the line of Vibhor Singhal from Nuvama Equities. Please go ahead.
Vibhor
Singhal
Yeah, hi. Good
evening. Thanks for taking my question. So, Salil, two questions from my side. One on the harping on the
guidance part again. I mean,
for long, I think, the guidance that Infosys gives is kind of seen a benchmark for the industry and a lead
across for the entire sector
as well. And the sharp cut that we had at this time. So just wanted to understand, the putting on hold of
discretionary spend and other
issues that you mentioned that caused us to lower the guidance, do you see that as a very Infosys specific
thing, or do you see it more
of an industry across the board that maybe other companies are not seeing it right now, they might be
following suit in the next few quarters.
Or is it something in the nature of our portfolio because of which you probably feel that it was cyclical?
I mean, in
the last three months, because the other companies that have reported, there might not have been such number
difference in the guidances.
But the kind of $600 mn shock that we have seen, we have not seen that kind of a change in commentary over the
past three months by any
other player per se. So would you like to basically give some colour on how readable is this environment, that
has caused this deterioration
to us and not to the other companies in the sector or the industry?
Salil
Parekh
So there, my
sense is, if you look at our Q1 number, we have 1% quarter-on-quarter growth, which from what I have seen
across the industry is, maybe
one of the strongest quarter-on-quarter growth. We have a clear view of what we see as we have been discussing
on large and mega deals,
giving us a strong growth orientation later in the year with some discretionary work, which is slowing in Q1.
So I do not
have a sense for the other players. That is how we see it. And if I look at Q1, we have a good outcome in
terms of a solid quarter and
looking at the industry, maybe higher growth Q-on-Q than many others.
Vibhor
Singhal
Got it. And
in terms of conversations with the clients, just a follow-up on that, in terms of the conversations with the
clients, I think you mentioned
it before on the call as well. What is the overall general conversation like, when they put this discretionary
part of the deals on hold?
I mean, do they want to do it, given the weak macro at this point of time? Is there any rethinking on the part
of whether they need this
kind of spend at all? Are those original decisions being questioned itself to begin with? What exactly is the
nature of the conversation
with the clients, which are putting these spends on hold?
Salil
Parekh
So here, what
we have seen is, again, in the industries, we referenced before, whether it is financial services or telco or
hi-tech, the clients or
the industries are going through a difficult environment themselves in the macro. They are looking for help or
support from their partners
like us, where they put some projects, which they perceive to be not immediately relevant for them on a pause
or slowing. Those are the
discretionary works that slow down. And we will see as the environment changes, what happens there.
Vibhor
Singhal
Got it. Great.
Thanks for taking my question. And wish you all the best for the rest of the year.
Moderator
Thank you.
Ladies and gentlemen, that would be our last question for today. I now hand the conference back to the
management for their closing remarks.
Thank you, and over to you.
Salil
Parekh
Thanks. This
is Salil. I just want to close out. Thank you, everyone, for joining us. In summary, for us, really, we have
had a solid Q1, very good
Q-on-Q growth, solid margins, excellent large deals and mega deal wins. This sets us up very nicely, with some
of the delays and the volume
slowing more for the later part of the year. We have also got incredible traction in generative AI with 80
projects and the Topaz work
resonating with clients.
We now put
in place a stronger program on margin expansion, which is in play. Putting all of that together, we see this
is a year, where we will
make that difference translating to mega deals and large deals, and as we come towards the later part of the
year, showing the realization
of all of those.
So thanks again,
everyone, for joining in, and look forward to catching up at the next quarterly call.
Moderator
Thank you
very much, members of the management. Ladies and gentlemen, on behalf of Infosys, that concludes this
conference. Thank you all for joining
us and you may now disconnect your lines.
Exhibit
99.6
Form of Release to Stock Exchanges
INDEPENDENT
AUDITOR’S REPORT ON AUDIT OF CONSOLIDATED FINANCIAL RESULTS
TO THE BOARD OF DIRECTORS OF INFOSYS
LIMITED
Opinion
We
have audited the accompanying Statement of Consolidated Financial Results of INFOSYS Limited
(the “Company”) and its subsidiaries (the Company and its subsidiaries together referred
to as the “Group”)
for the quarter ended June 30, 2023, (the “Statement”) being submitted by the Company pursuant to the
requirements of Regulation
33 of the SEBI (Listing Obligations and Disclosure Requirements) Regulations, 2015, as amended (the “Listing
Regulations”).
In
our opinion and to the best of our information and according to the explanations given to us, the Statement:
|
i.
|
|
includes the results
of the subsidiaries as given in the Annexure to this report;
|
|
ii.
|
|
is presented in
accordance with the requirements of Regulation 33 of the Listing Regulations; and
|
|
iii.
|
|
gives a true and
fair view in conformity with the recognition and measurement principles laid down in the Indian Accounting
Standard 34 “Interim
Financial Reporting” (“Ind AS 34”) prescribed under section 133 of the Companies Act, 2013
(the “Act”)
read with relevant rules issued thereunder and other accounting principles generally accepted in India of the
consolidated net profit
and consolidated total comprehensive income and other financial information of the Group for the quarter ended
June 30, 2023.
|
Basis
for Opinion
We
conducted our audit in accordance with the Standards on Auditing (“SA”s) specified under Section
143(10) of the Act. Our
responsibilities under those Standards are further described in Auditor’s Responsibilities for audit of the
consolidated financial
results section of our report. We are independent of the Group in accordance with the Code of Ethics issued by the
Institute of Chartered
Accountants of India (“ICAI”) together with the ethical requirements that are relevant to our audit of
the consolidated financial
results under the provisions of the Act and the Rules thereunder, and we have fulfilled our other ethical
responsibilities in accordance
with these requirements and the ICAI’s Code of Ethics. We believe that the audit evidence obtained by us is
sufficient and appropriate
to provide a basis for our audit opinion.
Management’s
Responsibilities for the Consolidated Financial Results
This
Statement which includes Consolidated financial results is the responsibility of the Company’s Board of
Directors and has been
approved by them for the issuance. The Statement has been compiled from the related audited interim condensed
consolidated financial
statements for the three months ended June 30, 2023. This responsibility includes the preparation and presentation
of these consolidated
financial results that give a true and fair view of the consolidated net profit and consolidated other
comprehensive income and other
financial information of the Group in accordance with the recognition and measurement principles laid down in the
Ind AS 34, prescribed
under Section 133 of the Act, read with relevant rules issued thereunder and other accounting principles generally
accepted in India
and in compliance with Regulation 33 of the Listing Regulations. The respective Boards of Directors of the
Companies included in the
Group are responsible for maintenance of the adequate accounting records in accordance with the provisions of the
Act for safeguarding
the assets of the Group and for preventing and detecting frauds and other irregularities; selection and
application of appropriate accounting
policies; making judgments and estimates that are reasonable and prudent; and the design, implementation and
maintenance of adequate
internal financial controls, that were operating effectively for ensuring the accuracy and completeness of the
accounting records, relevant
to the preparation and presentation of the respective financial results that give a true and fair view and are
free from material misstatement,
whether due to fraud or error, which have been used for the purpose of preparation of the consolidated financial
results by the Directors
of the Company, as aforesaid.
In
preparing the consolidated financial results, the respective Boards of Directors of the companies included in the
Group are responsible
for assessing the ability of the respective entities to continue as a going concern, disclosing, as applicable,
matters related to going
concern and using the going concern basis of accounting unless the respective Boards of Directors either intend to
liquidate their respective
entities or to cease operations, or have no realistic alternative but to do so.
The
respective Boards of Directors of the companies included in the Group are responsible for overseeing the financial
reporting process
of the Group.
Auditor’s
Responsibilities for Audit of the Consolidated Financial Results
Our
objectives are to obtain reasonable assurance about whether the consolidated financial results as a whole are free
from material misstatement,
whether due to fraud or error, and to issue an auditor’s report that includes our opinion. Reasonable
assurance is a high level
of assurance, but is not a guarantee that an audit conducted in accordance with SAs will always detect a material
misstatement when it
exists. Misstatements can arise from fraud or error and are considered material if, individually or in the
aggregate, they could reasonably
be expected to influence the economic decisions of users taken on the basis of these consolidated financial
results.
As
part of an audit in accordance with SAs, we exercise professional judgment and maintain professional scepticism
throughout the audit.
We also:
| • |
|
Identify
and assess the risks of material misstatement of the consolidated financial results, whether
due to fraud or error, design and perform audit procedures responsive to those risks, and
obtain audit evidence that is sufficient and appropriate to provide a basis for our opinion.
The risk of not detecting a material misstatement resulting from fraud is higher than for
one resulting from error, as fraud may involve collusion, forgery, intentional omissions,
misrepresentations, or the override of internal control. |
| • |
|
Obtain
an understanding of internal financial control relevant to the audit in order to design audit
procedures that are appropriate in the circumstances, but not for the purpose of expressing
an opinion on the effectiveness of such controls. |
| • |
|
Evaluate
the appropriateness of accounting policies used and the reasonableness of accounting estimates
made by the Board of Directors. |
| • |
|
Evaluate
the appropriateness and reasonableness of disclosures made by the Board of Directors in terms
of the requirements specified under Regulation 33 of the Listing Regulations. |
| • |
|
Conclude
on the appropriateness of the Board of Directors’ use of the going concern basis of
accounting and, based on the audit evidence obtained, whether a material uncertainty exists
related to events or conditions that may cast significant doubt on the ability of the Group
to continue as a going concern. If we conclude that a material uncertainty exists, we are
required to draw attention in our auditor’s report to the related disclosures in the
consolidated financial results or, if such disclosures are inadequate, to modify our opinion.
Our conclusions are based on the audit evidence obtained up to the date of our auditor’s
report. However, future events or conditions may cause the Group to cease to continue as
a going concern. |
| • |
|
Evaluate
the overall presentation, structure and content of the consolidated financial results, including
the disclosures, and whether the consolidated financial results represent the underlying
transactions and events in a manner that achieves fair presentation. |
| • |
|
Perform
procedures in accordance with the circular issued by the SEBI under Regulation 33(8) of the
Listing Regulations to the extent applicable. |
| • |
|
Obtain
sufficient appropriate audit evidence regarding the Financial Information of the entities
within the Group to express an opinion on the consolidated financial results. We are responsible
for the direction, supervision and performance of the audit of financial information of such
entities included in the consolidated financial results of which we are the independent auditors. |
| • |
|
Materiality
is the magnitude of misstatements in the consolidated financial results that, individually
or in aggregate, makes it probable that the economic decisions of a reasonably knowledgeable
user of the consolidated financial results may be influenced. We consider quantitative materiality
and qualitative factors in (i) planning the scope of our audit work and in evaluating the
results of our work; and (ii) to evaluate the effect of any identified misstatements in the
consolidated financial results. |
| • |
|
We
communicate with those charged with governance of the Company and such other entities included
in the consolidated financial results of which we are the independent auditors regarding,
among other matters, the planned scope and timing of the audit and significant audit findings
including any significant deficiencies in internal control that we identify during our audit. |
| • |
|
We
also provide those charged with governance with a statement that we have complied with relevant
ethical requirements regarding independence, and to communicate with them all relationships
and other matters that may reasonably be thought to bear on our independence, and where applicable,
related safeguards. |
|
Place: Bengaluru
Date: July 20, 2023
|
For DELOITTE HASKINS &
SELLS LLP
Chartered Accountants
(Firm's Registration No. 117366W/W-100018)

Sanjiv V. Pilgaonkar
Partner
(Membership No.039826)
UDIN: 23039826BGXSAL6293
|
Annexure to Auditor’s Report
List of Entities:
|
1.
|
Infosys
Technologies (China) Co. Limited
|
|
2.
|
Infosys
Technologies S. de R. L. de C. V.
|
|
3.
|
Infosys
Technologies (Sweden) AB
|
|
4.
|
Infosys
Technologies (Shanghai) Company Limited
|
|
5.
|
Infosys
Nova Holdings LLC.
|
|
6.
|
EdgeVerve
Systems Limited
|
|
8.
|
Skava
Systems Private Limited (under liquidation)
|
|
10.
|
Infosys
Arabia Limited (under liquidation)
|
|
11.
|
Infosys
Consulting Ltda.
|
|
12.
|
Infosys
Luxembourg S.a.r.l
|
|
13.
|
Infosys
Americas Inc. (under liquidation)
|
|
14.
|
Infosys
Public Services, Inc. USA
|
|
16.
|
Infosys
(Czech Republic) Limited s.r.o.
|
|
17.
|
Infosys
Poland Sp z.o.o
|
|
18.
|
Infosys
McCamish Systems LLC
|
|
19.
|
Portland
Group Pty Ltd
|
|
20.
|
Infosys
BPO Americas LLC.
|
|
21.
|
Infosys
Consulting Holding AG
|
|
22.
|
Infosys
Management Consulting Pty Limited
|
|
23.
|
Infosys
Consulting AG
|
|
24.
|
Infosys
Consulting GmbH
|
|
25.
|
Infosys
Consulting S.R.L (Romania)
|
|
26.
|
Infosys
Consulting SAS
|
|
27.
|
Infy
Consulting Company Ltd.
|
|
29.
|
Infosys
Consulting S.R.L (Argentina) (formerly a wholly-owned subsidiary of Infosys Consulting Holding
AG) became the majority owned and controlled subsidiary of Infosys Limited with effect from
April 1, 2022
|
|
30.
|
Infosys
Consulting (Belgium) NV
|
|
32.
|
Infosys
Financial Services GmbH (formerly known as Panaya GmbH) became a wholly owned subsidiary
of Infosys Singapore Pte. Ltd with effect from February 23, 2023
|
|
34.
|
Brilliant
Basics Holdings Limited (under liquidation)
|
|
35.
|
Brilliant
Basics Limited (under liquidation)
|
|
36.
|
Infosys
Singapore Pte. Ltd. (formerly known as Infosys Consulting Pte. Ltd.)
|
|
37.
|
Infosys
Middle East FZ LLC
|
|
39.
|
Fluido
Sweden AB (Extero)
|
|
42.
|
Fluido
Slovakia s.r.o
|
|
43.
|
Infosys
Compaz Pte. Ltd.
|
|
44.
|
Infosys
South Africa (Pty) Ltd
|
|
48.
|
Stater
Nederland B.V.
|
|
51.
|
Stater
Participations B.V.
|
|
52.
|
Stater
Belgium N.V./S.A.
|
|
53.
|
Outbox
systems Inc. dba Simplus (US)
|
|
55.
|
Simplus
Australia Pty Ltd
|
|
56.
|
Simplus
Philippines, Inc.
|
|
57.
|
Infosys
Fluido UK, Ltd. (formerly Simplus U.K, Ltd)
|
|
58.
|
Infosys
Fluido Ireland, Ltd. (formerly Simplus Ireland, Ltd)
|
|
59.
|
Infosys
Limited Bulgaria EOOD
|
|
60.
|
Infosys
BPM UK Limited
|
|
61.
|
Blue
Acorn iCi Inc. (formerly known as Beringer Commerce Inc)
|
|
62.
|
Kaleidoscope
Animations, Inc.
|
|
63.
|
Kaleidoscope
Prototyping LLC
|
|
65.
|
GuideVision
Deutschland GmbH
|
|
67.
|
GuideVision
Magyarorszag Kft
|
|
68.
|
GuideVision
Polska Sp. z.o.o
|
|
69.
|
Infosys
Business Solutions LLC
|
|
70.
|
Infosys
Germany GmbH (formerly known as Kristall 247. GmbH)
|
|
71.
|
GuideVision
UK Ltd (under liquidation)
|
|
72.
|
Infosys
Turkey Bilgi Teknolojileri Limited Sirketi
|
|
73.
|
Infosys
Germany Holding Gmbh
|
|
74.
|
Infosys
Automotive and Mobility GmbH & Co. KG
|
|
77.
|
Infosys
(Malaysia) SDN. BHD. (formerly Global Enterprise International (Malaysia) Sdn. Bhd.
|
|
78.
|
oddity
space GmbH acquired by Infosys Germany GmbH on April 20, 2022
|
|
79.
|
oddity
jungle GmbH acquired by Infosys Germany GmbH on April 20, 2022
|
|
80.
|
oddity
waves GmbH acquired by Infosys Germany GmbH on April 20, 2022
|
|
81.
|
oddity
group Services GmbH acquired by Infosys Germany GmbH on April 20, 2022
|
|
82.
|
oddity
code GmbH acquired by Infosys Germany GmbH on April 20, 2022
|
|
83.
|
oddity
code d.o.o. (subsidiary of oddity Code GmbH) acquired by Infosys Germany GmbH on April 20,
2022
|
|
84.
|
oddity
GmbH acquired by Infosys Germany GmbH on April 20, 2022
|
|
85.
|
oddity
(Shanghai) Co. Ltd. (subsidiary of oddity GmbH) acquired by Infosys Germany GmbH on April
20, 2022
|
|
86.
|
oddity
Limited (Taipei) (subsidiary of oddity GmbH) acquired by Infosys Germany GmbH on April 20,
2022
|
|
87.
|
Infosys
Public Services Canada Inc. (a wholly owned subsidiary of Infosys Public Services Inc.) incorporated
on July 8, 2022
|
|
88.
|
BASE
life science A/S acquired by Infosys Singapore Pte. Ltd. (formerly known as Infosys Consulting
Pte. Ltd.) on September 1, 2022
|
|
89.
|
BASE
life science AG (a wholly owned subsidiary of BASE life science A/S) acquired by Infosys
Singapore Pte. Ltd. (formerly known as Infosys Consulting Pte. Ltd.) on September 1, 2022
|
|
90.
|
BASE
life science GmbH (a wholly owned subsidiary of BASE life science A/S) acquired by Infosys
Singapore Pte. Ltd. (formerly known as Infosys Consulting Pte. Ltd.) on September 1, 2022
|
|
91.
|
BASE
life science Ltd. (a wholly owned subsidiary of BASE life science A/S) acquired by Infosys
Singapore Pte. Ltd. (formerly known as Infosys Consulting Pte. Ltd.) on September 1, 2022
|
|
92.
|
BASE
life science S.A.S. (a wholly owned subsidiary of BASE life science A/S) acquired by Infosys
Singapore Pte. Ltd. (formerly known as Infosys Consulting Pte. Ltd.) on September 1, 2022
|
|
93.
|
BASE
life science S.r.l. (a wholly owned subsidiary of BASE life science A/S) acquired by Infosys
Singapore Pte. Ltd. (formerly known as Infosys Consulting Pte. Ltd.) on September 1, 2022
|
|
94.
|
Innovisor
Inc. (a wholly owned subsidiary of BASE life science A/S) acquired by Infosys Singapore Pte.
Ltd. (formerly known as Infosys Consulting Pte. Ltd.) on September 1, 2022
|
|
95.
|
BASE
life science Inc. (a wholly owned subsidiary of BASE life science A/S) acquired by Infosys
Singapore Pte. Ltd. (formerly known as Infosys Consulting Pte. Ltd.) on September 1, 2022
|
|
96.
|
BASE
life science SL. (a wholly owned subsidiary of BASE life science A/S) incorporated on September
6, 2022
|
|
97.
|
Panaya
Germany GmbH, a wholly owned subsidiary of Panaya Inc. was incorporated on December 15, 2022
|
|
98.
|
Infosys
Norway, a wholly owned subsidiary of Infosys Singapore Pte. Ltd. was incorporated on February
7, 2023
|
|
99.
|
Infosys
Employees Welfare Trust
|
|
100.
|
Infosys
Employee Benefits Trust
|
|
101.
|
Infosys
Science Foundation
|
|
102.
|
Infosys
Expanded Stock Ownership Trust
|
INDEPENDENT
AUDITOR’S REPORT ON AUDIT OF THE STANDALONE FINANCIAL RESULTS
TO
THE BOARD OF DIRECTORS OF INFOSYS LIMITED
Opinion
We
have audited the accompanying Statement of Standalone Financial Results of INFOSYS LIMITED (the
“Company”), for the
quarter ended June 30, 2023, (the “Statement”), being submitted by the Company pursuant to the
requirements of Regulation
33 of the SEBI (Listing Obligations and Disclosure Requirements) Regulations, 2015, as amended (the “Listing
Regulations”).
In
our opinion and to the best of our information and according to the explanations given to us, the Statement:
|
a.
|
|
is
presented in accordance with the requirements of Regulation 33 of the Listing Regulations;
and
|
|
b.
|
|
gives
a true and fair view in conformity with the recognition and measurement principles laid down
in the Indian Accounting Standard 34 “Interim Financial Reporting” (“Ind
AS 34”) prescribed under section 133 of the Companies Act, 2013 (the “Act”)
read with relevant rules issued thereunder and other accounting principles generally accepted
in India of the net profit and total comprehensive income, and other financial information
of the Company for the quarter ended June 30, 2023.
|
Basis
for Opinion
We conducted our audit
of the Statement in accordance with the Standards on
Auditing (“SA”s) specified under Section 143(10) of the Act. Our responsibilities under those
Standards are further described
in Auditor’s Responsibilities for the Audit of the Standalone Financial Results section of our report. We
are independent of the
Company in accordance with the Code of Ethics issued by the Institute of Chartered Accountants of India
(“ICAI”) together
with the ethical requirements that are relevant to our audit of the Standalone Financial Resultsfor the quarter
ended June 30, 2023 under the provisions of the Act and the Rules thereunder, and we have fulfilled our
other ethical responsibilities
in accordance with these requirements and the ICAI’s Code of Ethics. We believe that the audit evidence
obtained by us is sufficient
and appropriate to provide a basis for our audit opinion.
Management’s
Responsibilities for the Standalone Financial Results
This
Statement, which includes the Standalone financial results is the responsibility of the Company’s Board of
Directors, and has been
approved by them for the issuance. The Statement has been compiled from the related audited interim condensed
standalone financial statements
for the three months ended June 30, 2023. This responsibility includes the preparation and presentation of the
standalone financial results
for the quarter ended June 30, 2023 that give a true and fair view of the net profit and other comprehensive
income and other financial
information in accordance with the recognition and measurement principles laid down in Ind AS 34, prescribed under
Section 133 of the
Act, read with relevant rules issued thereunder and other accounting principles generally accepted in India and in
compliance with Regulation
33 of the Listing Regulations. This responsibility also includes maintenance of adequate accounting records in
accordance with the provisions
of the Act for safeguarding the assets of the Company and for preventing and detecting frauds and other
irregularities; selection and
application of appropriate accounting policies; making judgments and estimates that are reasonable and prudent;
and the design, implementation
and maintenance of adequate internal financial controls that were operating effectively for ensuring the accuracy
and completeness of
the accounting records, relevant to the preparation and presentation of the standalone financial results that give
a true and fair view
and is free from material misstatement, whether due to fraud or error.
In
preparing the Standalone Financial Results, the Board of Directors is responsible for assessing the
Company’s ability, to continue
as a going concern, disclosing, as applicable, matters related to going concern and using the going concern basis
of accounting unless
the Board of Directors either intends to liquidate the Company or to cease operations, or has no realistic
alternative but to do so.
The
Board of Directors is also responsible for overseeing the financial reporting process of the Company.
Auditor’s
Responsibilities for the Audit of the Standalone Financial Results
Our
objectives are to obtain reasonable assurance about whether the Standalone Financial Results as a whole are free
from material misstatement,
whether due to fraud or error, and to issue an auditor’s report that includes our opinion. Reasonable
assurance is a high level
of assurance, but is not a guarantee that an audit conducted in accordance with SAs will always detect a material
misstatement when it
exists. Misstatements can arise from fraud or error and are considered material if, individually or in the
aggregate, they could reasonably
be expected to influence the economic decisions of users taken on the basis of this Standalone Financial Results.
As
part of an audit in accordance with SAs, we exercise professional judgment and maintain professional scepticism
throughout the audit.
We also:
|
•
|
|
Identify
and assess the risks of material misstatement of the Standalone Financial Results, whether
due to fraud or error, design and perform audit procedures responsive to those risks, and
obtain audit evidence that is sufficient and appropriate to provide a basis for our opinion.
The risk of not detecting a material misstatement resulting from fraud is higher than for
one resulting from error, as fraud may involve collusion, forgery, intentional omissions,
misrepresentations, or the override of internal control.
|
|
•
|
|
Obtain
an understanding of internal financial controls relevant to the audit in order to design
audit procedures that are appropriate in the circumstances, but not for the purpose of expressing
an opinion on the effectiveness of such controls.
|
|
•
|
|
Evaluate
the appropriateness of accounting policies used and the reasonableness of accounting estimates
made by the Board of Directors.
|
|
•
|
|
Evaluate
the appropriateness and reasonableness of disclosures made by the Board of Directors in terms
of the requirements specified under Regulation 33 of the Listing Regulations.
|
|
•
|
|
Conclude
on the appropriateness of the Board of Directors’ use of the going concern basis of
accounting and, based on the audit evidence obtained, whether a material uncertainty exists
related to events or conditions that may cast significant doubt on the ability of the Company
to continue as a going concern. If we conclude that a material uncertainty exists, we are
required to draw attention in our auditor’s report to the related disclosures in the
Statement or, if such disclosures are inadequate, to modify our opinion. Our conclusions
are based on the audit evidence obtained up to the date of our auditor’s report. However,
future events or conditions may cause the Company to cease to continue as a going concern.
|
|
•
|
|
Evaluate
the overall presentation, structure and content of the Standalone Financial Results, including
the disclosures, and whether the Standalone Financial Results represent the underlying transactions
and events in a manner that achieves fair presentation.
|
|
•
|
|
Obtain
sufficient appropriate audit evidence regarding the Standalone Financial Results of the Company
to express an opinion on the Standalone Financial Results.
|
Materiality
is the magnitude of misstatements in the Standalone Financial Results that, individually or in aggregate, makes it
probable that the
economic decisions of a reasonably knowledgeable user of the Standalone Financial Results may be influenced. We
consider quantitative
materiality and qualitative factors in (i) planning the scope of our audit work and in evaluating the results of
our work; and (ii) to
evaluate the effect of any identified misstatements in the Standalone Financial Results.
We
communicate with those charged with governance regarding, among other matters, the planned scope and timing of the
audit and significant
audit findings, including any significant deficiencies in internal control that we identify during our audit.
We
also provide those charged with governance with a statement that we have complied with relevant ethical
requirements regarding independence,
and to communicate with them all relationships and other matters that may reasonably be thought to bear on our
independence, and where
applicable, related safeguards.
|
Place: Bengaluru
Date: July
20, 2023
|
For
DELOITTE HASKINS & SELLS LLP
Chartered
Accountants
(Firm's
Registration No. 117366W/W-100018)

Sanjiv
V. Pilgaonkar
Partner
(Membership
No.039826)
UDIN:23039826BGXSAN1912
|

|
Infosys
Limited
Regd.
office: Electronics City, Hosur Road,
Bengaluru
– 560 100, India
|
CIN
: L85110KA1981PLC013115
Website:
www.infosys.com
email:
investors@infosys.com
T:
91 80 2852 0261, F: 91 80 2852 0362
|
Statement of Consolidated Audited Results of Infosys
Limited and its subsidiaries for the quarter ended June 30, 2023 prepared in compliance with the Indian
Accounting Standards (Ind-AS)
(in crore, except per
equity share data)
|
Particulars
|
Quarter
ended
June 30,
|
Quarter
ended
March 31,
|
Quarter
ended
June 30,
|
Year ended
March 31,
|
| |
2023
|
2023
|
2022
|
2023
|
|
|
Audited
|
Audited
|
Audited
|
Audited
|
| Revenue from operations
|
37,933 |
37,441 |
34,470 |
146,767 |
| Other income, net |
561 |
671 |
676 |
2,701 |
| Total Income |
38,494
|
38,112 |
35,146 |
149,468 |
| Expenses |
|
|
|
|
| Employee
benefit expenses |
20,781 |
20,311 |
18,337 |
78,359 |
| Cost of
technical sub-contractors |
3,124 |
3,116 |
3,909 |
14,062 |
| Travel
expenses |
462 |
426 |
376 |
1,525 |
| Cost of
software packages and others |
2,720 |
2,886 |
2,420 |
10,902 |
|
Communication expenses |
182 |
171 |
170 |
713 |
| Consultancy
and professional charges |
346 |
387 |
456 |
1,684 |
| Depreciation
and amortisation expenses |
1,173 |
1,121 |
950 |
4,225 |
| Finance cost
|
90 |
82 |
56 |
284 |
| Other
expenses |
1,254 |
1,146 |
938 |
4,392 |
| Total expenses |
30,132
|
29,646 |
27,612 |
116,146 |
| Profit before tax |
8,362
|
8,466 |
7,534 |
33,322 |
| Tax expense: |
|
|
|
|
| Current tax
|
2,307 |
2,260 |
2,350 |
9,287 |
| Deferred tax
|
110 |
72 |
(178) |
(73) |
| Profit for the period |
5,945
|
6,134 |
5,362 |
24,108 |
| |
|
|
|
|
| Other comprehensive income
|
|
|
|
|
| |
|
|
|
|
| Items that will not be
reclassified subsequently to profit or loss |
|
|
|
|
|
Remeasurement of the net defined benefit liability/asset, net |
87 |
25 |
(86) |
8 |
| Equity
instruments through other comprehensive income, net |
1 |
(15) |
3 |
(7) |
| |
|
|
|
|
| Items that will be reclassified
subsequently to profit or loss |
|
|
|
|
| Fair value
changes on derivatives designated as cash flow hedges, net |
6 |
36 |
26 |
(7) |
| Exchange
differences on translation of foreign operations |
15 |
61 |
53 |
776 |
| Fair value
changes on investments, net |
75 |
42 |
(372) |
(256) |
| Total other comprehensive
income/(loss), net of tax |
184
|
149 |
(376) |
514 |
| |
|
|
|
|
| Total comprehensive income for
the period |
6,129
|
6,283 |
4,986 |
24,622 |
| |
|
|
|
|
| Profit attributable to:
|
|
|
|
|
| Owners of the company |
5,945 |
6,128 |
5,360 |
24,095 |
| Non-controlling interests |
–
|
6 |
2 |
13 |
| |
5,945
|
6,134 |
5,362 |
24,108 |
| |
|
|
|
|
| Total comprehensive income
attributable to: |
|
|
|
|
| Owners of the company |
6,132 |
6,276 |
4,986 |
24,598 |
| Non-controlling interests |
(3) |
7 |
– |
24 |
| |
6,129
|
6,283 |
4,986 |
24,622 |
| |
|
|
|
|
| Paid up share capital (par value
5/- each, fully paid) |
2,070 |
2,069 |
2,098 |
2,069 |
| Other equity *# |
73,338 |
73,338 |
73,252 |
73,338 |
| |
|
|
|
|
| Earnings per equity share (par
value 5/- each)** |
|
|
|
|
| Basic () |
14.37 |
14.79 |
12.78 |
57.63 |
|
Diluted () |
14.35 |
14.77 |
12.76 |
57.54 |
| * |
|
Balances for the quarter ended June 30, 2023 and June 30, 2022 represent
balances as per
the audited Balance Sheet for the year ended March 31, 2023 and March 31, 2022, respectively as required by
SEBI (Listing and Other Disclosure
Requirements) Regulations, 2015 |
| ** |
|
EPS is not annualized for the quarter ended June 30, 2023, quarter ended March
31, 2023
and quarter ended June 30, 2022 |
| # |
|
Excludes non-controlling interest |
|
1.
|
Notes
pertaining to the current quarter
|
| a) |
|
The audited interim condensed consolidated financial statements for the quarter
ended June
30, 2023 have been taken on record by the Board of Directors at its meeting held on July 20, 2023. The
statutory auditors, Deloitte
Haskins & Sells LLP have expressed an unmodified audit opinion thereon. The information presented
above is extracted from the
audited interim condensed consolidated financial statements. Those interim condensed consolidated financial
statements are prepared in
accordance with the Indian Accounting Standards (Ind-AS) as prescribed under Section 133 of the Companies Act,
2013 read with Rule 3
of the Companies (Indian Accounting Standards) Rules, 2015 and relevant amendment rules thereafter. |
Based on the
recommendation of the Nomination and Remuneration
Committee, the Board considered the appointment of Helene Auriol Potier (DIN - 10166891), as an Additional &
Independent Director
effective May 26, 2023 for a period of 3 (three) years and the same was approved by the shareholders at the Annual
General Meeting (AGM)
of the Company held on June 28, 2023.
| c) |
|
Update on employee stock grants |
The Board, on July 20,
2023, based on the recommendations
of the Nomination and Remuneration Committee, approved the grant of 23,780 one time RSUs to three eligible employees
under the 2015 plan
w.e.f August 1, 2023. These RSUs will vest equally over a period of four years.
Infosys Limited will
acquire Danske IT and Support
Services India Private Limited (“DIT”) which is Danske Bank’s IT center in India for an estimated
consideration of DKK
13.6 million (approximately 16 crore) subject to customary closing adjustments and conditions.
|
2.
|
Information
on dividends for the quarter ended June 30, 2023
|
For
financial year 2023, the Board recommended a final dividend of 17.50/- (par value of 5/-
each) per equity share. The same was approved by the shareholders in the Annual General Meeting (AGM) of the Company held on June
28, 2023 and paid on July 3, 2023.
(in )
|
Particulars
|
Quarter
ended
June 30,
|
Quarter
ended
March 31,
|
Quarter
ended
June 30,
|
Year ended
March 31,
|
|
|
2023
|
2023
|
2022
|
2023
|
| Dividend per share (par value
5/- each) |
|
|
|
|
| Interim
dividend |
–
|
– |
– |
16.50 |
|
Final dividend |
– |
17.50 |
–
|
17.50 |
|
3.
|
Segment
reporting (Consolidated - Audited)
|
(in crore)
|
Particulars
|
Quarter
ended
June 30,
|
Quarter
ended
March 31,
|
Quarter
ended
June 30,
|
Year ended
March 31,
|
|
|
2023
|
2023
|
2022
|
2023
|
| Revenue by business segment
|
|
|
|
|
| Financial Services (1)
|
10,661 |
10,818 |
10,562 |
43,763 |
| Retail (2) |
5,513 |
5,537 |
5,004 |
21,204 |
| Communication (3) |
4,441 |
4,411 |
4,464 |
18,086 |
| Energy, Utilities, Resources and
Services |
4,889 |
4,825 |
4,259 |
18,539 |
| Manufacturing |
5,350 |
5,078 |
4,172 |
19,035 |
| Hi-Tech |
3,056 |
2,989 |
2,812 |
11,867 |
| Life Sciences (4) |
2,749 |
2,681 |
2,257 |
10,085 |
| All other segments (5)
|
1,274 |
1,102 |
940 |
4,188 |
| Total |
37,933
|
37,441
|
34,470
|
146,767
|
| Less: Inter-segment revenue
|
–
|
– |
– |
– |
| Net revenue from operations
|
37,933
|
37,441 |
34,470 |
146,767 |
| Segment profit before tax,
depreciation and non-controlling interests: |
|
|
|
|
| Financial Services (1)
|
2,545 |
2,600 |
2,754 |
10,843 |
| Retail (2) |
1,629 |
1,634 |
1,538 |
6,396 |
| Communication (3) |
984 |
958 |
794 |
3,759 |
| Energy, Utilities , Resources and
Services |
1,290 |
1,302 |
1,145 |
5,155 |
| Manufacturing |
972 |
902 |
385 |
3,113 |
| Hi-Tech |
802 |
750 |
672 |
2,959 |
| Life Sciences (4) |
702 |
705 |
535 |
2,566 |
| All other segments (5)
|
140 |
147 |
41 |
339 |
| Total
|
9,064
|
8,998
|
7,864
|
35,130
|
| Less:
Other Unallocable expenditure |
1,173 |
1,121 |
950 |
4,225 |
| Add:
Unallocable other income |
561 |
671 |
676 |
2,701 |
| Less:
Finance cost |
90 |
82
|
56
|
284 |
|
Profit before tax and non-controlling interests
|
8,362
|
8,466
|
7,534
|
33,322
|
| (1) |
|
Financial Services include enterprises in Financial Services and Insurance
|
| (2) |
|
Retail includes enterprises in Retail, Consumer Packaged Goods and
Logistics |
| (3) |
|
Communication includes enterprises in Communication, Telecom OEM and Media
|
| (4) |
|
Life Sciences includes enterprises in Life sciences and Health care |
| (5) |
|
All other segments include operating segments of businesses in India, Japan,
China, Infosys
Public Services & other enterprises in Public Services |
Notes on segment information
Business segments
Based on the "management
approach" as required
by Ind-AS 108 - Operating Segments, the Chief Operating Decision Maker evaluates the Group's performance and
allocates resources based
on an analysis of various performance indicators by business segments. Accordingly, information has been presented
along these business
segments. The accounting principles used in the preparation of the financial statements are consistently applied to
record revenue and
expenditure in individual segments.
Segmental capital employed
Assets and liabilities used in the
Group's business
are not identified to any of the reportable segments, as these are used interchangeably between segments. The
Management believes that
it is currently not practicable to provide segment disclosures relating to total assets and liabilities since a
meaningful segregation
of the available data is onerous.
|
4.
|
Audited financial results of Infosys Limited
(Standalone Information)
|
(in crore)
|
Particulars
|
Quarter
ended
June 30,
|
Quarter
ended
March 31,
|
Quarter
ended
June 30,
|
Year ended
March 31,
|
|
|
2023
|
2023
|
2022
|
2023
|
| Revenue from
operations |
31,811 |
30,531 |
29,527 |
124,014 |
| Profit before
tax |
8,146 |
7,957 |
6,902 |
31,643 |
|
Profit for the period |
5,956 |
5,904 |
4,901 |
23,268 |
The
audited results of Infosys Limited for the above mentioned periods are available on our website, www.infosys.com
and on the Stock Exchange
website www.nseindia.com and www.bseindia.com. The information above has been extracted from the audited interim
standalone financial
statements as stated.
|
|
By
order of the Board
for
Infosys Limited
|
|
|
|
|
Bengaluru,
India
July 20, 2023
|
Salil
Parekh
Chief
Executive Officer and Managing Director
|
The
Board has also taken on record the consolidated results of Infosys Limited and its subsidiaries for the quarter
ended June
30, 2023, prepared as per International Financial Reporting Standards (IFRS) and reported in US dollars. A
summary of the financial statements
is as follows:
(in US$ million, except per equity
share data)
|
Particulars
|
Quarter
ended
June 30,
|
Quarter
ended
March 31,
|
Quarter
ended
June 30,
|
Year ended
March 31,
|
| |
2023
|
2023
|
2022
|
2023
|
|
|
Audited
|
Audited
|
Audited
|
Audited
|
| Revenues |
4,617 |
4,554 |
4,444 |
18,212 |
| Cost of sales
|
3,211 |
3,164
|
3,144
|
12,709 |
| Gross profit |
1,406
|
1,390 |
1,300 |
5,503 |
| Operating
expenses |
445 |
433
|
412
|
1,678
|
| Operating profit |
961
|
957 |
888 |
3,825 |
| Other income,
net |
68 |
82
|
87
|
335
|
| Finance cost
|
11 |
10
|
7
|
35
|
| Profit before income taxes
|
1,018
|
1,029 |
968 |
4,125 |
| Income tax
expense |
294 |
284
|
279 |
1,142 |
| Net profit |
724
|
745 |
689 |
2,983 |
| Earnings per equity share * |
|
|
|
|
| Basic |
0.17 |
0.18 |
0.16 |
0.71 |
| Diluted |
0.17 |
0.18 |
0.16 |
0.71 |
| Total assets
|
16,007 |
15,312 |
15,193 |
15,312 |
|
Cash and cash equivalents and current investments |
2,176 |
2,322 |
2,798 |
2,322 |
| * |
|
EPS is not annualized for the quarter ended June 30, 2023, quarter ended March
31, 2023
and quarter ended June 30, 2022. |
Certain statements in this release
concerning our future
growth prospects, or our future financial or operating performance are forward-looking statements intended to
qualify for the 'safe harbor'
under the Private Securities Litigation Reform Act of 1995, which involve a number of risks and uncertainties that
could cause actual
results or outcomes to differ materially from those in such forward-looking statements. The risks and uncertainties
relating to these
statements include, but are not limited to, risks and uncertainties regarding the execution of our business
strategy, our ability to attract
and retain personnel, our transition to hybrid work model, economic uncertainties, technological innovations such as
Generative AI, the
complex and evolving regulatory landscape including immigration regulation changes, our ESG vision, our capital
allocation policy and
expectations concerning our market position, future operations, margins, profitability, liquidity, capital
resources, and our corporate
actions including acquisitions. Important factors that may cause actual results or outcomes to differ from those
implied by the forward-looking
statements are discussed in more detail in our US Securities and Exchange Commission filings including our Annual
Report on Form 20-F
for the fiscal year ended March 31, 2023. These filings are available at www.sec.gov. Infosys may, from time to
time, make additional
written and oral forward-looking statements, including statements contained in the Company's filings with the
Securities and Exchange
Commission and our reports to shareholders. The Company does not undertake to update any forward-looking statements
that may be made from
time to time by or on behalf of the Company unless it is required by law.
|
|
Infosys
Limited
Regd.
office: Electronics City, Hosur Road,
Bengaluru
– 560 100, India
|
CIN
: L85110KA1981PLC013115
Website:
www.infosys.com
email:
investors@infosys.com
T:
91 80 2852 0261, F: 91 80 2852 0362
|
Statement of Audited results of
Infosys Limited for
the quarter ended June 30, 2023 prepared in compliance with the Indian Accounting Standards (Ind-AS)
(in crore, except per
equity share data)
|
Particulars
|
Quarter
ended
June 30,
|
Quarter
ended
March 31,
|
Quarter
ended
June 30,
|
Year ended
March 31,
|
| |
2023
|
2023
|
2022
|
2023
|
| |
Audited
|
Audited
|
Audited
|
Audited
|
| Revenue from
operations |
31,811 |
30,531 |
29,527 |
124,014 |
| Other income,
net |
1,001 |
766 |
648 |
3,859 |
| Total
income |
32,812
|
31,297
|
30,175
|
127,873
|
|
Expenses
|
|
|
|
|
|
Employee benefit expenses |
16,353 |
15,581 |
14,914 |
62,764 |
|
Cost of technical sub-contractors |
4,676 |
4,551 |
5,011 |
19,096 |
|
Travel expenses |
359 |
335 |
314 |
1,227 |
|
Cost of software packages and others |
1,174 |
875 |
1,183 |
5,214 |
|
Communication expenses |
129 |
117 |
119 |
502 |
|
Consultancy and professional charges |
215 |
261 |
363 |
1,236 |
|
Depreciation and amortisation expense |
746 |
714 |
643 |
2,753 |
|
Finance cost |
43 |
43
|
34
|
157 |
|
Other expenses |
971 |
863 |
692 |
3,281 |
| Total
expenses |
24,666
|
23,340
|
23,273
|
96,230
|
| Profit
before tax |
8,146
|
7,957
|
6,902
|
31,643
|
| Tax expense:
|
|
|
|
|
|
Current tax |
2,065 |
1,906 |
2,032 |
8,167 |
|
Deferred tax |
125 |
147 |
(31) |
208 |
| Profit for
the period |
5,956
|
5,904
|
4,901
|
23,268
|
| Other
comprehensive income |
|
|
|
|
| Items that
will not be reclassified subsequently to profit or loss |
|
|
|
|
|
Remeasurement of the net defined benefit liability / asset, net |
87 |
10
|
(96) |
(19) |
|
Equity instruments through other comprehensive income, net |
1 |
(14) |
3
|
(6) |
| Items that
will be reclassified subsequently to profit or loss |
|
|
|
|
|
Fair value changes on derivatives designated as cash flow hedges, net |
6 |
36
|
26
|
(7) |
|
Fair value changes on investments, net |
68 |
38
|
(344) |
(236) |
| |
|
|
|
|
| Total
other comprehensive income/ (loss), net of tax |
162
|
70
|
(411)
|
(268)
|
| |
|
|
|
|
| Total
comprehensive income for the period |
6,118
|
5,974
|
4,490
|
23,000
|
| |
|
|
|
|
| Paid-up share
capital (par value 5/- each fully paid) |
2,075 |
2,074 |
2,104 |
2,074 |
| Other Equity*
|
65,671 |
65,671 |
67,203 |
65,671 |
| Earnings
per equity share ( par value 5 /- each)** |
|
|
|
|
|
Basic () |
14.36 |
14.20
|
11.65 |
55.48 |
|
Diluted () |
14.34 |
14.19 |
11.64 |
55.42 |
| * |
|
Balances for the quarter ended June 30, 2023 and June 30, 2022 represent
balances as per
the audited Balance Sheet for the year ended March 31, 2023 and March 31, 2022 , respectively as required by
SEBI (Listing and Other
Disclosure Requirements) Regulations, 2015 |
| ** |
|
EPS is not annualized for the quarter ended June 30, 2023, quarter ended March
31, 2023
and quarter ended June 30, 2022. |
|
1.
|
Notes
pertaining to the current quarter
|
|
a)
|
The audited interim condensed standalone financial
statements for the quarter
ended June 30, 2023 have been taken on record by the Board of Directors at its meeting held on July 20, 2023.
The statutory auditors,
Deloitte Haskins & Sells LLP have expressed an unmodified audit opinion thereon. The information
presented above is extracted
from the audited interim condensed standalone financial statements. Those interim condensed standalone
financial statements are prepared
in accordance with the Indian Accounting Standards (Ind-AS) as prescribed under Section 133 of the Companies
Act, 2013 read with Rule
3 of the Companies (Indian Accounting Standards) Rules, 2015 and relevant amendment rules thereafter.
|
Based
on the recommendation of the Nomination and Remuneration Committee, the Board considered the appointment of Helene
Auriol Potier (DIN
- 10166891), as an Additional & Independent Director effective May 26, 2023 for a period of 3 (three) years
and the same was approved
by the shareholders at the Annual General Meeting (AGM) of the Company held on June 28, 2023.
|
c)
|
Update on employee stock grants
|
The
Board, on July
20, 2023, based on the recommendations of the Nomination and Remuneration Committee, approved the grant of 23,780
one time RSUs to three
eligible employees under the 2015 plan w.e.f August 1, 2023. These RSUs will vest equally over a period of four
years.
Infosys
Limited will acquire Danske IT and Support Services India Private Limited (“DIT”) which is Danske
Bank’s IT center
in India for an estimated consideration of DKK 13.6 million (approximately 16 crore) subject to customary
closing adjustments
and conditions.
|
2.
|
Information
on dividends for the quarter ended June 30, 2023
|
For
financial year 2023, the Board recommended a final dividend of 17.50/- (par value of 5/- each) per
equity share. The same
was approved by the shareholders in the Annual General Meeting (AGM) of the Company held on June 28, 2023 and paid
on July 3, 2023.
(in
)
|
Particulars
|
Quarter
ended
June 30, |
Quarter
ended
March 31,
|
Quarter
ended
June 30,
|
Year ended
March 31,
|
|
|
2023
|
2023
|
2022
|
2023
|
| Dividend
per share (par value 5/- each) |
|
|
|
|
| Interim
dividend |
–
|
–
|
–
|
16.50 |
|
Final dividend |
–
|
17.50 |
–
|
17.50 |
The Company publishes standalone
financial statements
along with the consolidated financial statements. In accordance with Ind AS 108, Operating Segments, the Company has
disclosed the segment
information in the audited interim consolidated financial statements. Accordingly, the segment information is given
in the audited consolidated
financial results of Infosys Limited and its subsidiaries for the quarter ended June 30, 2023.
|
|
By
order of the Board
for
Infosys Limited
|
|
|
|
|
Bengaluru,
India
July
20, 2023
|
Salil
Parekh
Chief
Executive Officer and Managing Director
|
Certain statements in this release concerning our future
growth prospects,
or our future financial or operating performance are forward-looking statements intended to qualify for the 'safe
harbor' under the Private
Securities Litigation Reform Act of 1995, which involve a number of risks and uncertainties that could cause
actual results or outcomes
to differ materially from those in such forward-looking statements. The risks and uncertainties relating to these
statements include,
but are not limited to, risks and uncertainties regarding the execution of our business strategy, our ability to
attract and retain personnel,
our transition to hybrid work model, economic uncertainties, technological innovations such as Generative AI, the
complex and evolving
regulatory landscape including immigration regulation changes, our ESG vision, our capital allocation policy and
expectations concerning
our market position, future operations, margins, profitability, liquidity, capital resources, and our corporate
actions including acquisitions.
Important factors that may cause actual results or outcomes to differ from those implied by the forward-looking
statements are discussed
in more detail in our US Securities and Exchange Commission filings including our Annual Report on Form 20-F for
the fiscal year ended
March 31, 2023. These filings are available at www.sec.gov. Infosys may, from time to time, make additional
written and oral forward-looking
statements, including statements contained in the Company's filings with the Securities and Exchange Commission
and our reports to shareholders.
The Company does not undertake to update any forward-looking statements that may be made from time to time by or
on behalf of the Company
unless it is required by law.
|
|
Infosys
Limited
Regd.
office: Electronics City, Hosur Road,
Bengaluru
– 560 100, India
|
CIN
: L85110KA1981PLC013115
Website:
www.infosys.com
email:
investors@infosys.com
T:
91 80 2852 0261, F: 91 80 2852 0362
|
Extract of Consolidated
Audited Financial Results
of Infosys Limited and its subsidiaries for the quarter ended June 30, 2023 prepared in compliance with the Indian
Accounting Standards
(Ind-AS)
(
in crore, except per equity share data)
|
Particulars
|
Quarter
ended
June 30, |
Year
ended
March 31,
|
Quarter
ended
June 30,
|
|
|
2023
|
2023
|
2022
|
| Revenue
from operations |
37,933
|
146,767
|
34,470
|
| Profit
before tax |
8,362 |
33,322 |
7,534
|
| Profit for the period |
5,945 |
24,108 |
5,362 |
|
Total comprehensive income for the period (comprising profit for the period after tax and other comprehensive
income after tax) |
6,129 |
24,622 |
4,986 |
| |
|
|
|
| Profit
attributable to: |
|
|
|
| Owners of
the company |
5,945 |
24,095 |
5,360
|
|
Non-controlling interests |
–
|
13
|
2
|
|
|
5,945
|
24,108
|
5,362
|
|
|
|
|
|
| Total
comprehensive income attributable to: |
|
|
|
| Owners of
the company |
6,132 |
24,598 |
4,986
|
|
Non-controlling interest |
(3) |
24
|
–
|
|
|
6,129
|
24,622
|
4,986
|
| |
|
|
|
| Paid-up share capital (par value
5/- each fully paid) |
2,070 |
2,069
|
2,098
|
| Other
equity *# |
73,338 |
73,338 |
73,252 |
|
Earnings per share (par value 5/- each)**
|
|
|
|
|
Basic () |
14.37 |
57.63
|
12.78
|
|
Diluted () |
14.35 |
57.54 |
12.76 |
| * |
|
Balances for the quarter ended June 30, 2023 and June 30, 2022 represent
balances as per
the audited Balance Sheet for the year ended March 31, 2023 and March 31, 2022, respectively as required by
SEBI (Listing and Other Disclosure
Requirements) Regulations, 2015 |
| ** |
|
EPS is not annualized for the quarter ended June 30, 2023 and quarter ended
June 30, 2022 |
| # |
|
Excludes non-controlling interest |
|
1.
|
Notes
pertaining to the current quarter
|
|
a)
|
The audited interim condensed consolidated financial
statements for the
quarter ended June 30, 2023 have been taken on record by the Board of Directors at its meeting held on July
20, 2023. The statutory
auditors, Deloitte Haskins & Sells LLP have expressed an unmodified audit opinion thereon. The
information presented above is
extracted from the audited interim condensed consolidated financial statements. Those interim condensed
consolidated financial statements
are prepared in accordance with the Indian Accounting Standards (Ind-AS) as prescribed under Section 133 of
the Companies Act, 2013 read
with Rule 3 of the Companies (Indian Accounting Standards) Rules, 2015 and relevant amendment rules
thereafter.
|
Based on the recommendation of the Nomination and
Remuneration Committee,
the Board considered the appointment of Helene Auriol Potier (DIN - 10166891), as an Additional & Independent
Director effective May
26, 2023 for a period of 3 (three) years and the same was approved by the shareholders at the Annual General
Meeting (AGM) of the Company
held on June 28, 2023.
|
c)
|
Update on employee stock grants
|
The Board, on July 20,
2023, based on the recommendations of the Nomination
and Remuneration Committee, approved the grant of 23,780 one time RSUs to three eligible employees under the 2015
plan w.e.f August 1,
2023. These RSUs will vest equally over a period of four years
Infosys
Limited will acquire Danske IT and Support Services India Private Limited (“DIT”) which is Danske Bank’s IT center
in India for an estimated consideration of DKK 13.6 million (approximately 16
crore) subject to customary closing adjustments and conditions.
|
2.
|
Information
on dividends for the quarter ended June 30, 2023
|
For
financial year 2023, the Board recommended a final dividend of 17.50/- (par value of 5/- each) per
equity share. The same
was approved by the shareholders in the Annual General Meeting (AGM) of the Company held on June 28, 2023 and paid
on July 3, 2023.
(in )
|
Particulars
|
Quarter
ended
June 30, |
Year
ended
March 31,
|
Quarter
ended
June 30,
|
|
|
2023
|
2023
|
2022
|
| Dividend
per share (par value 5/- each) |
|
|
|
| Interim
dividend |
–
|
16.50 |
– |
| Final
dividend |
–
|
17.50 |
– |
|
3.
|
Audited
financial results of Infosys Limited (Standalone information)
|
(in
crore)
|
Particulars
|
Quarter
ended
June 30, |
Year
ended
March 31,
|
Quarter
ended
June 30,
|
|
|
2023
|
2023
|
2022
|
| Revenue from operations |
31,811 |
124,014 |
29,527 |
| Profit before tax |
8,146 |
31,643 |
6,902 |
|
Profit for the period |
5,956 |
23,268 |
4,901 |
The
above is an extract of the detailed format of Quarterly audited financial results filed with Stock Exchanges
under Regulation 33 of the
SEBI (Listing and Other Disclosure Requirements) Regulations, 2015. The full format of the Quarterly Audited
Financial Results are available
on the Stock Exchange websites, www.nseindia.com and www.bseindia.com, and on the Company's website,
www.infosys.com.
|
|
By
order of the Board
for
Infosys Limited
|
|
|
|
|
Bengaluru,
India
July
20, 2023
|
Salil
Parekh
Chief
Executive Officer and Managing Director
|
Certain statements in this release concerning our future growth prospects, or our future financial or operating performance are forward-looking
statements intended to qualify for the 'safe harbor' under the Private Securities Litigation Reform Act of 1995, which involve a number
of risks and uncertainties that could cause actual results or outcomes to differ materially from those in such forward-looking statements.
The risks and uncertainties relating to these statements include, but are not limited to, risks and uncertainties regarding the execution
of our business strategy, our ability to attract and retain personnel, our transition to hybrid work model, economic uncertainties, technological
innovations such as Generative AI, the complex and evolving regulatory landscape including immigration regulation changes, our ESG vision,
our capital allocation policy and expectations concerning our market position, future operations, margins, profitability, liquidity, capital
resources, and our corporate actions including acquisitions. Important factors that may cause actual results or outcomes to differ from
those implied by the forward-looking statements are discussed in more detail in our US Securities and Exchange Commission filings including
our Annual Report on Form 20-F for the fiscal year ended March 31, 2023. These filings are available at www.sec.gov. Infosys may, from
time to time, make additional written and oral forward-looking statements, including statements contained in the Company's filings with
the Securities and Exchange Commission and our reports to shareholders. The Company does not undertake to update any forward-looking statements
that may be made from time to time by or on behalf of the Company unless it is required by law.
Exhibit 99.7
IFRS USD Earning Release
INDEPENDENT AUDITOR'S REPORT
TO THE BOARD OF DIRECTORS OF INFOSYS
LIMITED
Report on the Audit of the Interim Condensed
Consolidated Financial Statements
Opinion
We have audited the accompanying interim condensed
consolidated financial statements of INFOSYS LIMITED (the “Company”) and its subsidiaries (the Company and its subsidiaries
together referred to as the “Group”), which comprise the Condensed Consolidated Balance Sheet as at June 30, 2023, the Condensed
Consolidated Statement of Comprehensive Income, the Condensed Consolidated Statement of Changes in Equity and the Condensed Consolidated
Statement of Cash Flows for the three months ended on that date, and a summary of the significant accounting policies and other explanatory
information (hereinafter referred to as the “interim condensed consolidated financial statements”).
In our opinion and to the best of our information
and according to the explanations given to us, the aforesaid interim condensed consolidated financial statements give a true and fair
view in conformity with International Accounting Standard 34 “Interim Financial Reporting” (“IAS 34”) as issued
by the International Accounting Standards Board (“IASB”), of the consolidated state of affairs of the Group as at June 30,
2023, and their consolidated profit, their consolidated total comprehensive income, their consolidated changes in equity and their consolidated
cash flows for the three months ended on that date.
Basis for Opinion
We conducted our audit of the interim condensed
consolidated financial statements in accordance with the Standards on Auditing (“SA”s) issued by the Institute of Chartered
Accountants of India (“ICAI”). Our responsibilities under those Standards are further described in the Auditor’s Responsibilities
for the Audit of the Interim Condensed Consolidated Financial Statements section of our report. We are independent of the Group in accordance
with the Code of Ethics issued by the ICAI, and we have fulfilled our other ethical responsibilities in accordance with the Code of Ethics.
We believe that the audit evidence obtained by us is sufficient and appropriate to provide a basis for our audit opinion on the interim
condensed consolidated financial statements.
Responsibilities of Management and Those
Charged with Governance for the Interim Condensed Consolidated Financial Statements
The Company’s Board of Directors is responsible
for the preparation and presentation of these interim condensed consolidated financial statements that give a true and fair view of the
consolidated financial position, consolidated financial performance, consolidated total comprehensive income, consolidated changes in
equity and consolidated cash flows of the Group in accordance with IAS 34 as issued by the IASB. The respective Boards of Directors of
the companies included in the Group are responsible for maintenance of the adequate accounting records for safeguarding assets of the
Group and for preventing and detecting frauds and other irregularities; selection and application of appropriate accounting policies;
making judgments and estimates that are reasonable and prudent; and design, implementation and maintenance of adequate internal financial
controls, that were operating effectively for ensuring the accuracy and completeness of the accounting records, relevant to the preparation
and presentation of the interim condensed consolidated financial statements that give a true and fair view and are free from material
misstatement, whether due to fraud or error which have been used for the purpose of preparation of the interim condensed consolidated
financial statements by the Directors of the Company, as aforesaid.
In preparing the interim condensed consolidated
financial statements, the respective Boards of Directors of the companies included in the Group are responsible for assessing the ability
of the respective entities to continue as a going concern, disclosing, as applicable, matters related to going concern and using the going
concern basis of accounting unless the respective Boards of Directors either intend to liquidate their respective entities or to cease
operations, or has no realistic alternative but to do so.
The respective Boards of Directors of the companies
included in the Group are responsible for overseeing the financial reporting process of the Group.
Auditor’s Responsibilities for the
Audit of the Interim Condensed Consolidated Financial Statements
Our objectives are to obtain reasonable assurance
about whether the interim condensed consolidated financial statements as a whole are free from material misstatement, whether due to fraud
or error, and to issue an auditor’s report that includes our opinion. Reasonable assurance is a high level of assurance, but is
not a guarantee that an audit conducted in accordance with SAs will always detect a material misstatement when it exists. Misstatements
can arise from fraud or error and are considered material if, individually or in the aggregate, they could reasonably be expected to influence
the economic decisions of users taken on the basis of these interim condensed consolidated financial statements.
As part of an audit in accordance with SAs, we
exercise professional judgment and maintain professional scepticism throughout the audit. We also:
| · | Identify and assess the risks of material misstatement of the interim condensed consolidated financial
statements, whether due to fraud or error, design and perform audit procedures responsive to those risks, and obtain audit evidence that
is sufficient and appropriate to provide a basis for our opinion. The risk of not detecting a material misstatement resulting from fraud
is higher than for one resulting from error, as fraud may involve collusion, forgery, intentional omissions, misrepresentations, or the
override of internal control. |
| · | Obtain an understanding of internal financial controls relevant to the audit in order to design audit
procedures that are appropriate in the circumstances, but not for the purpose of expressing an opinion on effectiveness of such controls. |
| · | Evaluate the appropriateness of accounting policies used and the reasonableness of accounting estimates
and related disclosures made by management. |
| · | Conclude on the appropriateness of management’s use of the going concern basis of accounting and,
based on the audit evidence obtained, whether a material uncertainty exists related to events or conditions that may cast significant
doubt on the ability of the Group to continue as a going concern. If we conclude that a material uncertainty exists, we are required to
draw attention in our auditor’s report to the related disclosures in the interim condensed consolidated financial statements or,
if such disclosures are inadequate, to modify our opinion. Our conclusions are based on the audit evidence obtained up to the date of
our auditor’s report. However, future events or conditions may cause the Group to cease to continue as a going concern. |
| · | Evaluate the overall presentation, structure and content of the interim condensed consolidated financial
statements, including the disclosures, and whether the interim condensed consolidated financial statements represent the underlying transactions
and events in a manner that achieves fair presentation. |
| · | Obtain sufficient appropriate audit evidence regarding the financial information of the entities within
the Group to express an opinion on the interim condensed consolidated financial statements. We are responsible for the direction, supervision
and performance of the audit of the financial statements of such entities included in the interim condensed consolidated financial statements
of which we are the independent auditors. |
Materiality is the magnitude of misstatements in
the interim condensed consolidated financial statements that, individually or in aggregate, makes it probable that the economic decisions
of a reasonably knowledgeable user of the interim condensed consolidated financial statements may be influenced. We consider quantitative
materiality and qualitative factors in (i) planning the scope of our audit work and in evaluating the results of our work; and (ii) to
evaluate the effect of any identified misstatements in the interim condensed consolidated financial statements.
We communicate with those charged with governance
of the Company and such other entities included in the interim condensed consolidated financial statements of which we are the independent
auditors regarding, among other matters, the planned scope and timing of the audit and significant audit findings including any significant
deficiencies in internal control that we identify during our audit.
We also provide those charged with governance with
a statement that we have complied with relevant ethical requirements regarding independence, and to communicate with them all relationships
and other matters that may reasonably be thought to bear on our independence, and where applicable, related safeguards.
|
Place: Bengaluru
Date: July 20, 2023 |
For DELOITTE HASKINS & SELLS LLP
Chartered Accountants
(Firm's Registration No. 117366W/W-100018)
Sanjiv V. Pilgaonkar
Partner
(Membership No.039826)
UDIN:23039826BGXSAQ2034 |
INFOSYS LIMITED AND SUBSIDIARIES
Condensed Consolidated Financial Statements
under International Financial Reporting Standards (IFRS) in US dollars for the three months ended June 30, 2023
| Index |
| Condensed Consolidated Balance Sheet |
| Condensed Consolidated Statement of Comprehensive Income |
| Condensed Consolidated Statement of Changes in Equity |
| Condensed Consolidated Statement of Cash Flows |
| Overview and Notes to the Interim Condensed Consolidated Financial Statements |
| 1. Overview |
| 1.1 Company overview |
| 1.2 Basis of preparation of financial statements |
| 1.3 Basis of consolidation |
| 1.4 Use of estimates and judgments |
| 1.5 Critical accounting estimates and judgments |
| 1.6 Recent accounting pronouncements |
| |
| 2. Notes to the Interim Condensed Consolidated Financial Statements |
| 2.1 Cash and cash equivalents |
| 2.2 Earmarked bank balance for dividend |
| 2.3 Investments |
| 2.4 Financial instruments |
| 2.5 Prepayments and other assets |
| 2.6 Other liabilities |
| 2.7 Provisions and other contingencies |
| 2.8 Property, plant and equipment |
| 2.9 Leases |
| 2.10 Goodwill and Intangible assets |
| 2.11 Business combinations |
| 2.12 Employees' Stock Option Plans (ESOP) |
| 2.13 Income Taxes |
| 2.14 Basic and diluted shares used in computing earnings per equity share |
| 2.15 Related party transactions |
| 2.16 Segment reporting |
| 2.17 Revenue from Operations |
| 2.18 Unbilled Revenue |
| 2.19 Equity |
| 2.20 Break-up of expenses and other income, net |
Infosys Limited and subsidiaries
(Dollars in millions except equity share data)
| Condensed Consolidated Balance Sheet as at |
Note |
June 30, 2023 |
March 31, 2023 |
| ASSETS |
|
|
|
| Current assets |
|
|
|
| Cash and cash equivalents |
2.1 |
1,501 |
1,481 |
| Earmarked bank balance for dividend |
2.2 |
885 |
– |
| Current investments |
2.3 |
675 |
841 |
| Trade receivables |
|
3,191 |
3,094 |
| Unbilled revenue |
2.18 |
1,783 |
1,861 |
| Prepayments and other current assets |
2.5 |
1,386 |
1,336 |
| Income tax assets |
2.13 |
1 |
1 |
| Derivative financial instruments |
2.4 |
21 |
12 |
| Total current assets |
|
9,443 |
8,626 |
| Non-current assets |
|
|
|
| Property, plant and equipment |
2.8 |
1,638 |
1,679 |
| Right-of-use assets |
2.9 |
859 |
837 |
| Goodwill |
2.10 |
882 |
882 |
| Intangible assets |
|
200 |
213 |
| Non-current investments |
2.3 |
1,462 |
1,530 |
| Unbilled revenue |
2.18 |
168 |
176 |
| Deferred income tax assets |
2.13 |
125 |
152 |
| Income tax assets |
2.13 |
844 |
785 |
| Other non-current assets |
2.5 |
386 |
432 |
| Total non-current assets |
|
6,564 |
6,686 |
| Total assets |
|
16,007 |
15,312 |
| LIABILITIES AND EQUITY |
|
|
|
| Current liabilities |
|
|
|
| Trade payables |
|
458 |
470 |
| Lease liabilities |
2.9 |
222 |
151 |
| Derivative financial instruments |
2.4 |
6 |
10 |
| Current income tax liabilities |
2.13 |
583 |
412 |
| Unearned revenue |
|
894 |
872 |
| Employee benefit obligations |
|
310 |
292 |
| Provisions |
2.7 |
187 |
159 |
| Other current liabilities |
2.6 |
3,007 |
2,403 |
| Total current liabilities |
|
5,667 |
4,769 |
| Non-current liabilities |
|
|
|
| Lease liabilities |
2.9 |
812 |
859 |
| Deferred income tax liabilities |
2.13 |
136 |
149 |
| Employee benefit obligations |
|
10 |
10 |
| Other non-current liabilities |
2.6 |
261 |
301 |
| Total non-current liabilities |
|
1,219 |
1,319 |
| Total liabilities |
|
6,886 |
6,088 |
| Equity |
|
|
|
| Share capital - 5 ($0.16) par value 4,800,000,000 (4,800,000,000) equity shares authorized, issued and outstanding 4,138,454,008 (4,136,387,925) equity shares fully paid up, net of 11,738,357 (12,172,119) treasury shares as at June 30, 2023 (March 31, 2023) |
2.19 |
325 |
325 |
| Share premium |
|
383 |
366 |
| Retained earnings |
|
11,175 |
11,401 |
| Cash flow hedge reserves |
|
1 |
– |
| Other reserves |
|
1,439 |
1,370 |
| Capital redemption reserve |
|
24 |
24 |
| Other components of equity |
|
(4,278) |
(4,314) |
| Total equity attributable to equity holders of the Company |
|
9,069 |
9,172 |
| Non-controlling interests |
|
52 |
52 |
| Total equity |
|
9,121 |
9,224 |
| Total liabilities and equity |
|
16,007 |
15,312 |
The accompanying notes form an integral part of the
interim condensed consolidated financial statements.
As per our report of even date attached
| |
| for Deloitte Haskins & Sells LLP |
for and on behalf of the Board of Directors of Infosys Limited |
| Chartered Accountants |
|
| Firm's Registration No: |
|
117366W/W-100018
|
|
|
Sanjiv V. Pilgaonkar
Partner
Membership No. 039826 |
Nandan M. Nilekani
Chairman |
Salil Parekh
Chief Executive Officer and Managing Director |
Bobby Parikh
Director |
| |
|
|
|
|
Bengaluru
July 20, 2023 |
Nilanjan Roy
Chief Financial Officer |
Jayesh Sanghrajka
Executive Vice President and Deputy Chief Financial Officer |
A.G.S. Manikantha
Company Secretary |
(Dollars in millions except equity share and per equity
share data)
| Condensed Consolidated Statement of Comprehensive Income for the |
Note |
Three months ended |
| |
|
June 30, 2023 |
June 30, 2022 |
| Revenues |
2.17 |
4,617 |
4,444 |
| Cost of sales |
2.20 |
3,211 |
3,144 |
| Gross profit |
|
1,406 |
1,300 |
| Operating expenses: |
|
|
|
| Selling and marketing expenses |
2.20 |
217 |
193 |
| Administrative expenses |
2.20 |
228 |
219 |
| Total operating expenses |
|
445 |
412 |
| Operating profit |
|
961 |
888 |
| Other income, net |
2.20 |
68 |
87 |
| Finance cost |
|
11 |
7 |
| Profit before income taxes |
|
1,018 |
968 |
| Income tax expense |
2.13 |
294 |
279 |
| Net profit |
|
724 |
689 |
| Other comprehensive income |
|
|
|
| Items that will not be reclassified subsequently to profit or loss |
|
|
|
| Remeasurement of the net defined benefit liability/asset, net |
|
10 |
(10) |
| Equity instruments through other comprehensive income, net |
|
– |
(1) |
| |
|
10 |
(11) |
| Items that will be reclassified subsequently to profit or loss |
|
|
|
| Fair value changes on investments, net |
|
9 |
(46) |
| Fair value changes on derivatives designated as cash flow hedge, net |
|
1 |
3 |
| Exchange differences on translation of foreign operations |
|
17 |
(400) |
| |
|
27 |
(443) |
| Total other comprehensive income/(loss), net of tax |
|
37 |
(454) |
| Total comprehensive income |
|
761 |
235 |
| Profit attributable to: |
|
|
|
| Owners of the Company |
|
724 |
689 |
| Non-controlling interests |
|
– |
– |
| |
|
724 |
689 |
| Total comprehensive income attributable to: |
|
|
|
| Owners of the Company |
|
761 |
235 |
| Non-controlling interests |
|
– |
– |
| |
|
761 |
235 |
| Earnings per equity share |
|
|
|
| Basic (in $ per share) |
|
0.17 |
0.16 |
| Diluted (in $ per share) |
|
0.17 |
0.16 |
| Weighted average equity shares used in computing earnings per equity share |
|
|
|
| Basic (in shares) |
2.14 |
4,137,234,750 |
4,193,747,653 |
| Diluted (in shares) |
2.14 |
4,142,207,951 |
4,199,491,985 |
The accompanying notes form an integral part of the
interim condensed consolidated financial statements.
As per our report of even date attached
| |
| for Deloitte Haskins & Sells LLP |
for and on behalf of the Board of Directors of Infosys Limited |
| Chartered Accountants |
|
| Firm's Registration No: |
|
117366W/W-100018
|
|
|
Sanjiv V. Pilgaonkar
Partner
Membership No. 039826 |
Nandan M. Nilekani
Chairman |
Salil Parekh
Chief Executive Officer and Managing Director |
Bobby Parikh
Director |
| |
|
|
|
|
Bengaluru
July 20, 2023 |
Nilanjan Roy
Chief Financial Officer |
Jayesh Sanghrajka
Executive Vice President and Deputy Chief Financial Officer |
A.G.S. Manikantha
Company Secretary |
Condensed Consolidated Statement of Changes in Equity
(Dollars in millions except equity share data)
| |
Number of Shares(1) |
Share capital |
Share premium |
Retained earnings |
Other reserves(2) |
Capital redemption reserve |
Cash flow hedge reserve |
Other components of equity |
Total equity attributable to equity holders of the Company |
Non-controlling interest |
Total equity |
| Balance as at April 1, 2022 |
4,193,012,929 |
328 |
337 |
11,672 |
1,170 |
21 |
1 |
(3,588) |
9,941 |
53 |
9,994 |
| Impact on adoption of amendment to IAS 37## |
– |
– |
– |
(2) |
– |
– |
– |
– |
(2) |
– |
(2) |
| |
4,193,012,929 |
328 |
337 |
11,670 |
1,170 |
21 |
1 |
(3,588) |
9,939 |
53 |
9,992 |
| Changes in equity for the three months ended June 30, 2022 |
|
|
|
|
|
|
|
|
|
|
|
| Net profit |
– |
– |
– |
689 |
– |
– |
– |
– |
689 |
– |
689 |
| Remeasurement of the net defined benefit liability/asset, net* |
– |
– |
– |
– |
– |
– |
– |
(10) |
(10) |
– |
(10) |
| Fair value changes on derivatives designated as Cash flow hedge, net* |
– |
– |
– |
– |
– |
– |
3 |
– |
3 |
– |
3 |
| Exchange differences on translation of foreign operations |
– |
– |
– |
– |
– |
– |
– |
(400) |
(400) |
– |
(400) |
| Equity instruments through other comprehensive income, net* |
– |
– |
– |
– |
– |
– |
– |
(1) |
(1) |
– |
(1) |
| Fair value changes on investments, net* |
– |
– |
– |
– |
– |
– |
– |
(46) |
(46) |
– |
(46) |
| Total comprehensive income for the period |
– |
– |
– |
689 |
– |
– |
3 |
(457) |
235 |
– |
235 |
| Shares issued on exercise of employee stock options (Refer to note 2.12) |
– |
– |
– |
– |
– |
– |
– |
– |
– |
– |
– |
| Buyback of equity shares (Refer to note 2.19)** |
– |
– |
– |
– |
– |
– |
– |
– |
– |
– |
– |
| Transaction cost relating to buyback* |
– |
– |
– |
– |
– |
– |
– |
– |
– |
– |
– |
| Amount transferred to capital redemption reserve upon buyback |
– |
– |
– |
– |
– |
– |
– |
– |
– |
– |
– |
| Employee stock compensation expense (Refer to note 2.12) |
– |
– |
17 |
– |
– |
– |
– |
– |
17 |
– |
17 |
| Income tax benefit arising on exercise of stock options |
– |
– |
2 |
– |
– |
– |
– |
– |
2 |
– |
2 |
| Transferred to other reserves |
– |
– |
– |
– |
– |
– |
– |
– |
– |
– |
– |
| Transferred from other reserves on utilization |
– |
– |
– |
37 |
(37) |
– |
– |
– |
– |
– |
– |
| Dividends paid to non controlling interest of subsidiary |
– |
– |
– |
– |
– |
– |
– |
– |
– |
(3) |
(3) |
| Dividends# |
– |
– |
– |
(856) |
– |
– |
– |
– |
(856) |
– |
(856) |
| Balance as at June 30, 2022 |
4,193,012,929 |
328 |
356 |
11,540 |
1,133 |
21 |
4 |
(4,045) |
9,337 |
50 |
9,387 |
| |
| |
Number of Shares(1) |
Share capital |
Share premium |
Retained earnings |
Other reserves(2) |
Capital redemption reserve |
Cash flow hedge reserve |
Other components of equity |
Total equity attributable to equity holders of the Company |
Non-controlling interest |
Total equity |
| Balance as at April 1, 2023 |
4,136,387,925 |
325 |
366 |
11,401 |
1,370 |
24 |
– |
(4,314) |
9,172 |
52 |
9,224 |
| Changes in equity for the three months ended June 30, 2023 |
|
|
|
|
|
|
|
|
|
|
|
| Net profit |
– |
– |
– |
724 |
– |
– |
– |
– |
724 |
– |
724 |
| Remeasurement of the net defined benefit liability/asset, net* |
– |
– |
– |
– |
– |
– |
– |
10 |
10 |
– |
10 |
| Equity instruments through other comprehensive income, net* |
– |
– |
– |
– |
– |
– |
– |
– |
– |
– |
– |
| Fair value changes on derivatives designated as cash flow hedge, net* |
– |
– |
– |
– |
– |
– |
1 |
– |
1 |
– |
1 |
| Exchange differences on translation of foreign operations |
– |
– |
– |
– |
– |
– |
– |
17 |
17 |
– |
17 |
| Fair value changes on investments, net* |
– |
– |
– |
– |
– |
– |
– |
9 |
9 |
– |
9 |
| Total comprehensive income for the period |
– |
– |
– |
724 |
– |
– |
1 |
36 |
761 |
– |
761 |
| Shares issued on exercise of employee stock options (Refer to note 2.12) |
2,066,083 |
– |
– |
– |
– |
– |
– |
– |
– |
– |
– |
| Transferred on account of options not exercised |
– |
– |
(1) |
1 |
– |
– |
– |
– |
– |
– |
– |
| Employee stock compensation expense (Refer to note 2.12) |
– |
– |
18 |
– |
– |
– |
– |
– |
18 |
– |
18 |
| Transferred to other reserves |
– |
– |
– |
(93) |
93 |
– |
– |
– |
– |
– |
– |
| Transferred from other reserves on utilization |
– |
– |
– |
24 |
(24) |
– |
– |
– |
– |
– |
– |
| Dividends# |
– |
– |
– |
(882) |
– |
– |
– |
– |
(882) |
– |
(882) |
| Balance as at June 30, 2023 |
4,138,454,008 |
325 |
383 |
11,175 |
1,439 |
24 |
1 |
(4,278) |
9,069 |
52 |
9,121 |
| ## | | Impact on account of adoption of amendment to IAS 37 Provisions, Contingent Liabilities
and Contingents Assets |
| (1) | | excludes treasury shares of 11,738,357 as at June 30, 2023, 12,172,119 as at April 1,
2023, 13,193,290 as at June 30, 2022 and 13,725,712 as at April 1, 2022 held by consolidated trust. |
| (2) | | Represents the Special Economic Zone Re-investment reserve created out of the profit of
the eligible SEZ unit in terms of the provisions of Sec 10AA(1)(ii) of Income Tax Act,1961. The reserve should be utilized by the Group
for acquiring new plant and machinery for the purpose of its business in terms of the provisions of the Sec 10AA(2) of the Income Tax
Act, 1961. |
The accompanying notes form an integral part of the
interim condensed consolidated financial statements.
As per our report of even date attached
| for Deloitte Haskins & Sells LLP |
for and on behalf of the Board of Directors of Infosys Limited |
| Chartered Accountants |
| Firm’s Registration No: |
117366W/ W-100018
|
|
Sanjiv V. Pilgaonkar
Partner
Membership No. 039826 |
Nandan M. Nilekani
Chairman |
Salil Parekh
Chief Executive Officer and Managing Director |
Bobby Parikh
Director |
| |
Nilanjan Roy
Chief Financial Officer |
Jayesh Sanghrajka
Executive Vice President and Deputy Chief Financial
Officer |
A.G.S. Manikantha
Company Secretary |
| Bengaluru |
|
| July 20, 2023 |
|
Condensed Consolidated Statement of Cash Flows
Accounting Policy
Cash flows are reported using the indirect method,
whereby profit for the period is adjusted for the effects of transactions of a non-cash nature, any deferrals or accruals of past or future
operating cash receipts or payments and items of income or expenses associated with investing or financing cash flows. The cash flows
from operating, investing and financing activities of the Group are segregated. The Group considers all highly liquid investments that
are readily convertible to known amounts of cash to be cash equivalents.
(Dollars in millions)
| Particulars |
Note |
Three months ended June 30, |
| |
|
2023 |
2022 |
| Operating activities: |
|
|
|
| Net Profit |
|
724 |
689 |
| Adjustments to reconcile net profit to net cash provided by operating activities: |
|
|
|
| Depreciation and amortization |
|
143 |
123 |
| Interest and dividend income |
|
(35) |
(36) |
| Finance cost |
|
11 |
7 |
| Income tax expense |
2.13 |
294 |
279 |
| Exchange differences on translation of assets and liabilities, net |
|
(1) |
10 |
| Impairment loss recognized/(reversed) under expected credit loss model |
|
11 |
6 |
| Stock compensation expense |
|
18 |
17 |
| Other adjustments |
|
67 |
17 |
| Changes in working capital |
|
|
|
| Trade receivables and unbilled revenue |
|
(13) |
(324) |
| Prepayments and other assets |
|
(19) |
(165) |
| Trade payables |
|
(13) |
(24) |
| Unearned revenue |
|
20 |
(1) |
| Other liabilities and provisions |
|
(241) |
317 |
| Cash generated from operations |
|
966 |
915 |
| Income taxes paid |
|
(168) |
(170) |
| Net cash generated by operating activities |
|
798 |
745 |
| Investing activities: |
|
|
|
| Expenditure on property, plant and equipment and intangibles |
|
(99) |
(89) |
| Deposits placed with Corporation |
|
(54) |
(28) |
| Redemption of deposits placed with Corporation |
|
31 |
3 |
| Interest and dividend received |
|
33 |
35 |
| Payment for acquisition of business, net of cash acquired |
|
– |
(29) |
| Payment of contingent consideration pertaining to acquisition of business |
|
– |
(8) |
| Payments to acquire Investments |
|
|
|
| Liquid mutual funds units |
|
(2,152) |
(2,663) |
| Certificates of deposit |
|
(156) |
(377) |
| Quoted debt securities |
|
(13) |
(200) |
| Commercial paper |
|
(190) |
(36) |
| Other investments |
|
– |
(1) |
| Proceeds on sale of investments |
|
|
|
| Quoted debt securities |
|
74 |
121 |
| Certificates of deposit |
|
484 |
281 |
| Commercial paper |
|
100 |
– |
| Liquid mutual funds units |
|
2,106 |
2,709 |
| Other receipts |
|
15 |
3 |
| Net cash used in investing activities |
|
179 |
(279) |
| Financing activities: |
|
|
|
| Payment of lease liabilities |
|
(54) |
(31) |
| Payment of dividends |
|
– |
(856) |
| Payment of dividends to non-controlling interests of subsidiary |
|
– |
(3) |
| Other payments |
|
(25) |
(15) |
| Other receipts |
|
– |
9 |
| Net cash used in financing activities |
|
(79) |
(896) |
| Net increase/(decrease) in cash and cash equivalents |
|
898 |
(430) |
| Effect of exchange rate changes on cash and cash equivalents |
|
7 |
(104) |
| Cash and cash equivalents at the beginning of the period |
2.1 |
1,481 |
2,305 |
| Cash and cash equivalents at the end of the period |
2.1 |
2,386 |
1,771 |
| Supplementary information: |
|
|
|
| Restricted cash balance |
2.1 |
47 |
53 |
| Closing cash and cash equivalents as per consolidated statement of cash flows |
|
2,386 |
1,771 |
| Less: Earmarked bank balance for dividend |
2.2 |
(885) |
– |
| Closing cash and cash equivalents as per Consolidated Balance Sheet |
2.1 |
1,501 |
1,771 |
The accompanying notes form an integral part of the
interim condensed consolidated financial statements.
As per our report of even date attached
| for Deloitte Haskins & Sells LLP |
for and on behalf of the Board of Directors of Infosys Limited |
| Chartered Accountants |
| Firm’s Registration No: |
117366W/ W-100018
|
|
Sanjiv V. Pilgaonkar
Partner
Membership No. 039826 |
Nandan M. Nilekani
Chairman |
Salil Parekh
Chief Executive Officer and Managing Director |
Bobby Parikh
Director |
| |
Nilanjan Roy
Chief Financial Officer |
Jayesh Sanghrajka
Executive Vice President and Deputy Chief Financial
Officer |
A.G.S. Manikantha
Company Secretary |
| Bengaluru |
|
| July 20, 2023 |
|
Overview and Notes to the Interim Condensed Consolidated
Financial Statements
1. Overview
1.1 Company overview
Infosys Limited ('the Company' or Infosys) provides
consulting, technology, outsourcing and next-generation digital services, to enable clients to execute strategies for their digital transformation.
Infosys strategic objective is to build a sustainable organization that remains relevant to the agenda of clients, while creating growth
opportunities for employees and generating profitable returns for investors. Infosys strategy is to be a navigator for our clients as
they ideate, plan and execute on their journey to a digital future.
Infosys together with its subsidiaries and controlled
trusts is herein after referred to as the "Group".
The company is a public limited company incorporated
and domiciled in India and has its registered office at Electronics city, Hosur Road, Bengaluru 560100, Karnataka, India. The company
has its primary listings on the BSE Ltd. and National Stock Exchange of India Limited. The company’s American Depositary Shares
(ADS) representing equity shares are listed on the New York Stock Exchange (NYSE).
The Group's interim condensed consolidated financial
statements are approved for issue by the company's Board of Directors on July 20, 2023.
1.2 Basis of preparation of financial statements
The interim condensed consolidated financial statements
have been prepared in compliance with IAS 34, Interim Financial Reporting as issued by International Accounting Standards Board ("IASB"),
under the historical cost convention on the accrual basis except for certain financial instruments which have been measured at fair values.
Accordingly, these interim condensed consolidated financial statements do not include all the information required for a complete set
of financial statements. These interim condensed consolidated financial statements should be read in conjunction with the consolidated
financial statements and related notes included in the company’s Annual Report on Form 20-F for the year ended March 31, 2023. Accounting
policies have been consistently applied except where a newly issued accounting standard is initially adopted or a revision to an existing
accounting standard requires a change in the accounting policy hitherto in use.
The material accounting policy information used in
preparation of the audited condensed consolidated interim financial statements have been discussed in the respective notes.
1.3 Basis of consolidation
Infosys consolidates entities which it owns or controls.
The interim condensed consolidated financial statements comprise the financial statements of the company, its controlled trusts and its
subsidiaries. Control exists when the parent has power over the entity, is exposed, or has rights to variable returns from its involvement
with the entity and has the ability to affect those returns by using its power over the entity. Power is demonstrated through existing
rights that give the ability to direct relevant activities, those which significantly affect the entity's returns. Subsidiaries are consolidated
from the date control commences until the date control ceases.
The financial statements of the Group companies are
consolidated on a line-by-line basis and intra-group balances and transactions including unrealized gain / loss from such transactions
are eliminated upon consolidation. The financial statements are prepared by applying uniform accounting policies in use at the Group.
Non-controlling interests which represent part of the net profit or loss and net assets of subsidiaries that are not, directly or indirectly,
owned or controlled by the company, are excluded.
1.4 Use of estimates and judgments
The preparation of the interim condensed consolidated
financial statements in conformity with IFRS requires Management to make estimates, judgments and assumptions. These estimates, judgments
and assumptions affect the application of accounting policies and the reported amounts of assets and liabilities, the disclosures of contingent
assets and liabilities at the date of the interim condensed consolidated financial statements and reported amounts of revenues and expenses
during the period. The application of accounting policies that require critical accounting estimates involving complex and subjective
judgments and the use of assumptions in these financial statements have been disclosed in Note 1.5. Accounting estimates could change
from period to period. Actual results could differ from those estimates. Appropriate changes in estimates are made as Management becomes
aware of changes in circumstances surrounding the estimates. Changes in estimates and judgements are reflected in the consolidated financial
statements in the period in which changes are made and, if material, their effects are disclosed in the notes to the interim condensed
consolidated financial statements.
1.5 Critical accounting estimates and judgments
a. Revenue recognition
The Group’s contracts with customers include
promises to transfer multiple products and services to a customer. Revenues from customer contracts are considered for recognition and
measurement when the contract has been approved, in writing, by the parties to the contract, the parties to the contract are committed
to perform their respective obligations under the contract, and the contract is legally enforceable. The Group assesses the services promised
in a contract and identifies distinct performance obligations in the contract. Identification of distinct performance obligations to determine
the deliverables and the ability of the customer to benefit independently from such deliverables, and allocation of transaction price
to these distinct performance obligations involves significant judgement.
Fixed price maintenance revenue is recognized ratably
on a straight-line basis when services are performed through an indefinite number of repetitive acts over a specified period. Revenue
from fixed price maintenance contract is recognized ratably using a percentage of completion method when the pattern of benefits from
the services rendered to the customer and Group’s costs to fulfil the contract is not even through the period of the contract because
the services are generally discrete in nature and not repetitive. The use of method to recognize the maintenance revenues requires judgment
and is based on the promises in the contract and nature of the deliverables.
The Group uses the percentage-of-completion method
in accounting for other fixed-price contracts. Use of the percentage-of-completion method requires the Group to determine the actual efforts
or costs expended to date as a proportion of the estimated total efforts or costs to be incurred. Efforts or costs expended have been
used to measure progress towards completion as there is a direct relationship between input and productivity. The estimation of total
efforts or costs involves significant judgement and is assessed throughout the period of the contract to reflect any changes based on
the latest available information.
Contracts with customers includes subcontractor services
or third-party vendor equipment or software in certain integrated services arrangements. In these types of arrangements, revenue from
sales of third-party vendor products or services is recorded net of costs when the Group is acting as an agent between the customer and
the vendor, and gross when the Group is the principal for the transaction. In doing so, the Group first evaluates whether it controls
the good or service before it is transferred to the customer. The Group considers whether it has the primary obligation to fulfil the
contract, inventory risk, pricing discretion and other factors to determine whether it controls the goods or service and therefore, is
acting as a principal or an agent.
Provisions for estimated losses, if any, on incomplete
contracts are recorded in the period in which such losses become probable based on the estimated efforts or costs to complete the contract.
b. Income taxes
The Group's two major tax jurisdictions are India and
the United States, though the company also files tax returns in other overseas jurisdictions.
Significant judgments are involved in determining the
provision for income taxes, including amount expected to be paid/recovered for uncertain tax positions.
In assessing the realizability of deferred income tax
assets, Management considers whether some portion or all of the deferred income tax assets will not be realized. The ultimate realization
of deferred income tax assets is dependent upon the generation of future taxable income during the periods in which the temporary differences
become deductible. Management considers the scheduled reversals of deferred income tax liabilities, projected future taxable income and
tax planning strategies in making this assessment. Based on the level of historical taxable income and projections for future taxable
income over the periods in which the deferred income tax assets are deductible, Management believes that the group will realize the benefits
of those deductible differences. The amount of the deferred income tax assets considered realizable, however, could be reduced in the
near term if estimates of future taxable income during the carry forward period are reduced. (Refer to note 2.13)
c. Business combinations and intangible assets
Business combinations are accounted for using IFRS
3 (Revised), Business Combinations. IFRS 3 requires us to fair value identifiable intangible assets and contingent consideration to ascertain
the net fair value of identifiable assets, liabilities and contingent liabilities of the acquiree. These valuations are conducted by external
valuation experts. Estimates are required to be made in determining the value of contingent consideration, value of option arrangements
and intangible assets. These measurements are based on information available at the acquisition date and are based on expectations and
assumptions that have been deemed reasonable by Management. (Refer to note 2.11 and 2.10.2)
d. Property, plant and equipment
Property, plant and equipment represent a significant
proportion of the asset base of the Group. The charge in respect of periodic depreciation is derived after determining an estimate of
an asset’s expected useful life and the expected residual value at the end of its life. The useful lives and residual values of
Group's assets are determined by Management at the time the asset is acquired and reviewed periodically, including at each financial year
end. The lives are based on historical experience with similar assets as well as anticipation of future events, which may impact their
life, such as changes in technology. (Refer to note 2.8)
e. Impairment of Goodwill
Goodwill is tested for impairment on an annual basis
and whenever there is an indication that the recoverable amount of a cash generating unit (CGUs) is less than it’s carrying amount.
For the impairment test, goodwill is allocated to the CGU or groups of CGUs which benefit from the synergies of the acquisition and which
represent the lowest level at which goodwill is monitored for internal management purposes.
The recoverable amount of CGUs is determined based
on higher of value-in-use and fair value less cost to sell. Key assumptions in the cash flow projections are prepared based on current
economic conditions and comprises estimated long term growth rates, weighted average cost of capital and estimated operating margins.
(Refer to note 2.10.1)
1.6 Recent accounting pronouncements
1.6.1 Standards issued but not yet effective
New and revised IFRS Standards in issue but not
yet effective:
| Amendments to IFRS 16 Leases |
Lease Liability in a Sale and Leaseback |
| Amendments to IAS 7 Statement of Cash Flows and IFRS 7 Financial Instruments |
Disclosure regarding supplier finance arrangements |
Amendments to IFRS 16
On September 22, 2022, International Accounting Standards
Board (IASB) has issued amendments to IFRS 16 Leases, which added requirements explaining the subsequent measurement for a sale and leaseback
transaction. These amendments will not change the accounting for leases other than those arising in a sale and leaseback transaction.
The effective date for the adoption of this amendment
is annual reporting periods beginning on or after January 1, 2024, although early adoption is permitted. The Group does not expect this
amendment to have any significant impact in its financial statements.
Amendments to IAS 7 and IFRS 7
On May 25, 2023 International Accounting Standards
Board (IASB) has issued amendments to IAS 7 Statement of Cash Flows and IFRS 7 Financial Instruments: Disclosure which requires entities
to disclose information that enables users of financial statement to assess how supplier finance arrangements affect its liabilities and
cash flows and to understand the effect of supplier finance arrangements on an entity’s exposure to liquidity risk and how the entity
might be affected if the arrangements were no longer available to it.
The effective date for adoption of this amendment is
annual periods beginning on or after January 1, 2024, although early adoption is permitted. The Group is in the process of evaluating
the impact of the amendment.
2. Notes to the Interim Condensed Consolidated Financial
Statements
2.1 Cash and cash equivalents
Cash and cash equivalents consist of the following:
(Dollars in millions)
| Particulars |
As at |
| |
June 30, 2023 |
March 31, 2023 |
| Cash and bank deposits |
1,263 |
1,220 |
| Deposits with financial institutions |
238 |
261 |
| Total Cash and cash equivalents |
1,501 |
1,481 |
Cash and cash equivalents as at June 30, 2023 and March
31, 2023 include restricted cash and bank balances of $47 million and $44 million, respectively. The restrictions are primarily on account
of bank balances held by irrevocable trusts controlled by the company.
The deposits maintained by the Group with banks and
financial institutions comprise of time deposits, which can be withdrawn by the Group at any point without prior notice or penalty on
the principal.
2.2 Earmarked bank balance for dividend
(Dollars in millions)
| Particulars |
As at |
| |
June 30, 2023 |
March 31, 2023 |
| Current |
|
|
| Earmarked bank balance for dividend |
885 |
– |
| Total |
885 |
– |
The Board of Directors in their meeting held on April
13, 2023 recommended a final dividend of 17.50/- per equity share (approximately $0.21 per equity share) for the financial year
ended March 31, 2023. The same was approved by the shareholders at the Annual General Meeting (AGM) of the Company held on June 28, 2023.
Payment date for the dividend is July 3, 2023. Earmarked bank balance for dividend represents cash which is deposited in a designated
bank account only for payment of final dividend for financial year ended March 31, 2023.
2.3 Investments
The carrying value of the investments are as follows:
(Dollars in millions)
| Particulars |
As at |
| |
June 30, 2023 |
March 31, 2023 |
| (i) Current Investments |
|
|
| Amortized Cost |
|
|
| Quoted debt securities |
18 |
18 |
| Fair Value through profit or loss |
|
|
| Liquid mutual fund units |
170 |
119 |
| Fair Value through other comprehensive income |
|
|
| Quoted Debt Securities |
190 |
179 |
| Certificates of deposits |
115 |
435 |
| Commercial Paper |
182 |
90 |
| Total current investments |
675 |
841 |
| (ii) Non-current Investments |
|
|
| Amortized Cost |
|
|
| Quoted debt securities |
215 |
215 |
| Fair Value through other comprehensive income |
|
|
| Quoted debt securities |
1,152 |
1,221 |
| Unquoted equity and preference securities |
24 |
24 |
| Fair Value through profit or loss |
|
|
| Target maturity fund units |
50 |
49 |
| Others(1) |
21 |
21 |
| Total Non-current investments |
1,462 |
1,530 |
| |
|
|
| Total investments |
2,137 |
2,371 |
| Investments carried at amortized cost |
233 |
233 |
| Investments carried at fair value through other comprehensive income |
1,663 |
1,949 |
| Investments carried at fair value through profit or loss |
241 |
189 |
| (1) | | Uncalled capital commitments outstanding as on June 30, 2023 and March 31, 2023 was $11
million and $11 million, respectively. |
Refer to note 2.4 for accounting policies on financial
instruments.
Method of fair valuation:
(Dollars in millions)
| Class of investment |
Method |
Fair value |
| |
|
June 30, 2023 |
March 31, 2023 |
| Liquid mutual fund units - carried at fair value through profit or loss |
Quoted price |
170 |
119 |
| Target maturity fund units - carried at fair value through profit or loss |
Quoted price |
50 |
49 |
| Quoted debt securities- carried at amortized cost |
Quoted price and market observable inputs |
261 |
261 |
| Quoted debt securities- carried at fair value through other comprehensive income |
Quoted price and market observable inputs |
1,342 |
1,400 |
| Commercial paper - carried at fair value through other comprehensive income |
Market observable inputs |
182 |
90 |
| Certificates of deposit - carried at fair value through other comprehensive income |
Market observable inputs |
115 |
435 |
| Unquoted equity and preference securities - carried at fair value through other comprehensive income |
Discounted cash flows method, Market multiples method, Option pricing model |
24 |
24 |
| Others - carried at fair value through profit or loss |
Discounted cash flows method, Market multiples method, Option pricing model |
21 |
21 |
| Total |
|
2,165 |
2,399 |
Note: Certain quoted investments are classified as
Level 2 in the absence of active market for such investments.
2.4 Financial instruments
Accounting Policy
2.4.1 Initial recognition
The group recognizes financial assets and financial
liabilities when it becomes a party to the contractual provisions of the instrument. All financial assets and liabilities are recognized
at fair value on initial recognition, except for trade receivables which are initially measured at transaction price. Transaction costs
that are directly attributable to the acquisition or issue of financial assets and financial liabilities, that are not at fair value through
profit or loss, are added to the fair value on initial recognition. Regular way purchase and sale of financial assets are accounted for
at trade date.
2.4.2 Subsequent measurement
a. Non-derivative financial instruments
(i) Financial assets carried at amortized cost
A financial asset is subsequently measured at amortized
cost if it is held within a business model whose objective is to hold the asset in order to collect contractual cash flows and the contractual
terms of the financial asset give rise on specified dates to cash flows that are solely payments of principal and interest on the principal
amount outstanding.
(ii) Financial assets carried at fair value through
other comprehensive income (FVOCI)
A financial asset is subsequently measured at fair
value through other comprehensive income if it is held within a business model whose objective is achieved by both collecting contractual
cash flows and selling financial assets and the contractual terms of the financial asset give rise on specified dates to cash flows that
are solely payments of principal and interest on the principal amount outstanding. The Group has made an irrevocable election for its
investments which are classified as equity instruments to present the subsequent changes in fair value in other comprehensive income based
on its business model.
(iii) Financial assets carried at fair value
through profit or loss (FVTPL)
A financial asset which is not classified in any of
the above categories is subsequently fair valued through profit or loss.
(iv) Financial liabilities
Financial liabilities are subsequently carried at amortized
cost using the effective interest method, except for contingent consideration and financial liability under option arrangements recognized
in a business combination which is subsequently measured at fair value through profit or loss.
b. Derivative financial instruments
The group holds derivative financial instruments such
as foreign exchange forward and option contracts to mitigate the risk of changes in exchange rates on foreign currency exposures. The
counterparty for such contracts is generally a bank.
(i) Financial assets or financial liabilities, carried
at fair value through profit or loss
This category includes derivative financial assets
or liabilities which are not designated as hedges.
Although the group believes that these derivatives
constitute hedges from an economic perspective, they may not qualify for hedge accounting under IFRS 9, Financial Instruments. Any derivative
that is either not designated as hedge, or is so designated but is ineffective as per IFRS 9, is categorized as a financial asset or financial
liability carried at fair value through profit or loss.
Derivatives not designated as hedges are recognized
initially at fair value and attributable transaction costs are recognized in net profit in the statement of comprehensive income when
incurred. Subsequent to initial recognition, these derivatives are measured at fair value through profit or loss and the resulting exchange
gains or losses are included in other income. Assets/ liabilities in this category are presented as current assets/current liabilities
if they are either held for trading or are expected to be realized within 12 months after the balance sheet date.
(ii) Cash flow hedge
The group designates certain foreign exchange forward
and options contracts as cash flow hedges to mitigate the risk of foreign exchange exposure on highly probable forecast cash transaction.
When a derivative is designated as a cash flow hedging
instrument, the effective portion of changes in the fair value of the derivative is recognized in other comprehensive income and accumulated
in the cash flow hedging reserve. Any ineffective portion of changes in the fair value of the derivative is recognized immediately in
the net profit in the statement of comprehensive income. If the hedging instrument no longer meets the criteria for hedge accounting,
then hedge accounting is discontinued prospectively. If the hedging instrument expires or is sold, terminated or exercised, the cumulative
gain or loss on the hedging instrument recognized in cash flow hedging reserve till the period the hedge was effective remains in cash
flow hedging reserve until the forecasted transaction occurs. The cumulative gain or loss previously recognized in the cash flow hedging
reserve is transferred to the net profit in the statement of comprehensive income upon the occurrence of the related forecasted transaction.
If the forecasted transaction is no longer expected to occur, then the amount accumulated in cash flow hedging reserve is reclassified
to net profit in the consolidated statement of comprehensive income.
2.4.3 Derecognition of financial instruments
The group derecognizes a financial asset when the contractual
rights to the cash flows from the financial asset expire or it transfers the financial asset and the transfer qualifies for derecognition
under IFRS 9. A financial liability (or a part of a financial liability) is derecognized from the group's balance sheet when the obligation
specified in the contract is discharged or cancelled or expires.
2.4.4 Fair value of financial instruments
In determining the fair value of its financial instruments,
the group uses a variety of methods and assumptions that are based on market conditions and risks existing at each reporting date. The
methods used to determine fair value include discounted cash flow analysis, available quoted market prices and dealer quotes. All methods
of assessing fair value result in general approximation of value, and such value may never actually be realized.
Refer to table ‘Financial instruments by category’
below for the disclosure on carrying value and fair value of financial assets and liabilities. For financial assets and liabilities maturing
within one year from the Balance Sheet date and which are not carried at fair value, the carrying amounts approximate fair value due to
the short maturity of these instruments.
2.4.5 Impairment
The Group recognizes loss allowances using the expected
credit loss (ECL) model for the financial assets and unbilled revenue which are not fair valued through profit or loss. Loss allowance
for trade receivables and unbilled revenues with no significant financing component is measured at an amount equal to lifetime ECL. For
all other financial assets, expected credit losses are measured at an amount equal to the 12-month ECL, unless there has been a significant
increase in credit risk from initial recognition in which case those are measured at lifetime ECL.
The Group determines the allowance for credit losses
based on historical loss experience adjusted to reflect current and estimated future economic conditions. The Group considers current
and anticipated future economic conditions relating to industries the Group deals with and the countries where it operates.
The amount of ECL (or reversal) that is required to
adjust the loss allowance at the reporting date to the amount that is required to be recorded is recognized as an impairment loss or gain
in consolidated statement of comprehensive income.
Financial instruments by category
The carrying value and fair value of financial instruments
by categories as at June 30, 2023 were as follows:
(Dollars in millions)
| Particulars |
Amortized cost |
Financial assets / liabilities at fair value through profit or loss |
Financial assets / liabilities at fair value through OCI |
Total carrying value |
Total fair value |
| |
|
Designated upon initial recognition |
Mandatory |
Equity instruments designated upon initial recognition |
Mandatory |
|
|
| Assets: |
|
|
|
|
|
|
|
| Cash and cash equivalents (Refer to note 2.1) |
1,501 |
– |
– |
– |
– |
1,501 |
1,501 |
| Earmarked bank balance for dividend (Refer to note 2.2) |
885 |
– |
– |
– |
– |
885 |
885 |
| Investments (Refer to note 2.3) |
|
|
|
|
|
|
|
| Liquid mutual fund units |
– |
– |
170 |
– |
– |
170 |
170 |
| Target maturity fund units |
– |
– |
50 |
– |
– |
50 |
50 |
| Quoted debt securities |
233 |
– |
– |
– |
1,342 |
1,575 |
1,603(1) |
| Certificates of deposit |
– |
– |
– |
– |
115 |
115 |
115 |
| Commercial Papers |
– |
– |
– |
– |
182 |
182 |
182 |
| Unquoted equity and preference securities |
– |
– |
– |
24 |
– |
24 |
24 |
| Unquoted investment others |
– |
– |
21 |
– |
– |
21 |
21 |
| Trade receivables |
3,191 |
– |
– |
– |
– |
3,191 |
3,191 |
| Unbilled revenues (Refer to note 2.18)(3) |
1,100 |
– |
– |
– |
– |
1,100 |
1,100 |
| Prepayments and other assets (Refer to note 2.5) |
623 |
– |
– |
– |
– |
623 |
612(2) |
| Derivative financial instruments |
– |
– |
18 |
– |
3 |
21 |
21 |
| Total |
7,533 |
– |
259 |
24 |
1,642 |
9,458 |
9,475 |
| Liabilities: |
|
|
|
|
|
|
|
| Trade payables |
458 |
– |
– |
– |
– |
458 |
458 |
| Lease liabilities (Refer to note 2.9) |
1,034 |
– |
– |
– |
– |
1,034 |
1,034 |
| Derivative financial instruments |
– |
– |
5 |
– |
1 |
6 |
6 |
Financial liability under option arrangements
(Refer to note 2.6) |
– |
– |
76 |
– |
– |
76 |
76 |
Other liabilities including contingent consideration
(Refer to note 2.6) |
2,649 |
– |
12 |
– |
– |
2,661 |
2,661 |
| Total |
4,141 |
– |
93 |
– |
1 |
4,235 |
4,235 |
| (1) | | On account of fair value changes including interest accrued |
| (2) | | Excludes interest accrued on quoted debt securities carried at amortized cost of $11 million |
| (3) | | Excludes unbilled revenue for contracts where the right to consideration is dependent
on completion of contractual milestones |
The carrying value and fair value of financial instruments
by categories as at March 31, 2023 were as follows:
(Dollars in millions)
| Particulars |
Amortized cost |
Financial assets/ liabilities at fair value through profit or loss |
Financial assets/liabilities at fair value through OCI |
Total carrying value |
Total fair value |
| |
|
Designated upon initial recognition |
Mandatory |
Equity instruments designated upon initial recognition |
Mandatory |
|
|
| Assets: |
|
|
|
|
|
|
|
| Cash and cash equivalents (Refer to note 2.1) |
1,481 |
– |
– |
– |
– |
1,481 |
1,481 |
| Investments (Refer to note 2.3) |
|
|
|
|
|
|
|
| Liquid mutual fund units |
– |
– |
119 |
– |
– |
119 |
119 |
| Target maturity fund units |
– |
– |
49 |
– |
– |
49 |
49 |
| Quoted debt securities |
233 |
– |
– |
– |
1,400 |
1,633 |
1,661(1) |
| Certificates of deposit |
– |
– |
– |
– |
435 |
435 |
435 |
| Commercial Papers |
– |
– |
– |
– |
90 |
90 |
90 |
| Unquoted equity and preference securities |
– |
– |
– |
24 |
– |
24 |
24 |
| Unquoted investments others |
– |
– |
21 |
– |
– |
21 |
21 |
| Trade receivables |
3,094 |
– |
– |
– |
– |
3,094 |
3,094 |
| Unbilled revenues(Refer to note 2.18)(3) |
1,157 |
– |
– |
– |
– |
1,157 |
1,157 |
| Prepayments and other assets (Refer to note 2.5) |
624 |
– |
– |
– |
– |
624 |
614(2) |
| Derivative financial instruments |
– |
– |
8 |
– |
4 |
12 |
12 |
| Total |
6,589 |
– |
197 |
24 |
1,929 |
8,739 |
8,757 |
| Liabilities: |
|
|
|
|
|
|
|
| Trade payables |
470 |
– |
– |
– |
– |
470 |
470 |
| Lease liabilities (Refer to note 2.9) |
1,010 |
– |
– |
– |
– |
1,010 |
1,010 |
| Derivative financial instruments |
– |
– |
8 |
– |
2 |
10 |
10 |
Financial liability under option arrangements
(Refer to note 2.6) |
– |
– |
73 |
– |
– |
73 |
73 |
| Other liabilities including contingent consideration (Refer to note 2.6) |
2,112 |
– |
12 |
– |
– |
2,124 |
2,124 |
| Total |
3,592 |
– |
93 |
– |
2 |
3,687 |
3,687 |
| (1) | | On account of fair value changes including interest accrued |
| (2) | | Excludes interest accrued on quoted debt securities carried at amortized cost of $10 million |
| (3) | | Excludes unbilled revenue for contracts where the right to consideration is dependent
on completion of contractual milestones |
For trade receivables, trade payables, other assets
and payables maturing within one year from the balance sheet date, the carrying amounts approximate fair value due to the short maturity
of these instruments.
Fair value hierarchy
Level 1 - Quoted prices (unadjusted) in active
markets for identical assets or liabilities.
Level 2 – Inputs other than quoted prices
included within Level 1 that are observable for the asset or liability, either directly (i.e. as prices) or indirectly (i.e. derived from
prices).
Level 3 - Inputs for the assets or liabilities
that are not based on observable market data (unobservable inputs).
The fair value hierarchy of assets and liabilities
measured at fair value on a recurring basis as at June 30, 2023 is as follows:
(Dollars in millions)
| Particulars |
As at June 30, 2023 |
Fair value measurement at end of the reporting period using |
| |
|
Level 1 |
Level 2 |
Level 3 |
| Assets |
|
|
|
|
| Investments (Refer to note 2.3) |
|
|
|
|
| Investments in liquid mutual fund units |
170 |
170 |
– |
– |
| Investments in target maturity fund units |
50 |
50 |
– |
– |
| Investments in quoted debt securities |
1,603 |
1,418 |
185 |
– |
| Investments in certificates of deposit |
115 |
– |
115 |
– |
| Investments in commercial paper |
182 |
– |
182 |
– |
| Investments in unquoted equity and preference securities |
24 |
– |
– |
24 |
| Investments in unquoted investments others |
21 |
– |
– |
21 |
| Others |
|
|
|
|
| Derivative financial instruments - gain on outstanding foreign exchange forward and option contracts |
21 |
– |
21 |
– |
| Liabilities |
|
|
|
|
| Derivative financial instruments - loss on outstanding foreign exchange forward and option contracts |
6 |
– |
6 |
– |
| Financial liability under option arrangements (Refer to note 2.6)(1) |
76 |
– |
– |
76 |
| Liability towards contingent consideration (Refer to note 2.6)(1) |
12 |
– |
– |
12 |
| (1) | | Discount rate ranges from 10% to 17% |
During the three months ended June 30, 2023, quoted
debt securities of $177 million were transferred from Level 2 to Level 1 of fair value hierarchy, since these were valued based on quoted
price.
The fair value hierarchy of assets and liabilities
measured at fair value on a recurring basis as at March 31, 2023 is as follows:
(Dollars in millions)
| Particulars |
As at March 31, 2023 |
Fair value measurement at end of the reporting period using |
| |
|
Level 1 |
Level 2 |
Level 3 |
| Assets |
|
|
|
|
| Investments (Refer to note 2.3) |
|
|
|
|
| Investments in liquid mutual fund units |
119 |
119 |
– |
– |
| Investments in target maturity fund units |
49 |
49 |
– |
– |
| Investments in quoted debt securities |
1,661 |
1,302 |
359 |
– |
| Investments in certificates of deposit |
435 |
– |
435 |
– |
| Investments in commercial paper |
90 |
– |
90 |
– |
| Investments in unquoted equity and preference securities |
24 |
– |
– |
24 |
| Investments in unquoted investments others |
21 |
– |
– |
21 |
| Others |
|
|
|
|
| Derivative financial instruments- gain on outstanding foreign exchange forward and option contracts |
12 |
– |
12 |
– |
| Liabilities |
|
|
|
|
| Derivative financial instruments- loss on outstanding foreign exchange forward and option contracts |
10 |
– |
10 |
– |
| Financial liability under option arrangements (Refer to note 2.6)(1) |
73 |
– |
– |
73 |
| Liability towards contingent consideration (Refer to note 2.6)(1) |
12 |
– |
– |
12 |
| (1) | | Discount rate ranges from 10% to 15% |
During the year ended March 31, 2023, quoted debt securities
of $47 million were transferred from Level 2 to Level 1 of fair value hierarchy, since these were valued based on quoted price and quoted
debt securities of $196 million were transferred from Level 1 to Level 2 of fair value hierarchy, since these were valued based on market
observable inputs.
A one percentage point change in the unobservable inputs
used in fair valuation of Level 3 assets and liabilities does not have a significant impact in its value.
Majority of investments of the Group are fair valued
based on Level 1 or Level 2 inputs. These investments primarily include investment in liquid mutual fund units, target maturity fund units,
quoted debt securities, certificates of deposit, commercial paper, quoted bonds issued by government and quasi-government organizations.
The Group invests after considering counterparty risks based on multiple criteria including Tier I Capital, Capital Adequacy Ratio, Credit
Rating, Profitability, NPA levels and Deposit base of banks and financial institutions. These risks are monitored regularly as per Group’s
risk management program.
2.5 Prepayments and other assets
Prepayments and other assets consist of the following:
(Dollars in millions)
| Particulars |
As at |
| |
June 30, 2023 |
March 31, 2023 |
| Current |
|
|
| Rental deposits(1) |
4 |
4 |
| Security deposits(1) |
1 |
1 |
| Loans to employees(1) |
33 |
35 |
| Prepaid expenses(2) |
377 |
334 |
| Interest accrued and not due(1) |
41 |
59 |
| Withholding taxes and others(2) |
363 |
398 |
| Advance payments to vendors for supply of goods(2) |
27 |
25 |
| Deposit with corporations(1)(3) |
309 |
286 |
| Deferred contract cost(2) |
|
|
| Cost of obtaining a contract(2)(4) |
80 |
104 |
| Cost of fulfillment(2) |
24 |
21 |
| Net investment in sublease of right-of-use asset(1) |
1 |
6 |
| Other non financial assets (2) |
30 |
32 |
| Other financial assets(1) |
96 |
31 |
| Total Current prepayment and other assets |
1,386 |
1,336 |
| Non-current |
|
|
| Loans to employees(1) |
4 |
5 |
| Security deposits(1) |
6 |
6 |
| Deposit with corporations(1)(3) |
12 |
12 |
| Defined benefit plan assets(2) |
4 |
4 |
| Prepaid expenses(2) |
48 |
41 |
| Deferred contract cost(2) |
|
|
| Cost of obtaining a contract (2)(4) |
23 |
23 |
| Cost of fulfillment(2) |
89 |
79 |
| Withholding taxes and others(2) |
84 |
83 |
| Net investment in sublease of right-of-use asset(1) |
1 |
37 |
| Rental deposits(1) |
29 |
29 |
| Other financial assets(1) |
86 |
113 |
| Total Non- current prepayment and other assets |
386 |
432 |
| Total prepayment and other assets |
1,772 |
1,768 |
| (1) Financial assets carried at amortized cost |
623 |
624 |
Withholding taxes and others primarily consist of input
tax credits and Cenvat/VAT recoverable from Government of India.
| (3) | | Deposit with corporation represents amounts deposited to settle certain employee-related
obligations as and when they arise during the normal course of business. |
| (4) | | Includes technology assets taken over by the Group from a customer as a part of transformation
project which is not considered as distinct goods or services and the control related to the assets is not transferred to the Group in
accordance with IFRS 15 - Revenue from contract with customers. Accordingly, the same has been considered as a reduction to the total
contract value and accounted as Deferred contract cost. The Group has entered into financing arrangements with a third party for these
assets. As at June 30, 2023, the financial liability pertaining to such arrangements amounts to $71 million. During the three months
ended June 30, 2023, $2 million was settled directly by the third party to the customer on behalf of the Group and accordingly considered
as non-cash transaction. (Refer to note 2.6) |
2.6 Other liabilities
Other liabilities comprise the following:
(Dollars in millions)
| Particulars |
As at |
| |
June 30, 2023 |
March 31, 2023 |
| Current |
|
|
| Accrued compensation to employees(1) |
462 |
508 |
| Accrued expenses(1) |
900 |
949 |
| Accrued defined benefit liability(3) |
1 |
- |
| Withholding taxes and others(3) |
485 |
442 |
| Retention money(1) |
2 |
2 |
| Liabilities of controlled trusts(1) |
26 |
26 |
| Deferred income - government grants(3) |
1 |
4 |
| Liability towards contingent consideration(2) |
12 |
12 |
| Capital Creditors(1) |
32 |
82 |
| Final dividend payable to shareholders(1)(5) |
795 |
- |
| Financial liability under option arrangements(2)# |
76 |
73 |
| Other financial liabilities(1)(4) |
215 |
305 |
| Total current other liabilities |
3,007 |
2,403 |
| Non-current |
|
|
| Accrued compensation to employees(1) |
1 |
1 |
| Accrued expenses(1) |
187 |
198 |
| Accrued defined benefit liability (3) |
34 |
54 |
| Deferred income - government grants(3) |
8 |
5 |
| Deferred income(3) |
1 |
1 |
| Other non-financial liabilities(3) |
1 |
1 |
| Other financial liabilities(1)(4) |
29 |
41 |
| Total non-current other liabilities |
261 |
301 |
| Total other liabilities |
3,268 |
2,704 |
| (1) Financial liability carried at amortized cost |
2,649 |
2,112 |
| (2) Financial liability carried at fair value through profit or loss |
88 |
85 |
| (3) | | Non financial liabilities |
| (4) | | Deferred contract cost (Refer to note 2.5) includes technology assets taken over by the Group
from a customer as a part of transformation project which is not considered as distinct goods or services and the control related to
the assets is not transferred to the Group in accordance with IFRS 15 - Revenue from contract with customers. Accordingly, the same has
been considered as a reduction to the total contract value and accounted as Deferred contract cost. The Group has entered in to financing
arrangements with a third party for these assets. As at June 30, 2023, the financial liability pertaining to such arrangements amounts
to $71 million. During the three months ended June 30, 2023, $2 million was settled directly by the third party to the customer on behalf
of the Group and accordingly considered as non-cash transaction. |
| (5) | | Pertains to final dividend declared by the Company for fiscal 2023 and approved by the shareholders
on June 28, 2023. Payment date for dividend is July 3, 2023. (Refer to note 2.19.2) |
| # | | Represents liability related to options issued by the Group over the non-controlling interests
in its subsidiaries. |
Accrued expenses primarily relate to cost of technical
sub-contractors, telecommunication charges, legal and professional charges, brand building expenses, overseas travel expenses and office
maintenance and cost of third party software and hardware.
2.7 Provisions and other contingencies
Accounting Policy
Provisions
A provision is recognized if, as a result of a past
event, the Group has a present legal or constructive obligation that is reasonably estimable, and it is probable that an outflow of economic
benefits will be required to settle the obligation. Provisions are determined by discounting the expected future cash flows at a pre-tax
rate that reflects current market assessments of the time value of money and the risks specific to the liability.
Contingent liability is a possible obligation arising
from past events and whose existence will be confirmed only by the occurrence or non-occurrence of one or more uncertain future events
not wholly within the control of the entity or a present obligation that arises from past events but is not recognised because it is not
probable that an outflow of resources embodying economic benefits will be required to settle the obligation or the amount of the obligation
cannot be measured with sufficient reliability.
a. Post sales client support
The Group provides its clients with a fixed-period
post sales support for its fixed-price, fixed-timeframe contracts. Costs associated with such support services are accrued at the time
related revenues are recorded and included in cost of sales. The Group estimates such costs based on historical experience and estimates
are reviewed on a periodic basis for any material changes in assumptions and likelihood of occurrence.
b. Onerous contracts
Provisions for onerous contracts are recognized when
the expected benefits to be derived by the Group from a contract are lower than the unavoidable costs of meeting the future obligations
under the contract. Provisions for estimated losses, if any, on incomplete contracts are recorded in the period in which such losses become
probable based on the estimated efforts or costs to complete the contract. The provision is measured at the present value of the lower
of the expected cost of terminating the contract and the expected net cost of continuing with the contract. Before a provision is established
the Group recognizes any impairment loss on the assets associated with that contract.
Provision for post sales client support and other
provisions
(Dollars in millions)
| Particulars |
As at |
| |
June 30, 2023 |
March 31, 2023 |
| Post sales client support and other provisions |
187 |
159 |
| Total provisions |
187 |
159 |
Provision for post sales client support represents
costs associated with providing post sales support services which are accrued at the time of recognition of revenues and are expected
to be utilized over a period of 1 year.
Provision for post sales client support and other provisions
is included in cost of sales in the interim condensed consolidated statement of comprehensive income.
As at June 30, 2023 and March 31, 2023, claims against
the Group, not acknowledged as debts, (excluding demands from income tax authorities- Refer to Note 2.13) amounted to $89 million (728
crore) and $85 million (700 crore), respectively.
Legal proceedings
The Group is subject to legal proceedings and claims,
which have arisen in the ordinary course of business. The Group’s Management reasonably expects that these legal actions, when ultimately
concluded and determined, will not have a material and adverse effect on the Group’s results of operations or financial condition.
2.8 Property, plant and equipment
Accounting Policy
Property, plant and equipment are stated at cost, less
accumulated depreciation and impairment, if any. Costs directly attributable to acquisition are capitalized until the property, plant
and equipment are ready for use, as intended by Management. The charge in respect of periodic depreciation is derived at after determining
an estimate of an asset’s expected useful life and the expected residual value at the end of its life. The group depreciates property,
plant and equipment over their estimated useful lives using the straight-line method. The estimated useful lives of assets are as follows:
| Building |
22-25 years |
| Plant and machinery(1) |
5 years |
| Computer equipment |
3-5 years |
| Furniture and fixtures |
5 years |
| Vehicles |
5 years |
| Leasehold improvements |
Lower of useful life of the asset or lease term |
| (1) | | Includes solar plant with a useful life of 25 years |
Depreciation methods, useful lives and residual values
are reviewed periodically, including at each financial year end. The useful lives are based on historical experience with similar assets
as well as anticipation of future events, which may impact their life, such as changes in technology.
Advances paid towards the acquisition of property,
plant and equipment outstanding at each balance sheet date and the cost of assets not ready to use before such date are disclosed under
‘Capital work-in-progress’. Subsequent expenditures relating to property, plant and equipment is capitalized only when it
is probable that future economic benefits associated with these will flow to the Group and the cost of the item can be measured reliably.
The cost and related accumulated depreciation are eliminated from the financial statements upon sale or retirement of the asset.
Impairment
Property, plant and equipment are evaluated for recoverability
whenever events or changes in circumstances indicate that their carrying amounts may not be recoverable. For the purpose of impairment
testing, the recoverable amount (i.e. the higher of the fair value less cost to sell and the value-in-use) is determined on an individual
asset basis unless the asset does not generate cash flows that are largely independent of those from other assets. In such cases, the
recoverable amount is determined for the Cash Generating Unit (CGU) to which the asset belongs.
If such assets are considered to be impaired, the impairment
to be recognized in net profit in the statement of comprehensive income is measured by the amount by which the carrying value of the assets
exceeds the estimated recoverable amount of the asset. An impairment loss is reversed in net profit in the statement of comprehensive
income if there has been a change in the estimates used to determine the recoverable amount. The carrying amount of the asset is increased
to its revised recoverable amount, provided that this amount does not exceed the carrying amount that would have been determined (net
of any accumulated depreciation) had no impairment loss been recognized for the asset in prior years.
The changes in the carrying value of property, plant
and equipment for the three months ended June 30, 2023 are as follows:
(Dollars in millions)
| Particulars |
Land |
Buildings |
Plant and machinery |
Computer equipment |
Furniture and fixtures |
Vehicles |
Total |
| Gross carrying value as at April 1, 2023 |
174 |
1,407 |
625 |
1,037 |
409 |
6 |
3,658 |
| Additions |
– |
1 |
7 |
27 |
5 |
– |
40 |
| Deletions* |
– |
– |
(6) |
(32) |
(4) |
– |
(42) |
| Translation difference |
– |
(5) |
1 |
1 |
1 |
(1) |
(3) |
| Gross carrying value as at June 30, 2023 |
174 |
1,403 |
627 |
1,033 |
411 |
5 |
3,653 |
| Accumulated depreciation as at April 1, 2023 |
– |
(552) |
(468) |
(709) |
(300) |
(5) |
(2,034) |
| Depreciation |
– |
(13) |
(14) |
(44) |
(12) |
– |
(83) |
| Accumulated depreciation on deletions* |
– |
– |
6 |
32 |
3 |
– |
41 |
| Translation difference |
– |
1 |
(1) |
(1) |
1 |
– |
– |
| Accumulated depreciation as at June 30, 2023 |
– |
(564) |
(477) |
(722) |
(308) |
(5) |
(2,076) |
| Capital work-in progress as at April 1, 2023 |
|
|
|
|
|
|
55 |
| Carrying value as at April 1, 2023 |
174 |
855 |
157 |
328 |
109 |
1 |
1,679 |
| Capital work-in progress as at June 30, 2023 |
|
|
|
|
|
|
61 |
| Carrying value as at June 30, 2023 |
174 |
839 |
150 |
311 |
103 |
– |
1,638 |
The changes in the carrying value of property, plant
and equipment for the three months ended June 30, 2022 are as follows:
(Dollars in millions)
| Particulars |
Land |
Buildings |
Plant and machinery |
Computer equipment |
Furniture and fixtures |
Vehicles |
Total |
| Gross carrying value as at April 1, 2022 |
188 |
1,481 |
653 |
1,125 |
423 |
6 |
3,876 |
| Additions |
– |
17 |
11 |
43 |
12 |
– |
83 |
| Additions - Business Combination |
– |
– |
1 |
– |
– |
– |
1 |
| Deletions* |
– |
– |
(3) |
(9) |
(3) |
– |
(15) |
| Translation difference |
(7) |
(62) |
(28) |
(46) |
(18) |
– |
(161) |
| Gross carrying value as at June 30, 2022 |
181 |
1,436 |
634 |
1,113 |
414 |
6 |
3,784 |
| Accumulated depreciation as at April 1, 2022 |
– |
(541) |
(484) |
(796) |
(324) |
(5) |
(2,150) |
| Depreciation |
– |
(14) |
(14) |
(39) |
(11) |
– |
(78) |
| Accumulated depreciation on deletions* |
– |
– |
3 |
9 |
3 |
– |
15 |
| Translation difference |
– |
23 |
21 |
33 |
14 |
– |
91 |
| Accumulated depreciation as at June 30, 2022 |
– |
(532) |
(474) |
(793) |
(318) |
(5) |
(2,122) |
| Capital work-in progress as at April 1, 2022 |
|
|
|
|
|
|
67 |
| Carrying value as at April 1, 2022 |
188 |
940 |
169 |
329 |
99 |
1 |
1,793 |
| Capital work-in progress as at June 30, 2022 |
|
|
|
|
|
|
46 |
| Carrying value as at June 30, 2022 |
181 |
904 |
160 |
320 |
96 |
1 |
1,708 |
| * | | During the three months ended June 30, 2023, certain assets which were old and not in use
having gross book value of $39 million (net book value: Nil) were retired. During the three months ended June 30, 2022, certain assets
which were old and not in use having gross book value of $9 million (net book value: Nil) were retired |
The aggregate depreciation expense is included in cost
of sales in the interim condensed consolidated statement of comprehensive income.
Repairs and maintenance costs are recognized in the
consolidated statement of comprehensive income when incurred.
The Group had contractual commitments for capital expenditure
primarily comprising of commitments for infrastructure facilities and computer equipments aggregating to $105 million and $117 million
as at June 30, 2023 and March 31, 2023, respectively.
2.9 Leases
Accounting Policy
The Group as a lessee
The Group’s lease asset classes primarily consist
of leases for land, buildings and computers. The group assesses whether a contract contains a lease, at inception of a contract. A contract
is, or contains, a lease if the contract conveys the right to control the use of an identified asset for a period of time in exchange
for consideration. To assess whether a contract conveys the right to control the use of an identified asset, the group assesses whether:
(1) the contract involves the use of an identified asset (2) the group has substantially all of the economic benefits from use of the
asset through the period of the lease and (3) the group has the right to direct the use of the asset.
At the date of commencement of the lease, the Group
recognizes a right-of-use asset (“ROU”) and a corresponding lease liability for all lease arrangements in which it is a lessee,
except for leases with a term of twelve months or less (short-term leases) and low value leases. For these short-term and low value leases,
the Group recognizes the lease payments as an operating expense on a straight-line basis over the term of the lease.
As a lessee, the Group determines the lease term as
the non-cancellable period of a lease adjusted with any option to extend or terminate the lease, if the use of such option is reasonably
certain. The Group makes an assessment on the expected lease term on a lease-by-lease basis and thereby assesses whether it is reasonably
certain that any options to extend or terminate the contract will be exercised. In evaluating the lease term, the Company considers factors
such as any significant leasehold improvements undertaken over the lease term, costs relating to the termination of the lease and the
importance of the underlying asset to Group’s operations taking into account the location of the underlying asset and the availability
of suitable alternatives. The lease term in future periods is reassessed to ensure that the lease term reflects the current economic circumstances.
Certain lease arrangements include the options to extend
or terminate the lease before the end of the lease term. ROU assets and lease liabilities includes these options when it is reasonably
certain that they will be exercised.
The right-of-use assets are initially recognized at
cost, which comprises the initial amount of the lease liability adjusted for any lease payments made at or prior to the commencement date
of the lease plus any initial direct costs less any lease incentives. They are subsequently measured at cost less accumulated depreciation
and impairment losses.
Right-of-use assets are depreciated from the commencement
date on a straight-line basis over the shorter of the lease term and useful life of the underlying asset.
Right-of-use assets are evaluated for recoverability
whenever events or changes in circumstances indicate that their carrying amounts may not be recoverable. For the purpose of impairment
testing, the recoverable amount (i.e. the higher of the fair value less cost to sell and the value-in-use) is determined on an individual
asset basis unless the asset does not generate cash flows that are largely independent of those from other assets. In such cases, the
recoverable amount is determined for the Cash Generating Unit (CGU) to which the asset belongs.
The lease liability is initially measured at amortized
cost at the present value of the future lease payments. The lease payments are discounted using the interest rate implicit in the lease
or, if not readily determinable, using the incremental borrowing rates in the country of domicile of these leases. Lease liabilities are
remeasured with a corresponding adjustment to the related right-of-use asset if the group changes its assessment if whether it will exercise
an extension or a termination option.
Lease liability and ROU asset have been separately
presented in the Balance Sheet and lease payments have been classified as financing cash flows.
The Group as a lessor
Leases for which the group is a lessor is classified
as a finance or operating lease. Whenever the terms of the lease transfer substantially all the risks and rewards of ownership to the
lessee, the contract is classified as a finance lease. All other leases are classified as operating leases.
When the Group is an intermediate lessor, it accounts
for its interests in the head lease and the sublease separately. The sublease is classified as a finance or operating lease by reference
to the right-of-use asset arising from the head lease.
For operating leases, rental income is recognized on
a straight-line basis over the term of the relevant lease.
Following are the changes in the carrying value of
right-of-use assets for the three months ended June 30, 2023:
(Dollars in millions)
| Particulars |
Category of ROU asset |
Total |
| |
Land |
Buildings |
Vehicles |
Computers |
|
| Balance as of April 1, 2023 |
76 |
474 |
2 |
285 |
837 |
| Additions* |
– |
30 |
– |
68 |
98 |
| Deletions |
– |
(1) |
– |
(28) |
(29) |
| Depreciation |
– |
(22) |
– |
(23) |
(45) |
| Translation difference |
(1) |
– |
– |
(1) |
(2) |
| Balance as of June 30, 2023 |
75 |
481 |
2 |
301 |
859 |
| * | | Net of adjustments on account of modifications and lease incentives |
Following are the changes in the carrying value of
right-of-use assets for the three months ended June 30, 2022:
(Dollars in millions)
| Particulars |
Category of ROU asset |
Total |
| |
Land |
Buildings |
Vehicles |
Computers |
|
| Balance as of April 1, 2022 |
83 |
489 |
2 |
62 |
636 |
| Additions* |
– |
54 |
– |
46 |
100 |
| Deletions |
– |
– |
– |
(10) |
(10) |
| Depreciation |
– |
(21) |
– |
(8) |
(29) |
| Translation difference |
(4) |
(21) |
– |
(3) |
(28) |
| Balance as of June 30, 2022 |
79 |
501 |
2 |
87 |
669 |
| * | | Net of adjustments on account of modifications and lease incentives |
The aggregate depreciation expense on ROU assets is
included in cost of sales in the interim condensed consolidated statement of comprehensive income.
The following is the break-up of current and non-current
lease liabilities as of June 30, 2023 and March 31, 2023:
(Dollars in millions)
| Particulars |
As at |
| |
June 30, 2023 |
March 31, 2023 |
| Current lease liabilities |
222 |
151 |
| Non-current lease liabilities |
812 |
859 |
| Total |
1,034 |
1,010 |
2.10 Goodwill and Intangible assets
2.10.1 Goodwill
Accounting Policy
Goodwill represents purchase consideration in excess
of the Group's interest in the net fair value of identifiable assets, liabilities and contingent liabilities of the acquired entity. When
the net fair value of the identifiable assets, liabilities and contingent liabilities acquired exceeds the purchase consideration, the
fair value of net assets acquired is reassessed and the bargain purchase gain is recognized immediately in the net profit in the Statement
of Comprehensive Income. Goodwill is measured at cost less accumulated impairment losses.
Impairment
Goodwill is tested for impairment on an annual basis
and whenever there is an indication that the recoverable amount of a cash generating unit (CGU) is less than its carrying amount. For
the impairment test, goodwill is allocated to the CGU or groups of CGU’s which benefit from the synergies of the acquisition and
which represents the lowest level at which goodwill is monitored for internal management purposes. A CGU is the smallest identifiable
group of assets that generates cash inflows that are largely independent of the cash inflows from other assets or group of assets. Impairment
occurs when the carrying amount of a CGU including the goodwill, exceeds the estimated recoverable amount of the CGU. The recoverable
amount of a CGU is the higher of its fair value less cost to sell and its value-in-use. Value-in-use is the present value of future cash
flows expected to be derived from the CGU. Key assumptions in the cash flow projections are prepared based on current economic conditions
and includes estimated long term growth rates, weighted average cost of capital and estimated operating margins.
Following is a summary of changes in the carrying amount
of goodwill:
(Dollars in millions)
| Particulars |
As at |
| |
June 30, 2023 |
March 31, 2023 |
| Carrying value at the beginning |
882 |
817 |
| Goodwill on acquisitions |
– |
79 |
| Translation differences |
– |
(14) |
| Carrying value at the end |
882 |
882 |
For the purpose of impairment testing, goodwill acquired
in a business combination is allocated to the CGU or groups of CGUs, which benefit from the synergies of the acquisition.
2.10.2 Intangible assets
Accounting Policy
Intangible assets are stated at cost less accumulated
amortization and impairment. Intangible assets are amortized over their respective individual estimated useful lives on a straight-line
basis, from the date that they are available for use. The estimated useful life of an identifiable intangible asset is based on a number
of factors including the effects of obsolescence, demand, competition, and other economic factors (such as the stability of the industry
and known technological advances), and the level of maintenance expenditures required to obtain the expected future cash flows from the
asset. Amortization methods and useful lives are reviewed periodically including at each financial year end.
Research costs are expensed as incurred. Software product
development costs are expensed as incurred unless technical and commercial feasibility of the project is demonstrated, future economic
benefits are probable, the Group has an intention and ability to complete and use or sell the software and the costs can be measured reliably.
The costs which can be capitalized include the cost of material, direct labour, overhead costs that are directly attributable to prepare
the asset for its intended use.
Impairment
Intangible assets are evaluated for recoverability
whenever events or changes in circumstances indicate that their carrying amounts may not be recoverable. For the purpose of impairment
testing, the recoverable amount (i.e. the higher of the fair value less cost to sell and the value-in-use) is determined on an individual
asset basis unless the asset does not generate cash flows that are largely independent of those from other assets. In such cases, the
recoverable amount is determined for the CGU to which the asset belongs.
If such assets are considered to be impaired, the impairment
to be recognized in the net profit in the statement of comprehensive income is measured by the amount by which the carrying value of the
assets exceeds the estimated recoverable amount of the asset. An impairment loss is reversed in the net profit in the statement of comprehensive
income if there has been a change in the estimates used to determine the recoverable amount. The carrying amount of the asset is increased
to its revised recoverable amount, provided that this amount does not exceed the carrying amount that would have been determined (net
of any accumulated amortization) had no impairment loss been recognized for the asset in prior years.
2.11 Business combinations
Accounting policy
Business combinations have been accounted for using
the acquisition method under the provisions of IFRS 3 (Revised), Business Combinations.
The purchase price in an acquisition is measured at
the fair value of the assets transferred, equity instruments issued and liabilities incurred or assumed at the date of acquisition, which
is the date on which control is transferred to the Group. The purchase price also includes the fair value of any contingent consideration.
Identifiable assets acquired and liabilities and contingent liabilities assumed in a business combination are measured initially at their
fair value on the date of acquisition. Contingent consideration is remeasured at fair value at each reporting date and changes in the
fair value of the contingent consideration are recognized in the Consolidated Statement of Comprehensive Income.
The interest of non-controlling shareholders is initially
measured either at fair value or at the non-controlling interests’ proportionate share of the acquiree’s identifiable net
assets. The choice of measurement basis is made on an acquisition-by-acquisition basis. Subsequent to acquisition, the carrying amount
of non-controlling interests is the amount of those interests at initial recognition plus the non-controlling interests’ share of
subsequent changes in equity of subsidiaries.
Business combinations between entities under common
control is outside the scope of IFRS 3 (Revised), Business Combinations and is accounted for at carrying value of assets acquired and
liabilities assumed.
The payments related to options issued by the Group
over the non-controlling interests in its subsidiaries are accounted as financial liabilities and initially recognized at the estimated
present value of gross obligations. Such options are subsequently measured at fair value in order to reflect the amount payable under
the option at the date at which it becomes exercisable. In the event that the option expires unexercised, the liability is derecognised.
Transaction costs that the Group incurs in connection
with a business combination such as finder’s fees, legal fees, due diligence fees, and other professional and consulting fees are
expensed as incurred.
2.12 Employees' Stock Option Plans (ESOP)
Accounting Policy
The Group recognizes compensation expense relating
to share-based payments in net profit based on estimated fair-values of the awards on the grant date. The estimated fair value of awards
is recognized as an expense in net profit in the consolidated statement of comprehensive income on a straight-line basis over the requisite
service period for each separately vesting portion of the award as if the award was in-substance, multiple awards with a corresponding
increase to share premium.
Infosys Expanded Stock Ownership Program 2019 (the
2019 Plan)
On June 22, 2019 pursuant to approval by the shareholders
in the Annual General Meeting, the Board has been authorized to introduce, offer, issue and provide share-based incentives to eligible
employees of the Company and its subsidiaries under the 2019 Plan. The maximum number of shares under the 2019 plan shall not exceed 50,000,000
equity shares. To implement the 2019 Plan, upto 45,000,000 equity shares may be issued by way of secondary acquisition of shares by Infosys
Expanded Stock Ownership Trust. The Restricted Stock Units (RSUs) granted under the 2019 plan shall vest based on the achievement of defined
annual performance parameters as determined by the administrator (Nomination and Remuneration Committee). The performance parameters will
be based on a combination of relative Total Shareholder Return (TSR) against selected industry peers and certain broader market domestic
and global indices and operating performance metrics of the company as decided by administrator. Each of the above performance parameters
will be distinct for the purposes of calculation of quantity of shares to vest based on performance. These instruments will generally
vest between a minimum of 1 to maximum of 3 years from the grant date.
2015 Stock Incentive Compensation Plan (the 2015
Plan):
On March 31, 2016, pursuant to the approval by the
shareholders through postal ballot, the Board was authorized to introduce, offer, issue and allot share-based incentives to eligible employees
of the Company and its subsidiaries under the 2015 Stock Incentive Compensation Plan. The maximum number of shares under the 2015 plan
shall not exceed 24,038,883 equity shares (this includes 11,223,576 equity shares which are held by the trust towards the 2011 Plan as
at March 31, 2016). These instruments will generally vest over a period of 4 years The plan numbers mentioned above are further adjusted
with the September 2018 bonus issue.
The equity settled and cash settled RSUs and stock
options would vest generally over a period of 4 years and shall be exercisable within the period as approved by the Nomination and Remuneration
Committee (NARC). The exercise price of the RSUs will be equal to the par value of the shares and the exercise price of the stock options
would be the market price as on the date of grant.
Controlled trust holds 11,738,357 and 12,172,119 shares
as at June 30, 2023 and March 31, 2023, respectively under the 2015 plan. Out of these shares, 2,00,000 equity shares each have been earmarked
for welfare activities of the employees as at June 30, 2023 and March 31, 2023, respectively.
The following is the summary of grants during three
months ended June 30, 2023 and June 30, 2022:
| |
2019 Plan |
2015 Plan |
| Particulars |
Three months ended June 30, |
Three months ended June 30, |
| |
2023 |
2022 |
2023 |
2022 |
| Equity settled RSUs |
|
|
|
|
| Key Management Personnel (KMP) |
78,281 |
176,893 |
333,596 |
101,967 |
| Employees other than KMP |
- |
370,960 |
4,500 |
- |
| Total Grants |
78,281 |
547,853 |
338,096 |
101,967 |
Notes on grants to KMP:
CEO & MD
Under the 2015 plan:
The Board, on April 13, 2023, based on the recommendations
of the Nomination and Remuneration Committee, approved the grant of performance-based RSUs (Annual performance equity grant) of fair value
of 34.75 crore for fiscal 2024 under the 2015 Plan. These RSUs will vest in line with the employment agreement based on achievement
of certain performance targets. Accordingly, 2,72,026 performance based RSU’s were granted effective May 2, 2023.
The Board, on April 13, 2023, based on the recommendations
of the Nomination and Remuneration Committee, approved the performance-based grant of RSUs (Annual performance equity ESG grant) of fair
value of 2 crore for fiscal 2024 under the 2015 Plan. These RSUs will vest in line with the employment agreement based on achievement
of certain environment, social and governance milestones as determined by the Board. Accordingly, 15,656 performance based RSU’s
were granted effective May 2, 2023.
The Board, on April 13, 2023, based on the recommendations
of the Nomination and Remuneration Committee, approved the performance-based grant of RSUs (Annual performance Equity TSR grant) of fair
value of 5 crore for fiscal 2024 under the 2015 Plan. These RSUs will vest in line with the employment agreement based on Company’s
performance on cumulative relative TSR over the years and as determined by the Board. Accordingly, 39,140 performance based RSU’s
were granted effective May 2, 2023.
Though the annual time based grants and annual performance
equity TSR grant for the remaining employment term ending on March 31, 2027 have not been granted as of June 30, 2023, since the service
commencement date precedes the grant date, the company has recorded employment stock compensation expense in accordance with IFRS 2, Share
based payment. The grant date for this purpose in accordance with IFRS 2, Share based payment is July 1, 2022.
Under the 2019 plan:
The Board, on April 13, 2023, based on the recommendations
of the Nomination and Remuneration Committee, approved performance-based grant of RSUs amounting to 10 crore for fiscal 2024 under
the 2019 Plan. These RSUs will vest based on achievement of certain performance targets. Accordingly, 78,281 performance based RSU’s
were granted effective May 2, 2023.
Other KMP
Under the 2015 plan:
During the three months ended June 30, 2023, based
on recommendations of Nomination and Remuneration Committee, the Board approved 6,774 performance based RSUs to a KMP under the 2015 plan.
The performance based RSUs will vest over three years based on certain performance targets.
The break-up of employee stock compensation expense
is as follows:
(Dollars in millions)
| Particulars |
Three months ended June 30, |
| |
2023 |
2022 |
| Granted to: |
|
|
| KMP |
2 |
2 |
| Employees other than KMP |
16 |
15 |
| Total (1) |
18 |
17 |
| (1) Cash settled stock compensation expense included in the above |
- |
- |
The fair value of the awards are estimated using the
Black-Scholes Model for time and non-market performance based options and Monte Carlo simulation model is used for TSR based options.
The inputs to the model include the share price at
date of grant, exercise price, expected volatility, expected dividends, expected term and the risk free rate of interest. Expected volatility
during the expected term of the options is based on historical volatility of the observed market prices of the Company's publicly traded
equity shares during a period equivalent to the expected term of the options. Expected volatility of the comparative company have been
modelled based on historical movements in the market prices of their publicly traded equity shares during a period equivalent to the expected
term of the options. Correlation coefficient is calculated between each peer entity and the indices as a whole or between each entity
in the peer group.
The fair value of each equity settled award is estimated
on the date of grant using the following assumptions:
| Particulars |
For options granted in |
| |
Fiscal 2024-
Equity Shares-RSU |
Fiscal 2023-
Equity Shares-RSU |
Fiscal 2023-
ADS-RSU |
| Weighted average share price () / ($ ADS) |
1,277 |
1,525 |
18.08 |
| Exercise price ()/ ($ ADS) |
5.00 |
5.00 |
0.07 |
| Expected volatility (%) |
25-31 |
23-32 |
27-34 |
| Expected life of the option (years) |
1-4 |
1-4 |
1-4 |
| Expected dividends (%) |
2-3 |
2-3 |
2-3 |
| Risk-free interest rate (%) |
7 |
5-7 |
2-5 |
| Weighted average fair value as on grant date () / ($ ADS) |
1,113 |
1,210 |
13.69 |
The expected life of the RSU/ESOP is estimated based
on the vesting term and contractual term of the RSU/ESOP, as well as expected exercise behavior of the employee who receives the RSU/ESOP.
2.13 Income Taxes
Accounting policy
Income tax expense comprises current and deferred income
tax. Income tax expense is recognized in net profit in the consolidated statement of comprehensive income except to the extent that it
relates to items recognized directly in equity, in which case it is recognized in equity or other comprehensive income. Current income
tax for current and prior periods is recognized at the amount expected to be paid to or recovered from the tax authorities, using the
tax rates and tax laws that have been enacted or substantively enacted by the Balance Sheet date. Deferred income tax assets and liabilities
are recognized for all temporary differences arising between the tax bases of assets and liabilities and their carrying amounts in the
financial statements except when the deferred income tax arises from the initial recognition of goodwill or an asset or liability in a
transaction that is not a business combination and affects neither accounting nor taxable profit or loss at the time of the transaction.
Deferred tax assets are reviewed at each reporting date and are reduced to the extent that it is no longer probable that the related tax
benefit will be realized.
Deferred income tax assets and liabilities are measured
using tax rates and tax laws that have been enacted or substantively enacted by the Balance Sheet date and are expected to apply to taxable
income in the years in which those temporary differences are expected to be recovered or settled. The effect of changes in tax rates on
deferred income tax assets and liabilities is recognized as income or expense in the period that includes the enactment or the substantive
enactment date. A deferred income tax asset is recognized to the extent that it is probable that future taxable profit will be available
against which the deductible temporary differences and tax losses can be utilized. Deferred income taxes are not provided on the undistributed
earnings of subsidiaries and branches where it is expected that the earnings of the subsidiary or branch will not be distributed in the
foreseeable future.
The Group offsets current tax assets and current tax
liabilities; deferred tax assets and deferred tax liabilities, where it has a legally enforceable right to set off the recognized amounts
and where it intends either to settle on a net basis, or to realize the asset and settle the liability simultaneously. The income tax
provision for the interim period is made based on the best estimate of the annual average tax rate expected to be applicable for the full
financial year. Tax benefits of deductions earned on exercise of employee share options in excess of compensation charged to income are
credited to equity.
Income tax expense in the interim condensed consolidated
statement of comprehensive income comprises:
(Dollars in millions)
| Particulars |
Three months ended June 30, |
| |
2023 |
2022 |
| Current taxes |
|
|
| Domestic taxes |
208 |
215 |
| Foreign taxes |
73 |
87 |
| |
281 |
302 |
| Deferred taxes |
|
|
| Domestic taxes |
23 |
4 |
| Foreign taxes |
(10) |
(27) |
| |
13 |
(23) |
| Income tax expense |
294 |
279 |
Income tax expense for the three months ended June
30, 2023 and June 30, 2022 includes reversals (net of provisions) of $2 million and provisions (net of reversals) of $4 million, respectively.
These provisions and reversals pertaining to prior periods are primarily on account of adjudication of certain disputed matters, upon
filing of tax return and completion of assessments, across various jurisdictions.
Deferred income tax for the three months ended June
30, 2023 and June 30, 2022 substantially relates to origination and reversal of temporary differences.
The Company’s Advanced Pricing Arrangement (APA)
with the Internal Revenue Service (IRS) for US branch income tax expired in March 2021. The Company has applied for renewal of APA and
currently the US taxable income is based on the Company’s best estimate determined based on the expected value method.
As at June 30, 2023, claims against the Group not acknowledged
as debts from the Income tax authorities amounted to $496 million (4,066 crore). As at March 31, 2023, claims against the Group
not acknowledged as debts from the Income tax authorities amounted to $494 million (4,062 crore).
Amount paid to statutory authorities against the tax
claims amounted to $792 million (6,498 crore) and $794 million (6,528 crore) as at June 30, 2023 and March 31, 2023 respectively.
The claims against the group primarily represent demands
arising on completion of assessment proceedings under the Income Tax Act, 1961. These claims are on account of multiple issues of disallowances
such as disallowance of profits earned from STP Units and SEZ Units, disallowance of deductions in respect of employment of new employees
under section 80JJAA, disallowance of expenditure towards software being held as capital in nature, payments made to Associated Enterprises
held as liable for withholding of taxes. These matters are pending before various Income Tax Authorities and the Management including
the Company's tax advisors expect that its position will likely be upheld on ultimate resolution and will not have a material adverse
effect on the Group's financial position and results of operations.
2.14 Basic and diluted shares used in computing
earnings per equity share
Accounting Policy
Basic earnings per equity share is computed by dividing
the net profit attributable to the equity holders of the Group by the weighted average number of equity shares outstanding during the
period. Diluted earnings per equity share is computed by dividing the net profit attributable to the equity holders of the Group by the
weighted average number of equity shares considered for deriving basic earnings per equity share and also the weighted average number
of equity shares that could have been issued upon conversion of all dilutive potential equity shares. The dilutive potential equity shares
are adjusted for the proceeds receivable had the equity shares been actually issued at fair value (i.e. the average market value of the
outstanding equity shares). Dilutive potential equity shares are deemed converted as of the beginning of the period, unless issued at
a later date. Dilutive potential equity shares are determined independently for each period presented.
The number of equity shares and potentially dilutive
equity shares are adjusted retrospectively for all periods presented for any share splits and bonus shares issues including for changes
effected prior to the approval of the financial statements by the Board of Directors.
2.15 Related party transactions
Refer Note 2.20 "Related party transactions"
in the Company’s 2023 Annual Report on Form 20-F for the full names and other details of the Company's subsidiaries and controlled
trusts.
Changes in Subsidiaries
During the three months ended June 30, 2023, there
are no changes in the subsidiaries.
Changes in key management personnel
The following are the changes in the key management
personnel:
Independent directors:
-Helene Auriol Potier (appointed as independent director
effective May 26, 2023)
Executive Officers:
-Mohit Joshi (resigned as President effective March
11, 2023 and was on leave till June 9, 2023 which was his last date with the company)
Transactions with key management personnel
The table below describes the related party transactions
with key management personnel which comprise directors and executive officers:
(Dollars in millions)
| |
Three months ended |
| Particulars |
June 30, 2023 |
June 30, 2022 |
| Salaries and other short term employee benefits to whole-time directors and executive officers(1)(2) |
4 |
4 |
| Commission and other benefits to non-executive/ independent directors |
– |
– |
| Total |
4 |
4 |
| (1) | | Total employee stock compensation expense for the three months ended June 30, 2023 and
June 30, 2022 includes a charge of $2 million each, towards key managerial personnel. (Refer note 2.12) |
| (2) | | Does not include post-employment benefits and other long-term benefits, based on actuarial
valuation as these are done for the Company as a whole. |
2.16 Segment reporting
IFRS 8 Operating Segments establishes standards for
the way that public business enterprises report information about operating segments and related disclosures about products and services,
geographic areas, and major customers. The Group's operations predominantly relate to providing end-to-end business solutions to enable
clients to enhance business performance.
The Chief Operating Decision Maker (CODM) evaluates
the Group's performance and allocates resources based on an analysis of various performance indicators by business segments. Accordingly,
information has been presented along business segments. The accounting principles used in the preparation of the financial statements
are consistently applied to record revenue and expenditure in individual segments, and are as set out in the accounting policies.
Business segments of the Group are primarily enterprises
in Financial Services and Insurance, enterprises in Manufacturing, enterprises in Retail, Consumer Packaged Goods and Logistics, enterprises
in the Energy, Utilities, Resources and Services, enterprises in Communication, Telecom OEM and Media, enterprises in Hi-Tech, enterprises
in Life Sciences and Healthcare and all other segments. The Financial services reportable segments has been aggregated to include the
Financial Services operating segment and Finacle operating segment because of the similarity of the economic characteristics. All other
segments represent the operating segments of businesses in India, Japan, China, Infosys Public Services & other enterprises in Public
Services.
Revenue and identifiable operating expenses in relation
to segments are categorized based on items that are individually identifiable to that segment. Revenue for 'all other segments' represents
revenue generated by Infosys Public Services and revenue generated from customers located in India, Japan and China and other enterprises
in public service. Allocated expenses of segments include expenses incurred for rendering services from the Group's offshore software
development centers and on-site expenses, which are categorized in relation to the associated efforts of the segment. Certain expenses
such as depreciation and amortization, which form a significant component of total expenses, are not specifically allocable to specific
segments as the underlying assets are used interchangeably. The Management believes that it is not practical to provide segment disclosures
relating to those costs and expenses, and accordingly these expenses are separately disclosed as "unallocated" and adjusted
against the total income of the Group.
Assets and liabilities used in the Group's business
are not identified to any of the reportable segments, as these are used interchangeably between segments. The Management believes that
it is currently not practicable to provide segment disclosures relating to total assets and liabilities since a meaningful segregation
of the available data is onerous.
Business segment revenue information is collated based
on individual customers invoiced or in relation to which the revenue is otherwise recognized.
Disclosure of revenue by geographic locations is given
in note 2.17 Revenue from operations.
2.16.1 Business segments
For the three months ended June 30, 2023 and June
30, 2022
(Dollars in millions)
| Particulars |
Financial
Services(1) |
Retail(2) |
Communication(3) |
Energy,
Utilities,
Resources and
Services |
Manufacturing |
Hi-Tech |
Life
Sciences(4) |
All other
segments(5) |
Total |
| Revenue |
1,298 |
671 |
540 |
595 |
651 |
372 |
335 |
155 |
4,617 |
| |
1,362 |
645 |
576 |
549 |
537 |
363 |
291 |
121 |
4,444 |
| Identifiable operating expenses |
748 |
349 |
321 |
327 |
429 |
212 |
194 |
100 |
2,680 |
| |
756 |
326 |
370 |
294 |
383 |
216 |
172 |
85 |
2,602 |
| Allocated expenses |
240 |
124 |
99 |
111 |
104 |
62 |
55 |
38 |
833 |
| |
252 |
122 |
103 |
108 |
105 |
60 |
50 |
31 |
831 |
| Segment Profit |
310 |
198 |
120 |
157 |
118 |
98 |
86 |
17 |
1,104 |
| |
354 |
197 |
103 |
147 |
49 |
87 |
69 |
5 |
1,011 |
| Unallocable expenses |
|
|
|
|
|
|
|
|
143 |
| |
|
|
|
|
|
|
|
|
123 |
| Operating profit |
|
|
|
|
|
|
|
|
961 |
| |
|
|
|
|
|
|
|
|
888 |
| Other income, net (Refer to note 2.20) |
|
|
|
|
|
|
|
|
68 |
| |
|
|
|
|
|
|
|
|
87 |
| Finance Cost |
|
|
|
|
|
|
|
|
11 |
| |
|
|
|
|
|
|
|
|
7 |
| Profit before income taxes |
|
|
|
|
|
|
|
|
1,018 |
| |
|
|
|
|
|
|
|
|
968 |
| Income tax expense |
|
|
|
|
|
|
|
|
294 |
| |
|
|
|
|
|
|
|
|
279 |
| Net profit |
|
|
|
|
|
|
|
|
724 |
| |
|
|
|
|
|
|
|
|
689 |
| Depreciation and amortization |
|
|
|
|
|
|
|
|
143 |
| |
|
|
|
|
|
|
|
|
123 |
| Non-cash expenses other than depreciation and amortization |
|
|
|
|
|
|
|
|
– |
| |
|
|
|
|
|
|
|
|
|
|
– |
| (1) | | Financial Services include enterprises in Financial Services and Insurance |
| (2) | | Retail includes enterprises in Retail, Consumer Packaged Goods and Logistics |
| (3) | | Communication includes enterprises in Communication, Telecom OEM and Media |
| (4) | | Life Sciences includes enterprises in Life sciences and Health care |
| (5) | | Others include operating segments of businesses in India, Japan, China, Infosys Public
Services & other enterprises in Public Services |
2.16.2 Significant clients
No client individually accounted for more than 10%
of the Revenue for the three months ended June 30, 2023 and June 30, 2022, respectively.
2.17 Revenue from Operations
Accounting Policy:
The Group derives revenues primarily from IT services
comprising software development and related services, cloud and infrastructure services, maintenance, consulting and package implementation,
licensing of software products and platforms across the Group’s core and digital offerings (together called as “software related
services”) and business process management services. Contracts with customers are either on a time-and-material, unit of work, fixed-price
or on a fixed-timeframe basis.
Revenues from customer contracts are considered for
recognition and measurement when the contract has been approved in writing, by the parties, to the contract, the parties to contract are
committed to perform their respective obligations under the contract, and the contract is legally enforceable. Revenue is recognized upon
transfer of control of promised products or services (“performance obligations”) to customers in an amount that reflects the
consideration the Group has received or expects to receive in exchange for these products or services (“transaction price”).
When there is uncertainty as to collectability, revenue recognition is postponed until such uncertainty is resolved.
The Group assesses the services promised in a contract
and identifies distinct performance obligations in the contract. The Group allocates the transaction price to each distinct performance
obligation based on the relative standalone selling price. The price that is regularly charged for an item when sold separately is the
best evidence of its standalone selling price. In the absence of such evidence, the primary method used to estimate standalone selling
price is the expected cost plus a margin, under which the Group estimates the cost of satisfying the performance obligation and then adds
an appropriate margin based on similar services.
The Group’s contracts may include variable consideration
including rebates, volume discounts and penalties. The Group includes variable consideration as part of transaction price when there is
a basis to reasonably estimate the amount of the variable consideration and when it is probable that a significant reversal of cumulative
revenue recognized will not occur when the uncertainty associated with the variable consideration is resolved.
Revenue on time-and-material and unit of work based
contracts, are recognized as the related services are performed. Fixed price maintenance revenue is recognized ratably either on a straight-line
basis when services are performed through an indefinite number of repetitive acts over a specified period or ratably using a percentage
of completion method when the pattern of benefits from the services rendered to the customer and Group’s costs to fulfil the contract
is not even through the period of contract because the services are generally discrete in nature and not repetitive. Revenue from other
fixed-price, fixed-timeframe contracts, where the performance obligations are satisfied over time is recognized using the percentage-of-completion
method. Efforts or costs expended are used to determine progress towards completion as there is a direct relationship between input and
productivity. Progress towards completion is measured as the ratio of costs or efforts incurred to date (representing work performed)
to the estimated total costs or efforts. Estimates of transaction price and total costs or efforts are continuously monitored over the
term of the contracts and are recognized in net profit in the period when these estimates change or when the estimates are revised. Revenues
and the estimated total costs or efforts are subject to revision as the contract progresses. Provisions for estimated losses, if any,
on incomplete contracts are recorded in the period in which such losses become probable based on the estimated efforts or costs to complete
the contract.
The billing schedules agreed with customers include
periodic performance based billing and / or milestone based progress billings. Revenues in excess of billing are classified as unbilled
revenue while billing in excess of revenues are classified as contract liabilities (which we refer to as unearned revenues).
In arrangements for software development and related
services and maintenance services, by applying the revenue recognition criteria for each distinct performance obligation, the arrangements
with customers generally meet the criteria for considering software development and related services as distinct performance obligations.
For allocating the transaction price, the Group measures the revenue in respect of each performance obligation of a contract at its relative
standalone selling price. The price that is regularly charged for an item when sold separately is the best evidence of its standalone
selling price. In cases where the Group is unable to determine the standalone selling price, the Group uses the expected cost plus margin
approach in estimating the standalone selling price. For software development and related services, the performance obligations are satisfied
as and when the services are rendered since the customer generally obtains control of the work as it progresses.
Certain cloud and infrastructure services contracts
include multiple elements which may be subject to other specific accounting guidance, such as leasing guidance. These contracts are accounted
in accordance with such specific accounting guidance. In such arrangements where the Group is able to determine that hardware and services
are distinct performance obligations, it allocates the consideration to these performance obligations on a relative standalone selling
price basis. In the absence of standalone selling price, the Group uses the expected cost-plus margin approach in estimating the standalone
selling price. When such arrangements are considered as a single performance obligation, revenue is recognized over the period and measure
of progress is determined based on promise in the contract.
Revenue from licenses where the customer obtains a
“right to use” the licenses is recognized at the time the license is made available to the customer. Revenue from licenses
where the customer obtains a “right to access” is recognized over the access period.
Arrangements to deliver software products generally
have three elements: license, implementation and Annual Technical Services (ATS).When implementation services are provided in conjunction
with the licensing arrangement and the license and implementation have been identified as two distinct separate performance obligations,
the transaction price for such contracts are allocated to each performance obligation of the contract based on their relative standalone
selling prices. In the absence of standalone selling price for implementation, the Group uses the expected cost plus margin approach in
estimating the standalone selling price. Where the license is required to be substantially customized as part of the implementation service
the entire arrangement fee for license and implementation is considered to be a single performance obligation and the revenue is recognized
using the percentage-of-completion method as the implementation is performed. Revenue from client training, support and other services
arising due to the sale of software products is recognized as the performance obligations are satisfied. ATS revenue is recognized ratably
on a straight-line basis over the period in which the services are rendered.
Contracts with customers includes subcontractor services
or third-party vendor equipment or software in certain integrated services arrangements. In these types of arrangements, revenue from
sales of third-party vendor products or services is recorded net of costs when the Group is acting as an agent between the customer and
the vendor, and gross when the Group is the principal for the transaction. In doing so, the group first evaluates whether it controls
the good or service before it is transferred to the customer. The Group considers whether it has the primary obligation to fulfil the
contract, inventory risk, pricing discretion and other factors to determine whether it controls the goods or service and therefore is
acting as a principal or an agent.
The incremental costs of obtaining a contract (i.e.,
costs that would not have been incurred if the contract had not been obtained) are recognized as an asset if the Group expects to recover
them.
Certain eligible, nonrecurring costs (e.g. set-up or
transition or transformation costs) that do not represent a separate performance obligation are recognized as an asset when such costs
(a) relate directly to the contract; (b) generate or enhance resources of the Group that will be used in satisfying the performance obligation
in the future; and (c) are expected to be recovered.
Capitalized contract costs relating to upfront payments
to customers are amortized to revenue and other capitalized costs are amortized to cost of sales over the respective contract life on
a systematic basis consistent with the transfer of goods or services to customer to which the asset relates. Capitalized costs are monitored
regularly for impairment. Impairment losses are recorded when present value of projected remaining operating cash flows is not sufficient
to recover the carrying amount of the capitalized costs.
The Group presents revenues net of indirect taxes in
its Consolidated Statement of Comprehensive Income.
Revenues for the three months ended June 30, 2023 and
June 30, 2022 is as follows:
(Dollars in millions)
| Particulars |
Three months ended June 30, |
| |
2023 |
2022 |
| Revenue from software services |
4,349 |
4,162 |
| Revenue from products and platforms |
268 |
282 |
| Total revenue from operations |
4,617 |
4,444 |
Products & platforms
The Group also derives revenues from the sale of products
and platforms including Finacle – core banking solution, Edge Suite of products, Panaya platform, Infosys Equinox, Infosys Helix,
Infosys Applied AI, Infosys Cortex, Stater digital platform and Infosys McCamish – insurance platform.
Disaggregated revenue information
Revenue disaggregation by business segments has been
included in segment information (Refer note 2.16). The table below presents disaggregated revenues from contracts with customers by geography
and contract type. The Group believes that this disaggregation best depicts how the nature, amount, timing and uncertainty of revenues
and cash flows are affected by industry, market and other economic factors.
Three months ended June 30, 2023 and June 30, 2022
(Dollars in millions)
| Particulars |
Three months ended June 30, |
| |
2023 |
2022 |
| Revenues by Geography* |
|
|
| North America |
2,809 |
2,747 |
| Europe |
1,235 |
1,114 |
| India |
125 |
114 |
| Rest of the world |
448 |
469 |
| Total |
4,617 |
4,444 |
| * | | Geographical revenues is based on the domicile of customer. |
The percentage of revenue from fixed-price contracts
for each of the quarter ended June 30, 2023 and June 30, 2022 is 52%.
Trade Receivables and Contract Balances
The timing of revenue recognition, billings and cash
collections results in receivables, unbilled revenue, and unearned revenue on the Group’s Consolidated Balance Sheet. Amounts are
billed as work progresses in accordance with agreed-upon contractual terms, either at periodic intervals (e.g., monthly or quarterly)
or upon achievement of contractual milestones.
The Group’s receivables are rights to consideration
that are unconditional. Unbilled revenues comprising revenues in excess of billings from time and material contracts and fixed price maintenance
contracts are classified as financial asset when the right to consideration is unconditional and is due only after a passage of time.
Invoicing to the clients for other fixed price contracts
is based on milestones as defined in the contract and therefore the timing of revenue recognition is different from the timing of invoicing
to the customers. Therefore, unbilled revenues for other fixed price contracts (contract asset) are classified as non-financial asset
because the right to consideration is dependent on completion of contractual milestones.
Invoicing in excess of earnings are classified as unearned
revenue.
Trade receivable and unbilled revenues are presented
net of impairment in the consolidated statement of balance sheet.
2.18 Unbilled Revenue
(Dollars in millions)
| Particulars |
As at |
| |
June 30, 2023 |
March 31, 2023 |
| Unbilled financial asset (1) |
1,100 |
1,157 |
| Unbilled non financial asset (2) |
851 |
880 |
| Total |
1,951 |
2,037 |
| (1) | | Right to consideration is unconditional and is due only after a passage of time. |
| (2) | | Right to consideration is dependent on completion of contractual milestones. |
2.19 Equity
Accounting policy
Ordinary Shares
Ordinary shares are classified as equity. Incremental
costs directly attributable to the issuance of new ordinary shares, share options and buyback are recognized as a deduction from equity,
net of any tax effects.
Treasury Shares
When any entity within the Group purchases the company's
ordinary shares, the consideration paid including any directly attributable incremental cost is presented as a deduction from total equity,
until they are cancelled, sold or reissued. When treasury shares are sold or reissued subsequently, the amount received is recognized
as an increase in equity, and the resulting surplus or deficit on the transaction is transferred to/ from Share premium.
Description of reserves
Retained earnings
Retained earnings represent the amount of accumulated
earnings of the Group.
Share premium
The amount received in excess of the par value of equity
shares has been classified as share premium. Additionally, share-based compensation recognized in net profit in the interim condensed
consolidated statement of comprehensive income is credited to share premium. Amounts have been utilized for bonus issue and share buyback
from share premium account.
Special Economic Zone Re-investment reserve
The Special Economic Zone Re-investment reserve has
been created out of the profit of the eligible SEZ unit in terms of the provisions of Sec 10AA (1)(ii) of Income Tax Act, 1961. The reserve
should be utilized by the Company for acquiring new plant and machinery for the purpose of its business in terms of the provisions of
the Sec 10AA (2) of the Income Tax Act, 1961.
Capital Redemption Reserve
In accordance with section 69 of the Indian Companies
Act, 2013, the Company creates capital redemption reserve equal to the nominal value of the shares bought back as an appropriation from
general reserve / retained earnings.
Other components of equity
Other components of equity include currency translation,
re-measurement of net defined benefit liability/asset, fair value changes of equity instruments fair valued through other comprehensive
income, changes on fair valuation of investments, net of taxes.
Cash flow hedge reserve
When a derivative is designated as a cash flow hedging
instrument, the effective portion of changes in the fair value of the derivative is recognized in other comprehensive income and accumulated
in the cash flow hedging reserve. The cumulative gain or loss previously recognized in the cash flow hedging reserve is transferred to
the net profit in the consolidated Statement of Comprehensive Income upon the occurrence of the related forecasted transaction.
2.19.1 Capital allocation policy
Effective fiscal 2020, the company expects to return
approximately 85% of the free cash flow cumulatively over a 5-year period through a combination of semi annual dividends and/or share
buyback and/or special dividends, subject to applicable laws and requisite approvals, if any. Free cash flow is defined as net cash provided
by operating activities less capital expenditure as per the consolidated statement of cash flows prepared under IFRS. Dividend and buyback
include applicable taxes.
The Company’s objective when managing capital
is to safeguard its ability to continue as a going concern and to maintain an optimal capital structure so as to maximize shareholder
value. In order to maintain or achieve an optimal capital structure, the Company may adjust the amount of dividend payment, return capital
to shareholders, issue new shares or buy back issued shares. As of June 30, 2023, the Company has only one class of equity shares and
has no debt. Consequent to the above capital structure there are no externally imposed capital requirements.
2.19.2 Dividend
The final dividend on shares is recorded as a liability
on the date of approval by the shareholders and interim dividends are recorded as a liability on the date of declaration by the Company's
Board of Directors. Income tax consequences of dividends on financial instruments classified as equity will be recognized according to
where the entity originally recognized those past transactions or events that generated distributable profits.
The Company declares and pays dividends in Indian rupees.
Companies are required to pay/distribute dividend after deducting applicable taxes. The remittance of dividends outside India is governed
by Indian law on foreign exchange and is also subject to withholding tax at applicable rates.
The amount of per share dividend recognized as distribution
to equity shareholders in accordance with Companies Act 2013 is as follows:
| Particulars |
Three months ended June 30, 2023 |
Three months ended June 30, 2022 |
| |
in |
in US Dollars |
in |
in US Dollars |
| Final dividend for fiscal 2022 |
– |
– |
16.00 |
0.21 |
| Final dividend for fiscal 2023 |
17.50 |
0.21 |
– |
– |
The Board of Directors in their meeting held on April
13, 2023 recommended a final dividend of 17.50/- per equity share (approximately $0.21 per equity share) for the financial year
ended March 31, 2023. The same was approved by the shareholders at the Annual General Meeting (AGM) of the Company held on June 28, 2023
which will result in a net cash outflow of 7,242 crore (approximately $882 million), excluding dividend paid on treasury shares.
Payment date for the dividend is July 3, 2023.
2.19.3 Share capital and share premium
The Company has only one class of shares referred to
as equity shares having a par value of 5/- each. 11,738,357 shares and 12,172,119 shares were held by controlled trust, as at June
30, 2023 and March 31, 2023, respectively.
2.20 Break-up of expenses and other income, net
Accounting policy
2.20.1 Gratuity and Pensions
The Group provides for gratuity, a defined benefit
retirement plan ('the Gratuity Plan') covering eligible employees majorly of Infosys and its Indian subsidiaries. The Gratuity Plan provides
a lump-sum payment to vested employees at retirement, death, incapacitation or termination of employment, of an amount based on the respective
employee's salary and the tenure of employment with the Group. The Company contributes Gratuity liabilities to the Infosys Limited Employees'
Gratuity Fund Trust (the Trust). In case of Infosys BPM and EdgeVerve, contributions are made to the Infosys BPM Employees' Gratuity Fund
Trust and EdgeVerve Systems Limited Employees' Gratuity Fund Trust, respectively. Trustees administer contributions made to the Trusts
and contributions are invested in a scheme with the Life Insurance Corporation of India as permitted by Indian law.
The Group operates defined benefit pension plan in
certain overseas jurisdictions, in accordance with the local laws. These plans are managed by third party fund managers. The plans provide
for periodic payouts after retirement or for a lumpsum payment as set out in rules of each fund and includes death and disability benefits.
The defined benefit plans require contributions which are based on a percentage of salary that varies depending on the age of the respective
employees.
Liabilities with regard to these defined benefit plans
are determined by actuarial valuation, performed by an independent actuary, at each Balance Sheet date using the projected unit credit
method. These defined benefit plans expose the Group to actuarial risks, such as longevity risk, interest rate risk and market risk.
The Group recognizes the net obligation of a defined
benefit plan in its Balance Sheet as an asset or liability. Gains and losses through re-measurements of the net defined benefit liability/(asset)
are recognized in other comprehensive income and are not reclassified to profit or loss in subsequent periods. The actual return of the
portfolio of plan assets, in excess of the yields computed by applying the discount rate used to measure the defined benefit obligation
is recognized in other comprehensive income. The effect of any plan amendments is recognized in net profits in the consolidated statement
of comprehensive income.
2.20.2 Superannuation
Certain employees of Infosys, Infosys BPM and EdgeVerve
are participants in a defined contribution plan. The Group has no further obligations to the Plan beyond its monthly contributions which
are periodically contributed to a trust fund, the corpus of which is invested with the Life Insurance Corporation of India.
2.20.3 Provident fund
Eligible employees of Infosys receive benefits from
a provident fund, which is a defined benefit plan. Both the eligible employee and the company make monthly contributions to the provident
fund plan equal to a specified percentage of the covered employee's salary. The company contributes a portion of the contributions to
the Infosys Limited Employees' Provident Fund Trust. The trust invests in specific designated instruments as permitted by Indian law.
The remaining portion is contributed to the government administered pension fund. The rate at which the annual interest is payable to
the beneficiaries by the trust is being administered by the Government of India. The company has an obligation to make good the shortfall,
if any, between the return from the investments of the Trust and the notified interest rate.
In respect of Indian subsidiaries, eligible employees
receive benefits from a provident fund, which is a defined contribution plan. Both the eligible employee and the respective companies
make monthly contributions to this provident fund plan equal to a specified percentage of the covered employee's salary. Amounts collected
under the provident fund plan are deposited in a government administered provident fund. The companies have no further obligation to the
plan beyond its monthly contributions.
2.20.4 Compensated absences
The Group has a policy on compensated absences which
are both accumulating and non-accumulating in nature. The expected cost of accumulating compensated absences is determined by actuarial
valuation performed by an independent actuary at each balance sheet date using projected unit credit method on the additional amount expected
to be paid/availed as a result of the unused entitlement that has accumulated at the balance sheet date. Expense on non-accumulating compensated
absences is recognized in the period in which the absences occur.
2.20.5 Other income, net
Other income is comprised primarily of interest income,
dividend income, gain/loss on investment and exchange gain/loss on forward and options contracts and on translation of foreign currency
assets and liabilities. Interest income is recognized using the effective interest method. Dividend income is recognized when the right
to receive payment is established.
2.20.6 Foreign Currency
Functional currency and presentation currency
The functional currency of Infosys, Infosys BPM, EdgeVerve,
Skava and controlled trusts is the Indian rupee. The functional currencies for foreign subsidiaries are their respective local currencies.
These financial statements are presented in U.S. dollars (rounded off to the nearest million) to facilitate the investors’ ability
to evaluate Infosys’ performance and financial
position in comparison to similar companies domiciled in other geographic locations.
Transactions and translations
Foreign-currency denominated monetary assets and liabilities
are translated into the relevant functional currency at exchange rates in effect at the Balance Sheet date. The gains or losses resulting
from such translations are recognized in the interim condensed Consolidated Statement of Comprehensive Income and reported within exchange
gains/ (losses) on translation of assets and liabilities, net, except when deferred in Other Comprehensive Income as qualifying cash flow
hedges. Non-monetary assets and non-monetary liabilities denominated in a foreign currency and measured at fair value are translated at
the exchange rate prevalent at the date when the fair value was determined. Non-monetary assets and non-monetary liabilities denominated
in a foreign currency and measured at historical cost are translated at the exchange rate prevalent at the date of transaction. The related
revenue and expense are recognised using the same exchange rate.
Transaction gains or losses realized upon settlement
of foreign currency transactions are included in determining net profit for the period in which the transaction is settled. Revenue, expense
and cash-flow items denominated in foreign currencies are translated into the relevant functional currencies using the exchange rate in
effect on the date of the transaction.
The translation of financial statements of the foreign
subsidiaries to the presentation currency is performed for assets and liabilities using the exchange rate in effect at the Balance Sheet
date and for revenue, expense and cash-flow items using the average exchange rate for the respective periods. The gains or losses resulting
from such translation are included in currency translation reserves under other components of equity. When a subsidiary is disposed off,
in full, the relevant amount is transferred to net profit in the Statement of Comprehensive Income. However, when a change in the parent's
ownership does not result in loss of control of a subsidiary, such changes are recorded through equity.
Other Comprehensive Income, net of taxes includes translation
differences on non-monetary financial assets measured at fair value at the reporting date, such as equities classified as financial instruments
and measured at fair value through other comprehensive income (FVOCI).
Goodwill and fair value adjustments arising on the
acquisition of a foreign entity are treated as assets and liabilities of the foreign entity and translated at the exchange rate in effect
at the Balance Sheet date.
2.20.7 Government grants
The Group recognizes government grants only when there
is reasonable assurance that the conditions attached to them shall be complied with, and the grants will be received. Government grants
related to assets are treated as deferred income and are recognized in the net profit in the statement of comprehensive income on a systematic
and rational basis over the useful life of the asset. Government grants related to revenue are recognized on a systematic basis in the
statement of comprehensive income over the periods necessary to match them with the related costs which they are intended to compensate.
2.20.8 Operating Profits
Operating profit of the Group is computed considering
the revenues, net of cost of sales, selling and marketing expenses and administrative expenses.
The table below provides details of break-up of
expenses:
Cost of sales
(Dollars in millions)
| Particulars |
Three months ended June 30 |
| |
2023 |
2022 |
| Employee benefit costs |
2,280 |
2,146 |
| Depreciation and amortization |
143 |
123 |
| Travelling costs |
39 |
33 |
| Cost of technical sub-contractors |
380 |
504 |
| Cost of software packages for own use |
57 |
52 |
| Third party items bought for service delivery to clients |
271 |
254 |
| Short-term leases (Refer to note 2.9) |
1 |
1 |
| Consultancy and professional charges |
4 |
3 |
| Communication costs |
11 |
12 |
| Repairs and maintenance |
14 |
14 |
| Provision for post-sales client support |
6 |
1 |
| Others |
5 |
1 |
| Total |
3,211 |
3,144 |
Selling and marketing expenses
(Dollars in millions)
| Particulars |
Three months ended June 30 |
| |
2023 |
2022 |
| Employee benefit costs |
168 |
145 |
| Travelling costs |
11 |
10 |
| Branding and marketing |
32 |
29 |
| Consultancy and professional charges |
4 |
4 |
| Others |
2 |
5 |
| Total |
217 |
193 |
Administrative expenses
(Dollars in millions)
| Particulars |
Three months ended June 30 |
| |
2023 |
2022 |
| Employee benefit costs |
81 |
76 |
| Consultancy and professional charges |
35 |
52 |
| Repairs and maintenance |
30 |
28 |
| Power and fuel |
6 |
5 |
| Communication costs |
11 |
10 |
| Travelling costs |
7 |
6 |
| Rates and taxes |
11 |
10 |
| Short-term leases (Refer to note 2.9) |
1 |
1 |
| Insurance charges |
6 |
5 |
| Impairment loss recognized/(reversed) under expected credit loss model |
11 |
6 |
| Contribution towards Corporate Social Responsibility |
9 |
8 |
| Others |
20 |
12 |
| Total |
228 |
219 |
Other income for the three months ended June 30,
2023 and June 30, 2022 is as follows:
(Dollars in millions)
| Particulars |
Three months ended June 30 |
| |
2023 |
2022 |
| Interest income on financial assets carried at amortized cost |
33 |
31 |
| Interest income on financial assets carried at fair value through other comprehensive income |
30 |
31 |
| Gain/(loss) on investments carried at fair value through profit or loss |
6 |
1 |
| Exchange gains / (losses) on forward and options contracts |
16 |
(37) |
| Exchange gains / (losses) on translation of other assets and liabilities |
(17) |
53 |
| Others |
- |
8 |
| Total |
68 |
87 |
for and on behalf of the Board of Directors of Infosys
Limited
|
Nandan M. Nilekani
Chairman |
Salil Parekh
Chief Executive Officer and Managing Director
|
Bobby Parikh
Director |
| |
|
|
|
Nilanjan Roy
Chief Financial Officer |
Jayesh Sanghrajka
Executive Vice President and Deputy Chief Financial Officer
|
A.G.S. Manikantha
Company Secretary |
| |
|
|
|
Bengaluru
July 20, 2023 |
|
|
Exhibit 99.8
IFRS INR Earning Release
INDEPENDENT AUDITOR’S REPORT
TO THE BOARD OF DIRECTORS OF INFOSYS LIMITED
Report on the Audit of the Interim Condensed
Consolidated Financial Statements
Opinion
We have audited the accompanying interim condensed
consolidated financial statements of INFOSYS LIMITED (the “Company”) and its subsidiaries (the Company and its subsidiaries
together referred to as the “Group”), which comprise the Condensed Consolidated Balance Sheet as at June 30, 2023, the Condensed
Consolidated Statement of Comprehensive Income, the Condensed Consolidated Statement of Changes in Equity and the Condensed Consolidated
Statement of Cash Flows for the three months ended on that date, and a summary of the significant accounting policies and other explanatory
information (hereinafter referred to as the “interim condensed consolidated financial statements”).
In our opinion and to the best of our information
and according to the explanations given to us, the aforesaid interim condensed consolidated financial statements give a true and fair
view in conformity with International Accounting Standard 34 “Interim Financial Reporting” (“IAS 34”) as issued
by the International Accounting Standards Board (“IASB”), of the consolidated state of affairs of the Group as at June 30,
2023, and their consolidated profit, their consolidated total comprehensive income, their consolidated changes in equity and their consolidated
cash flows for the three months ended on that date.
Basis for Opinion
We conducted our audit of the interim condensed
consolidated financial statements in accordance with the Standards on Auditing (“SA”s) issued by the Institute of Chartered
Accountants of India (“ICAI”). Our responsibilities under those Standards are further described in the Auditor’s Responsibilities
for the Audit of the Interim Condensed Consolidated Financial Statements section of our report. We are independent of the Group in accordance
with the Code of Ethics issued by the ICAI, and we have fulfilled our other ethical responsibilities in accordance with the Code of Ethics.
We believe that the audit evidence obtained by us is sufficient and appropriate to provide a basis for our audit opinion on the interim
condensed consolidated financial statements.
Responsibilities of Management and Those
Charged with Governance for the Interim Condensed Consolidated Financial Statements
The Company’s Board of Directors is responsible
for the preparation and presentation of these interim condensed consolidated financial statements that give a true and fair view of the
consolidated financial position, consolidated financial performance, consolidated total comprehensive income, consolidated changes in
equity and consolidated cash flows of the Group in accordance with IAS 34 as issued by the IASB. The respective Boards of Directors of
the companies included in the Group are responsible for maintenance of the adequate accounting records for safeguarding assets of the
Group and for preventing and detecting frauds and other irregularities; selection and application of appropriate accounting policies;
making judgments and estimates that are reasonable and prudent; and design, implementation and maintenance of adequate internal financial
controls, that were operating effectively for ensuring the accuracy and completeness of the accounting records, relevant to the preparation
and presentation of the interim condensed consolidated financial statements that give a true and fair view and are free from material
misstatement, whether due to fraud or error which have been used for the purpose of preparation of the interim condensed consolidated
financial statements by the Directors of the Company, as aforesaid.
In preparing the interim condensed consolidated
financial statements, the respective Boards of Directors of the companies included in the Group are responsible for assessing the ability
of the respective entities to continue as a going concern, disclosing, as applicable, matters related to going concern and using the going
concern basis of accounting unless the respective Boards of Directors either intend to liquidate their respective entities or to cease
operations, or has no realistic alternative but to do so.
The respective Boards of Directors of the companies
included in the Group are responsible for overseeing the financial reporting process of the Group.
Auditor’s Responsibilities for the
Audit of the Interim Condensed Consolidated Financial Statements
Our objectives are to obtain reasonable assurance
about whether the interim condensed consolidated financial statements as a whole are free from material misstatement, whether due to fraud
or error, and to issue an auditor’s report that includes our opinion. Reasonable assurance is a high level of assurance, but is
not a guarantee that an audit conducted in accordance with SAs will always detect a material misstatement when it exists. Misstatements
can arise from fraud or error and are considered material if, individually or in the aggregate, they could reasonably be expected to influence
the economic decisions of users taken on the basis of these interim condensed consolidated financial statements.
As part of an audit in accordance with SAs, we
exercise professional judgment and maintain professional scepticism throughout the audit. We also:
| • | | Identify and assess the risks of material misstatement of the interim condensed consolidated
financial statements, whether due to fraud or error, design and perform audit procedures responsive to those risks, and obtain audit
evidence that is sufficient and appropriate to provide a basis for our opinion. The risk of not detecting a material misstatement resulting
from fraud is higher than for one resulting from error, as fraud may involve collusion, forgery, intentional omissions, misrepresentations,
or the override of internal control. |
| • | | Obtain an understanding of internal financial controls relevant to the audit in order to
design audit procedures that are appropriate in the circumstances, but not for the purpose of expressing an opinion on effectiveness
of such controls. |
| • | | Evaluate the appropriateness of accounting policies used and the reasonableness of accounting
estimates and related disclosures made by management. |
| • | | Conclude on the appropriateness of management’s use of the going concern basis of accounting
and, based on the audit evidence obtained, whether a material uncertainty exists related to events or conditions that may cast significant
doubt on the ability of the Group to continue as a going concern. If we conclude that a material uncertainty exists, we are required
to draw attention in our auditor’s report to the related disclosures in the interim condensed consolidated financial statements
or, if such disclosures are inadequate, to modify our opinion. Our conclusions are based on the audit evidence obtained up to the date
of our auditor’s report. However, future events or conditions may cause the Group to cease to continue as a going concern. |
| • | | Evaluate the overall presentation, structure and content of the interim condensed consolidated
financial statements, including the disclosures, and whether the interim condensed consolidated financial statements represent the underlying
transactions and events in a manner that achieves fair presentation. |
| • | | Obtain sufficient appropriate audit evidence regarding the financial information of the entities
within the Group to express an opinion on the interim condensed consolidated financial statements. We are responsible for the direction,
supervision and performance of the audit of the financial statements of such entities included in the interim condensed consolidated
financial statements of which we are the independent auditors. |
Materiality is the magnitude of misstatements
in the interim condensed consolidated financial statements that, individually or in aggregate, makes it probable that the economic decisions
of a reasonably knowledgeable user of the interim condensed consolidated financial statements may be influenced. We consider quantitative
materiality and qualitative factors in (i) planning the scope of our audit work and in evaluating the results of our work; and (ii) to
evaluate the effect of any identified misstatements in the interim condensed consolidated financial statements.
We communicate with those charged with governance
of the Company and such other entities included in the interim condensed consolidated financial statements of which we are the independent
auditors regarding, among other matters, the planned scope and timing of the audit and significant audit findings including any significant
deficiencies in internal control that we identify during our audit.
We also provide those charged with governance
with a statement that we have complied with relevant ethical requirements regarding independence, and to communicate with them all relationships
and other matters that may reasonably be thought to bear on our independence, and where applicable, related safeguards.
|
Place: Bengaluru
Date: July 20, 2023 |
For DELOITTE HASKINS & SELLS LLP
Chartered Accountants
(Firm’s Registration No. 117366W/W-100018)
Sanjiv V. Pilgaonkar
Partner
(Membership No.039826)
UDIN: 23039826BGXSAP7367 |
INFOSYS LIMITED AND SUBSIDIARIES
Condensed Consolidated Financial Statements under International Financial Reporting Standards (IFRS) in Indian Rupee for the three months ended June 30, 2023
| Index |
| Condensed Consolidated Balance Sheet |
| Condensed Consolidated Statement of Comprehensive Income |
| Condensed Consolidated Statement of Changes in Equity |
| Condensed Consolidated Statement of Cash Flows |
| Overview and Notes to the Interim Condensed Consolidated Financial Statements |
| 1. Overview |
| 1.1 Company overview |
| 1.2 Basis of preparation of financial statements |
| 1.3 Basis of consolidation |
| 1.4 Use of estimates and judgments |
| 1.5 Critical accounting estimates and judgements |
| 1.6 Recent accounting pronouncements |
| 2. Notes to the Interim Condensed Consolidated Financial Statements |
| 2.1 Cash and cash equivalents |
| 2.2 Earmarked bank balance for dividend |
| 2.3 Investments |
| 2.4 Financial instruments |
| 2.5 Prepayments and other assets |
| 2.6 Other liabilities |
| 2.7 Provisions and other contingencies |
| 2.8 Property, plant and equipment |
| 2.9 Leases |
| 2.10 Goodwill and Intangible Assets |
| 2.11 Business combinations |
| 2.12 Employees' Stock Option Plans (ESOP) |
| 2.13 Income Taxes |
| 2.14 Basic and diluted shares used in computing earnings per equity share |
| 2.15 Related party transactions |
| 2.16 Segment reporting |
| 2.17 Revenue from Operations |
| 2.18 Unbilled Revenue |
| 2.19 Equity |
| 2.20 Break-up of expenses and other income, net |
Infosys Limited and subsidiaries
(In crore except equity share data)
| Condensed Consolidated Balance Sheet as at |
Note |
June 30, 2023 |
March 31, 2023 |
| ASSETS |
|
|
|
| Current assets |
|
|
|
| Cash and cash equivalents |
2.1 |
12,310 |
12,173 |
| Earmarked bank balance for dividend |
2.2 |
7,262 |
– |
| Current investments |
2.3 |
5,536 |
6,909 |
| Trade receivables |
|
26,183 |
25,424 |
| Unbilled revenue |
2.18 |
14,628 |
15,289 |
| Prepayments and other current assets |
2.5 |
11,373 |
10,979 |
| Income tax assets |
2.13 |
11 |
6 |
| Derivative financial instruments |
2.4 |
171 |
101 |
| Total current assets |
|
77,474 |
70,881 |
| Non-current assets |
|
|
|
| Property, plant and equipment |
2.8 |
13,438 |
13,793 |
| Right-of-use assets |
2.9 |
7,049 |
6,882 |
| Goodwill |
2.10 |
7,233 |
7,248 |
| Intangible assets |
|
1,643 |
1,749 |
| Non-current investments |
2.3 |
11,991 |
12,569 |
| Unbilled revenue |
2.18 |
1,379 |
1,449 |
| Deferred income tax assets |
2.13 |
1,025 |
1,245 |
| Income tax assets |
2.13 |
6,922 |
6,453 |
| Other non-current assets |
2.5 |
3,168 |
3,547 |
| Total non-current assets |
|
53,848 |
54,935 |
| Total assets |
|
131,322 |
125,816 |
| LIABILITIES AND EQUITY |
|
|
|
| Current liabilities |
|
|
|
| Trade payables |
|
3,759 |
3,865 |
| Lease liabilities |
2.9 |
1,824 |
1,242 |
| Derivative financial instruments |
2.4 |
52 |
78 |
| Current income tax liabilities |
2.13 |
4,781 |
3,384 |
| Unearned revenue |
|
7,330 |
7,163 |
| Employee benefit obligations |
|
2,543 |
2,399 |
| Provisions |
2.7 |
1,538 |
1,307 |
| Other current liabilities |
2.6 |
24,668 |
19,748 |
| Total current liabilities |
|
46,495 |
39,186 |
| Non-current liabilities |
|
|
|
| Lease liabilities |
2.9 |
6,659 |
7,057 |
| Deferred income tax liabilities |
2.13 |
1,118 |
1,220 |
| Employee benefit obligations |
|
81 |
83 |
| Other non-current liabilities |
2.6 |
2,141 |
2,475 |
| Total non-current liabilities |
|
9,999 |
10,835 |
| Total liabilities |
|
56,494 |
50,021 |
| Equity |
|
|
|
| Share capital - 5 par value 4,800,000,000 (4,800,000,000) equity shares authorized, issued and outstanding 4,138,454,008 (4,136,387,925) equity shares fully paid up, net of 11,738,357 (12,172,119) treasury shares as at June 30, 2023 (March 31, 2023) |
2.19 |
2,070 |
2,069 |
| Share premium |
|
1,204 |
1,065 |
| Retained earnings |
|
58,214 |
60,063 |
| Cash flow hedge reserves |
|
1 |
(5) |
| Other reserves |
|
10,572 |
10,014 |
| Capital redemption reserve |
|
169 |
169 |
| Other components of equity |
|
2,213 |
2,032 |
| Total equity attributable to equity holders of the Company |
|
74,443 |
75,407 |
| Non-controlling interests |
|
385 |
388 |
| Total equity |
|
74,828 |
75,795 |
| Total liabilities and equity |
|
131,322 |
125,816 |
The accompanying notes form an integral part of
the interim condensed consolidated financial statements.
As per our report of even date attached
| for Deloitte Haskins & Sells LLP |
for and on behalf of the Board of Directors of Infosys Limited |
| Chartered Accountants |
|
| Firm's Registration No: |
|
117366W/W-100018
|
|
|
Sanjiv V. Pilgaonkar
Partner
Membership No. 039826 |
Nandan M. Nilekani
Chairman |
Salil Parekh
Chief Executive Officer
and Managing Director |
Bobby Parikh
Director |
| |
|
|
|
| |
Nilanjan Roy
Chief Financial Officer |
Jayesh Sanghrajka
Executive Vice President and
Deputy Chief Financial Officer |
A.G.S. Manikantha
Company Secretary |
| |
|
|
|
|
Bengaluru
July 20, 2023 |
|
|
|
Infosys Limited and subsidiaries
(In crore except equity share and per equity
share data)
| Condensed Consolidated Statement of Comprehensive Income for the |
|
Three months ended June 30, |
| |
Note |
2023 |
2022 |
| Revenues |
2.17 |
37,933 |
34,470 |
| Cost of sales |
2.20 |
26,382 |
24,369 |
| Gross profit |
|
11,551 |
10,101 |
| Operating expenses |
|
|
|
| Selling and marketing expenses |
2.20 |
1,783 |
1,493 |
| Administrative expenses |
2.20 |
1,877 |
1,694 |
| Total operating expenses |
|
3,660 |
3,187 |
| Operating profit |
|
7,891 |
6,914 |
| Other income, net |
2.20 |
561 |
676 |
| Finance cost |
|
90 |
56 |
| Profit before income taxes |
|
8,362 |
7,534 |
| Income tax expense |
2.13 |
2,417 |
2,172 |
| Net profit |
|
5,945 |
5,362 |
| Other comprehensive income |
|
|
|
| Items that will not be reclassified subsequently to profit or loss |
|
|
|
| Remeasurement of the net defined benefit liability/asset, net |
|
87 |
(86) |
| Equity instruments through other comprehensive income, net |
2.3 |
1 |
3 |
| |
|
88 |
(83) |
| Items that will be reclassified subsequently to profit or loss |
|
|
|
| Fair value changes on derivatives designated as cash flow hedge, net |
|
6 |
26 |
| Exchange differences on translation of foreign operations |
|
15 |
53 |
| Fair value changes on investments, net |
2.3 |
75 |
(372) |
| |
|
96 |
(293) |
| Total other comprehensive income/(loss), net of tax |
|
184 |
(376) |
| Total comprehensive income |
|
6,129 |
4,986 |
| Profit attributable to: |
|
|
|
| Owners of the Company |
|
5,945 |
5,360 |
| Non-controlling interests |
|
– |
2 |
| |
|
5,945 |
5,362 |
| Total comprehensive income attributable to: |
|
|
|
| Owners of the Company |
|
6,132 |
4,986 |
| Non-controlling interests |
|
(3) |
– |
| |
|
6,129 |
4,986 |
| Earnings per equity share |
|
|
|
| Equity shares of par value 5/- each |
|
|
|
| Basic () |
|
14.37 |
12.78 |
| Diluted () |
|
14.35 |
12.76 |
| Weighted average equity shares used in computing earnings per equity share |
|
|
|
| Basic (in shares) |
2.14 |
4,137,234,750 |
4,193,747,653 |
| Diluted (in shares) |
2.14 |
4,142,207,951 |
4,199,491,985 |
The accompanying notes form an integral part of
the interim condensed consolidated financial statements.
As per our report of even date attached
| for Deloitte Haskins & Sells LLP |
for and on behalf of the Board of Directors of Infosys Limited |
| Chartered Accountants |
|
| Firm's Registration No: |
|
117366W/W-100018
|
|
|
Sanjiv V. Pilgaonkar
Partner
Membership No. 039826 |
Nandan M. Nilekani
Chairman |
Salil Parekh
Chief Executive Officer
and Managing Director |
Bobby Parikh
Director |
| |
|
|
|
| |
Nilanjan Roy
Chief Financial Officer |
Jayesh Sanghrajka
Executive Vice President and
Deputy Chief Financial Officer |
A.G.S. Manikantha
Company Secretary |
| |
|
|
|
|
Bengaluru
July 20, 2023 |
|
|
|
Infosys Limited and subsidiaries
(In crore except equity share data)
|
Condensed Consolidated Statement of Changes in Equity
|
Number
of Shares(1) |
Share
Capital |
Share
premium |
Retained
earnings |
Other
reserves(2) |
Capital
redemption
reserve |
Other
components
of equity |
Cash flow
hedge reserve |
Total equity
attributable to equity
holders of the Company |
Non-controlling
interest |
Total equity |
|
Balance as at April 1, 2022 |
4,193,012,929 |
2,098 |
827 |
62,423 |
8,339 |
139 |
1,522 |
2 |
75,350 |
386 |
75,736 |
| Impact on adoption of amendment to IAS 37## |
– |
– |
– |
(19) |
– |
– |
– |
– |
(19) |
– |
(19) |
| |
4,193,012,929 |
2,098 |
827 |
62,404 |
8,339 |
139 |
1,522 |
2 |
75,331 |
386 |
75,717 |
| Changes in equity for the three months ended June 30, 2022 |
|
|
|
|
|
|
|
|
|
|
|
| Net profit |
|
– |
– |
– |
5,360 |
– |
– |
– |
– |
5,360 |
2 |
5,362 |
| Remeasurement of the net defined benefit liability/asset, net* |
– |
– |
– |
– |
– |
– |
(86) |
– |
(86) |
– |
(86) |
| Fair value changes on derivatives designated as Cash flow hedge, net* |
– |
– |
– |
– |
– |
– |
– |
26 |
26 |
– |
26 |
| Exchange differences on translation of foreign operations |
– |
– |
– |
– |
– |
– |
55 |
– |
55 |
(2) |
53 |
| Equity instruments through other comprehensive income, net* |
– |
– |
– |
– |
– |
– |
3 |
– |
3 |
– |
3 |
| Fair value changes on investments, net* |
– |
– |
– |
– |
– |
– |
(372) |
– |
(372) |
– |
(372) |
| Total comprehensive income for the period |
– |
– |
– |
5,360 |
– |
– |
(400) |
26 |
4,986 |
– |
4,986 |
| Shares issued on exercise of employee stock options (Refer to note 2.12) |
1,414,500 |
– |
2 |
– |
– |
– |
– |
– |
2 |
– |
2 |
| Employee stock compensation expense (Refer to note 2.12) |
– |
– |
134 |
– |
– |
– |
– |
– |
134 |
– |
134 |
| Income tax benefit arising on exercise of stock options (Refer to note 2.13) |
– |
– |
14 |
– |
– |
– |
– |
– |
14 |
– |
14 |
| Transfer on account of options not exercised |
– |
– |
(1) |
1 |
– |
– |
– |
– |
– |
– |
– |
| Transferred from other reserves on utilization |
– |
– |
– |
296 |
(296) |
– |
– |
– |
– |
– |
– |
| Dividends paid to non controlling interest of subsidiary |
– |
– |
– |
– |
– |
– |
– |
– |
– |
(21) |
(21) |
|
Dividends#
|
– |
– |
– |
(6,711) |
– |
– |
– |
– |
(6,711) |
– |
(6,711) |
|
Balance as at June 30, 2022 |
4,194,427,429 |
2,098 |
976 |
61,350 |
8,043 |
139 |
1,122 |
28 |
73,756 |
365 |
74,121 |
|
Balance as at April 1, 2023
|
4,136,387,925 |
2,069 |
1,065 |
60,063 |
10,014 |
169 |
2,032 |
(5) |
75,407 |
388 |
75,795 |
| Changes in equity for three months ended June 30, 2023 |
|
|
|
|
|
|
|
|
|
|
|
| Net profit |
|
– |
– |
– |
5,945 |
– |
– |
– |
– |
5,945 |
– |
5,945 |
| Remeasurement of the net defined benefit liability/asset, net* |
– |
– |
– |
– |
– |
– |
87 |
– |
87 |
– |
87 |
| Equity instruments through other comprehensive income, net* |
– |
– |
– |
– |
– |
– |
1 |
– |
1 |
– |
1 |
| Fair value changes on derivatives designated as cash flow hedge, net* |
– |
– |
– |
– |
– |
– |
– |
6 |
6 |
– |
6 |
| Exchange differences on translation of foreign operations |
– |
– |
– |
– |
– |
– |
18 |
– |
18 |
(3) |
15 |
| Fair value changes on investments, net* |
– |
– |
– |
– |
– |
– |
75 |
– |
75 |
– |
75 |
| Total comprehensive income for the period |
– |
– |
– |
5,945 |
– |
– |
181 |
6 |
6,132 |
(3) |
6,129 |
| Shares issued on exercise of employee stock options (Refer to note 2.12) |
2,066,083 |
1 |
1 |
– |
– |
– |
– |
– |
2 |
– |
2 |
| Transferred on account of options not exercised |
– |
– |
(6) |
6 |
– |
– |
– |
– |
– |
– |
– |
| Employee stock compensation expense (Refer to note 2.12) |
– |
– |
144 |
– |
– |
– |
– |
– |
144 |
– |
144 |
| Transferred to other reserves |
|
– |
– |
– |
(760) |
760 |
– |
– |
– |
– |
– |
– |
| Transferred from other reserves on utilization |
– |
– |
– |
202 |
(202) |
– |
– |
– |
– |
– |
– |
|
Dividends#
|
– |
– |
– |
(7,242) |
– |
– |
– |
– |
(7,242) |
– |
(7,242) |
|
Balance as at June 30, 2023 |
4,138,454,008 |
2,070 |
1,204 |
58,214 |
10,572 |
169 |
2,213 |
1 |
74,443 |
385 |
74,828 |
| ## | | Impact on account of adoption of amendment to Ind AS 37 Provisions, Contingent Liabilities
and Contingents Assets |
| (1) | | excludes treasury shares of 11,738,357 as at June 30, 2023, 12,172,119 as at April 1,
2023, 13,193,290 as at June 30, 2022 and 13,725,712 as at April 1, 2022 held by consolidated trust. |
| (2) | | Represents the Special Economic Zone Re-investment reserve created out of the profit of
the eligible SEZ unit in terms of the provisions of Sec 10AA(1)(ii) of Income Tax Act,1961. The reserve should be utilized by the Group
for acquiring new plant and machinery for the purpose of its business in terms of the provisions of the Sec 10AA(2) of the Income Tax
Act, 1961. |
The accompanying notes form an integral part of
the interim condensed consolidated financial statements.
As per our report of even date attached
| for Deloitte Haskins & Sells LLP |
for and on behalf of the Board of Directors of Infosys Limited |
| Chartered Accountants |
|
| Firm's Registration No: |
|
117366W/W-100018
|
|
|
Sanjiv V. Pilgaonkar
Partner
Membership No. 039826 |
Nandan M. Nilekani
Chairman |
Salil Parekh
Chief Executive Officer
and Managing Director |
Bobby Parikh
Director |
| |
|
|
|
| |
Nilanjan Roy
Chief Financial Officer |
Jayesh Sanghrajka
Executive Vice President and
Deputy Chief Financial Officer |
A.G.S. Manikantha
Company Secretary |
| |
|
|
|
|
Bengaluru
July 20, 2023 |
|
|
|
Infosys Limited and subsidiaries
Condensed Consolidated Statement of Cash Flows
Accounting Policy
Cash flows are reported using the indirect method,
whereby profit for the period is adjusted for the effects of transactions of a non-cash nature, any deferrals or accruals of past or future
operating cash receipts or payments and item of income or expenses associated with investing or financing cash flows. The cash flows from
operating, investing and financing activities of the Group are segregated. The Group considers all highly liquid investments that are
readily convertible to known amounts of cash to be cash equivalents.
(In crore)
| Particulars |
|
Three months ended June 30, |
| |
Note |
2023 |
2022 |
| Operating activities: |
|
|
|
| Net Profit |
|
5,945 |
5,362 |
| Adjustments to reconcile net profit to net cash provided by operating activities: |
|
|
|
| Depreciation and amortization |
|
1,173 |
950 |
| Income tax expense |
2.13 |
2,417 |
2,172 |
| Finance cost |
|
90 |
56 |
| Interest and dividend income |
|
(278) |
(280) |
| Exchange differences on translation of assets and liabilities, net |
|
(20) |
79 |
| Impairment loss recognised/(reversed) under expected credit loss model |
|
91 |
44 |
| Stock compensation expense |
|
146 |
132 |
| Other adjustments |
|
558 |
126 |
| Changes in working capital |
|
|
|
| Trade receivables and unbilled revenue |
|
(101) |
(2,520) |
| Prepayments and other assets |
|
(158) |
(1,280) |
| Trade payables |
|
(106) |
(184) |
| Unearned revenue |
|
167 |
(9) |
| Other liabilities and provisions |
|
(1,989) |
2,475 |
| Cash generated from operations |
|
7,935 |
7,123 |
| Income taxes paid |
|
(1,379) |
(1,325) |
| Net cash generated by operating activities |
|
6,556 |
5,798 |
| Investing activities: |
|
|
|
| Expenditure on property, plant and equipment and intangibles |
|
(807) |
(692) |
| Deposits placed with corporation |
|
(444) |
(216) |
| Redemption of deposits placed with corporation |
|
252 |
22 |
| Interest and dividend received |
|
275 |
274 |
| Payment for acquisition of business, net of cash acquired |
|
– |
(230) |
| Payment of contingent consideration pertaining to acquisition of business |
|
– |
(60) |
| Payments to acquire Investments |
|
|
|
| - Quoted debt securities |
|
(104) |
(1,545) |
| - Liquid mutual fund units |
|
(17,680) |
(20,745) |
| - Certificates of deposit |
|
(1,285) |
(2,931) |
| - Commercial paper |
|
(1,558) |
(283) |
| - Other investments |
|
(3) |
(10) |
| Proceeds on sale of investments |
|
|
|
| - Quoted debt securities |
|
601 |
931 |
| - Liquid mutual fund units |
|
17,304 |
21,097 |
| - Certificates of deposit |
|
3,974 |
2,188 |
| - Commercial paper |
|
824 |
– |
| Other receipts |
|
126 |
22 |
| Net cash (used)/generated in investing activities |
|
1,475 |
(2,178) |
| Financing activities: |
|
|
|
| Payment of lease liabilities |
|
(439) |
(250) |
| Payment of dividends |
|
(1) |
(6,712) |
| Payment of dividends to non-controlling interests of subsidiary |
|
– |
(21) |
| Other payments |
|
(209) |
(112) |
| Other receipts |
|
– |
72 |
| Shares issued on exercise of employee stock options |
|
2 |
2 |
| Net cash used in financing activities |
|
(647) |
(7,021) |
| Net increase/(decrease) in cash and cash equivalents |
|
7,384 |
(3,401) |
| Effect of exchange rate changes on cash and cash equivalents |
|
15 |
(89) |
| Cash and cash equivalents at the beginning of the period |
2.1 |
12,173 |
17,472 |
| Cash and cash equivalents at the end of the period |
2.1 |
19,572 |
13,982 |
| Supplementary information: |
|
|
|
| Restricted cash balance |
2.1 |
381 |
422 |
| Closing cash and cash equivalents as per consolidated statement of cash flows |
|
19,572 |
13,982 |
| Less: Earmarked bank balance for dividend |
2.2 |
7,262 |
– |
| Closing cash and cash equivalents as per Consolidated Balance Sheet |
|
12,310 |
13,982 |
The accompanying notes form an integral part of
the interim condensed consolidated financial statements.
As per our report of even date attached
| for Deloitte Haskins & Sells LLP |
for and on behalf of the Board of Directors of Infosys Limited |
| Chartered Accountants |
|
| Firm's Registration No: |
|
117366W/W-100018
|
|
|
Sanjiv V. Pilgaonkar
Partner
Membership No. 039826 |
Nandan M. Nilekani
Chairman |
Salil Parekh
Chief Executive Officer
and Managing Director |
Bobby Parikh
Director |
| |
|
|
|
| |
Nilanjan Roy
Chief Financial Officer |
Jayesh Sanghrajka
Executive Vice President and
Deputy Chief Financial Officer |
A.G.S. Manikantha
Company Secretary |
| |
|
|
|
|
Bengaluru
July 20, 2023 |
|
|
|
INFOSYS LIMITED AND SUBSIDIARIES
Overview and Notes to the Interim Condensed Consolidated
Financial Statements
1. Overview
1.1 Company overview
Infosys Limited ('the Company' or Infosys) provides
consulting, technology, outsourcing and next-generation digital services, to enable clients to execute strategies for their digital transformation.
Infosys strategic objective is to build a sustainable organization that remains relevant to the agenda of clients, while creating growth
opportunities for employees and generating profitable returns for investors. Infosys strategy is to be a navigator for our clients as
they ideate, plan and execute on their journey to a digital future.
Infosys together with its subsidiaries and controlled
trusts is herein after referred to as the "Group".
The Company is a public limited company incorporated
and domiciled in India and has its registered office at Electronics City, Hosur Road, Bengaluru -560100, Karnataka, India. The Company
has its primary listings on the BSE Ltd. and National Stock Exchange of India Limited. The Company’s American Depositary Shares
(ADS) representing equity shares are listed on the New York Stock Exchange (NYSE).
The Group's interim condensed consolidated financial
statements are approved for issue by the Company's Board of Directors on July 20, 2023.
1.2 Basis of preparation of financial statements
These interim consolidated financial statements have
been prepared in compliance with IAS 34, Interim Financial Reporting as issued by International Accounting Standards Board, ("IASB")
under the historical cost convention on accrual basis except for certain financial instruments which have been measured at fair values.
Accordingly, these interim condensed consolidated financial statements do not include all the information required for a complete set
of financial statements. These interim condensed consolidated financial statements should be read in conjunction with the consolidated
financial statements and related notes included in the Company’s consolidated financial statements under IFRS in Indian rupee for
the year ended March 31, 2023. Accounting policies have been consistently applied except where a newly issued accounting standard is initially
adopted or a revision to an existing accounting standard requires a change in the accounting policy hitherto in use.
The material accounting policy information used in
preparation of the audited condensed consolidated interim financial statements have been discussed in the respective notes.
1.3 Basis of consolidation
Infosys consolidates entities which it owns or controls.
The interim consolidated financial statements comprise the financial statements of the Company, its controlled trusts and its subsidiaries.
Control exists when the parent has power over the entity, is exposed, or has rights to variable returns from its involvement with the
entity and has the ability to affect those returns by using its power over the entity. Power is demonstrated through existing rights that
give the ability to direct relevant activities, those which significantly affect the entity's returns. Subsidiaries are consolidated from
the date control commences until the date control ceases.
The financial statements of the Group Companies are
consolidated on a line-by-line basis and intra-group balances and transactions including unrealized gain / loss from such transactions
are eliminated upon consolidation. These financial statements are prepared by applying uniform accounting policies in use at the Group.
Non-controlling interests which represent part of the net profit or loss and net assets of subsidiaries that are not, directly or indirectly,
owned or controlled by the Company, are excluded.
1.4 Use of estimates and judgments
The preparation of the interim condensed consolidated
financial statements in conformity with IFRS requires management to make estimates, judgments and assumptions. These estimates, judgments
and assumptions affect the application of accounting policies and the reported amounts of assets and liabilities, the disclosures of contingent
assets and liabilities at the date of the interim consolidated financial statements and reported amounts of revenues and expenses during
the period. Application of accounting policies that require critical accounting estimates involving complex and subjective judgments and
the use of assumptions in these financial statements have been disclosed in Note 1.5. Accounting estimates could change from period to
period. Actual results could differ from those estimates. Appropriate changes in estimates are made as management becomes aware of changes
in circumstances surrounding the estimates. Changes in estimates and judgments are reflected in the financial statements in the period
in which changes are made and, if material, their effects are disclosed in the notes to the interim condensed consolidated financial statements.
1.5 Critical accounting estimates and judgments
a. Revenue recognition
The Group’s contracts with customers include
promises to transfer multiple products and services to a customer. Revenues from customer contracts are considered for recognition and
measurement when the contract has been approved, in writing, by the parties to the contract, the parties to the contract are committed
to perform their respective obligations under the contract, and the contract is legally enforceable. The Group assesses the services promised
in a contract and identifies distinct performance obligations in the contract. Identification of distinct performance obligations to determine
the deliverables and the ability of the customer to benefit independently from such deliverables, and allocation of transaction price
to these distinct performance obligations involves significant judgement.
Fixed price maintenance revenue is recognized ratably
on a straight-line basis when services are performed through an indefinite number of repetitive acts over a specified period. Revenue
from a fixed price maintenance contract is recognized ratably using a percentage of completion method when the pattern of benefits from
the services rendered to the customer and the Group’s costs to fulfil the contract is not even through the period of the contract
because the services are generally discrete in nature and not repetitive. The use of method to recognize the maintenance revenues requires
judgment and is based on the promises in the contract and nature of the deliverables.
The Group uses the percentage-of-completion method
in accounting for other fixed-price contracts. Use of the percentage-of-completion method requires the Group to determine the actual efforts
or costs expended to date as a proportion of the estimated total efforts or costs to be incurred. Efforts or costs expended have been
used to measure progress towards completion as there is a direct relationship between input and productivity. The estimation of total
efforts or costs involves significant judgement and is assessed throughout the period of the contract to reflect any changes based on
the latest available information.
Contracts with customers includes subcontractor services
or third-party vendor equipment or software in certain integrated services arrangements. In these types of arrangements, revenue from
sales of third-party vendor products or services is recorded net of costs when the Group is acting as an agent between the customer and
the vendor, and gross when the Group is the principal for the transaction. In doing so, the Group first evaluates whether it controls
the good or service before it is transferred to the customer. The Group considers whether it has the primary obligation to fulfil the
contract, inventory risk, pricing discretion and other factors to determine whether it controls the goods or service and therefore, is
acting as a principal or an agent.
Provisions for estimated losses, if any, on incomplete
contracts are recorded in the period in which such losses become probable based on the estimated efforts or costs to complete the contract.
b. Income taxes
The Group's two major tax jurisdictions are India and
the United States, though the Company also files tax returns in other overseas jurisdictions.
Significant judgments are involved in determining the
provision for income taxes, including amount expected to be paid/recovered for uncertain tax positions.
In assessing the realizability of deferred income tax
assets, the Management considers whether some portion or all of the deferred income tax assets will not be realized. The ultimate realization
of deferred income tax assets is dependent upon the generation of future taxable income during the periods in which the temporary differences
become deductible. Management considers the scheduled reversals of deferred income tax liabilities, projected future taxable income and
tax planning strategies in making this assessment. Based on the level of historical taxable income and projections for future taxable
income over the periods in which the deferred income tax assets are deductible, the Management believes that the group will realize the
benefits of those deductible differences. The amount of the deferred income tax assets considered realizable, however, could be reduced
in the near term if estimates of future taxable income during the carry forward period are reduced. (Refer to Note 2.13)
c. Business combinations and intangible assets
Business combinations are accounted for using IFRS
3 (Revised), Business Combinations. IFRS 3 requires us to fair value identifiable intangible assets and contingent consideration to ascertain
the fair value of identifiable assets, liabilities and contingent liabilities of the acquiree. These valuations are conducted by external
valuation experts. Estimates are required to be made in determining the value of contingent consideration, value of option arrangements
and intangible assets. These measurements are based on information available at the acquisition date and are based on expectations and
assumptions that have been deemed reasonable by Management. (Refer to Note 2.11 and 2.10.2).
d. Property, plant and equipment
Property, plant and equipment represent a significant
proportion of the asset base of the Group. The charge in respect of periodic depreciation is derived after determining an estimate of
an asset’s expected useful life and the expected residual value at the end of its life. The useful lives and residual values of
Group's assets are determined by Management at the time the asset is acquired and reviewed periodically, including at each financial year
end. The lives are based on historical experience with similar assets as well as anticipation of future events, which may impact their
life, such as changes in technology. (Refer to Note 2.8).
e. Impairment of Goodwill
Goodwill is tested for impairment on an annual basis
and whenever there is an indication that the recoverable amount of a cash generating unit (CGUs) is less than its carrying amount. For
the impairment test, goodwill is allocated to the CGU or groups of CGUs which benefit from the synergies of the acquisition and which
represent the lowest level at which goodwill is monitored for internal management purposes.
The recoverable amount of CGUs is determined based
on higher of value-in-use and fair value less cost to sell. Key assumptions in the cash flow projections are prepared based on current
economic conditions and comprises estimated long term growth rates, weighted average cost of capital and estimated operating margins.
(Refer to note 2.10.1)
1.6 Recent accounting pronouncements
New and revised IFRS Standards in issue but not
yet effective:
| Amendments to IFRS 16 Leases |
Lease Liability in a Sale and Leaseback |
| Amendments to IAS 7 Statement of Cash Flows and IFRS 7 Financial Instruments |
Disclosure regarding supplier finance arrangements |
Amendments to IFRS 16
On September 22, 2022, International Accounting Standards
Board (IASB) has issued amendments to IFRS 16 Leases, which added requirements explaining the subsequent measurement for a sale and leaseback
transaction. These amendments will not change the accounting for leases other than those arising in a sale and leaseback transaction.
The effective date for the adoption of this amendment
is annual reporting periods beginning on or after January 1, 2024, although early adoption is permitted. The Group does not expect this
amendment to have any significant impact in its financial statements.
Amendments to IAS 7 and IFRS 7
On May 25, 2023 International Accounting Standards
Board (IASB) has issued amendments to IAS 7 Statement of Cash Flows and IFRS 7 Financial Instruments: Disclosure which requires entities
to disclose information that enables users of financial statement to assess how supplier finance arrangements affect its liabilities and
cash flows and to understand the effect of supplier finance arrangements on an entity’s exposure to liquidity risk and how the entity
might be affected if the arrangements were no longer available to it.
The effective date for adoption of this amendment is
annual periods beginning on or after January 1, 2024, although early adoption is permitted. The Group is in the process of evaluating
the impact of the amendment.
2. Notes to the Interim Condensed Consolidated Financial
Statements
2.1 Cash and cash equivalents
Cash and cash equivalents consist of the following:
(In crore)
| Particulars |
As at |
| |
June 30, 2023 |
March 31, 2023 |
| Cash and bank deposits |
10,363 |
10,026 |
| Deposits with financial institutions |
1,947 |
2,147 |
| Total Cash and cash equivalents |
12,310 |
12,173 |
Cash and cash equivalents as at June 30, 2023 and March
31, 2023 include restricted cash and bank balances of 381 crore and 362 crore, respectively. The restrictions are primarily
on account of bank balances held by irrevocable trusts controlled by the Company.
The deposits maintained by the Group with banks and
financial institutions comprise of time deposits, which can be withdrawn by the Group at any point without prior notice or penalty on
the principal.
2.2 Earmarked bank balance for dividend
Cash and cash equivalents consist of the following:
(In crore)
| Particulars |
As at |
| |
June 30, 2023 |
March 31, 2023 |
| Current |
|
|
| Earmarked bank balance for dividend |
7,262 |
– |
| Total |
7,262 |
– |
The Board of Directors in their meeting held on April
13, 2023 recommended a final dividend of 17.50/- per equity share for the financial year ended March 31, 2023. The same was approved
by the shareholders at the Annual General Meeting (AGM) of the Company held on June 28, 2023. Payment date for the dividend is July 3,
2023. Earmarked bank balance for dividend represents cash which is deposited in a designated bank account only for payment of final dividend
for financial year ended March 31, 2023.
2.3 Investments
The carrying value of investments are as follows:
(In crore)
| Particulars |
As at |
| |
June 30, 2023 |
March 31, 2023 |
| (i) Current Investments |
|
|
| Amortized Cost |
|
|
| Quoted debt securities |
150 |
150 |
| Fair Value through profit or loss |
|
|
| Liquid mutual fund units |
1,397 |
975 |
| Fair Value through other comprehensive income |
|
|
| Quoted Debt Securities |
1,554 |
1,468 |
| Commercial Papers |
1,496 |
742 |
| Certificate of Deposit |
939 |
3,574 |
| Total current investments |
5,536 |
6,909 |
| (ii) Non-current Investments |
|
|
| Amortized Cost |
|
|
| Quoted debt securities |
1,767 |
1,770 |
| Fair Value through other comprehensive income |
|
|
| Quoted debt securities |
9,447 |
10,032 |
| Unquoted equity and preference securities |
196 |
196 |
| Fair Value through profit or loss |
|
|
| Target maturity fund units |
409 |
402 |
| Others(1) |
172 |
169 |
| Total non-current investments |
11,991 |
12,569 |
| |
|
|
| Total investments |
17,527 |
19,478 |
| Investments carried at amortized cost |
1,917 |
1,920 |
| Investments carried at fair value through other comprehensive income |
13,632 |
16,012 |
| Investments carried at fair value through profit or loss |
1,978 |
1,546 |
| (1) | | Uncalled capital commitments outstanding as at June 30, 2023 and March 31, 2023 was 88
crore and 92 crore, respectively. |
Refer to note 2.4 for accounting policies on financial
instruments.
Method of fair valuation:
(In crore)
| Class of investment |
Method |
Fair value as at |
| |
|
June 30, 2023 |
March 31, 2023 |
| Liquid mutual fund units - carried at fair value through profit or loss |
Quoted price |
1,397 |
975 |
| Target maturity fund units - carried at fair value through profit or loss |
Quoted price |
409 |
402 |
| Quoted debt securities- carried at amortized cost |
Quoted price and market observable inputs |
2,153 |
2,148 |
| Quoted debt securities- carried at fair value through other comprehensive income |
Quoted price and market observable inputs |
11,001 |
11,500 |
| Commercial Papers- carried at fair value through other comprehensive income |
Market observable inputs |
1,496 |
742 |
| Certificates of Deposit- carried at fair value through other comprehensive income |
Market observable inputs |
939 |
3,574 |
| Unquoted equity and preference securities - carried at fair value through other comprehensive income |
Discounted cash flows method, Market multiples method, Option pricing model |
196 |
196 |
| Others - carried at fair Value through profit or loss |
Discounted cash flows method, Market multiples method, Option pricing model |
172 |
169 |
| Total |
|
17,763 |
19,706 |
Note: Certain quoted investments are classified as Level
2 in the absence of active market for such investments.
2.4 Financial instruments
Accounting Policy
2.4.1 Initial recognition
The Group recognizes financial assets and financial
liabilities when it becomes a party to the contractual provisions of the instrument. All financial assets and liabilities are recognized
at fair value on initial recognition, except for trade receivables which are initially measured at transaction price. Transaction costs
that are directly attributable to the acquisition or issue of financial assets and financial liabilities which are not at fair value through
profit or loss, are added to the fair value on initial recognition. Regular way purchase and sale of financial assets are accounted for
at trade date.
2.4.2 Subsequent measurement
a. Non-derivative financial instruments
(i) Financial assets at amortized cost
A financial asset is subsequently measured at amortized
cost if it is held within a business model whose objective is to hold the asset in order to collect contractual cash flows and the contractual
terms of the financial asset give rise on specified dates to cash flows that are solely payments of principal and interest on the principal
amount outstanding.
(ii) Financial assets at fair value through other
comprehensive income (FVOCI)
A financial asset is subsequently measured at fair
value through other comprehensive income if it is held within a business model whose objective is achieved by both collecting contractual
cash flows and selling financial assets and the contractual terms of the financial asset give rise on specified dates to cash flows that
are solely payments of principal and interest on the principal amount outstanding. The Group has made an irrevocable election for its
investments which are classified as equity instruments to present the subsequent changes in fair value in other comprehensive income based
on its business model.
(iii) Financial assets at fair value through
profit or loss (FVTPL)
A financial asset which is not classified in any of
the above categories is subsequently fair valued through profit or loss.
(iv) Financial liabilities
Financial liabilities are subsequently carried at amortized
cost using the effective interest method, except for contingent consideration and financial liability under option arrangements recognized
in a business combination which is subsequently measured at fair value through profit or loss.
b. Derivative financial instruments
The Group holds derivative financial instruments such
as foreign exchange forward and option contracts to mitigate the risk of changes in exchange rates on foreign currency exposures. The
counterparty for such contracts is generally a bank.
(i) Financial assets or financial liabilities, carried
at fair value through profit or loss
This category includes derivative financial assets
or liabilities which are not designated as hedges.
Although the Group believes that these derivatives
constitute hedges from an economic perspective, they may not qualify for hedge accounting under IFRS 9, Financial Instruments. Any derivative
that is either not designated as hedge, or is so designated but is ineffective as per IFRS 9, is categorized as a financial asset or financial
liability, at fair value through profit or loss.
Derivatives not designated as hedges are recognized
initially at fair value and attributable transaction costs are recognized in net profit in the interim consolidated statement of comprehensive
income when incurred. Subsequent to initial recognition, these derivatives are measured at fair value through profit or loss and the resulting
exchange gains or losses are included in other income. Assets/ liabilities in this category are presented as current assets/current liabilities
if they are either held for trading or are expected to be realized within 12 months after the Balance Sheet date.
(ii) Cash flow hedge
The Group designates certain foreign exchange forward
and options contracts as cash flow hedges to mitigate the risk of foreign exchange exposure on highly probable forecast cash transactions.
When a derivative is designated as a cash flow hedging
instrument, the effective portion of changes in the fair value of the derivative is recognized in other comprehensive income and accumulated
in the cash flow hedging reserve. Any ineffective portion of changes in the fair value of the derivative is recognized immediately in
the net profit in the interim consolidated statement of comprehensive income. If the hedging instrument no longer meets the criteria for
hedge accounting, then hedge accounting is discontinued prospectively. If the hedging instrument expires or is sold, terminated or exercised,
the cumulative gain or loss on the hedging instrument recognized in cash flow hedging reserve till the period the hedge was effective
remains in cash flow hedging reserve until the forecasted transaction occurs. The cumulative gain or loss previously recognized in the
cash flow hedging reserve is transferred to the net profit in the consolidated statement of comprehensive income upon the occurrence of
the related forecasted transaction. If the forecasted transaction is no longer expected to occur, then the amount accumulated in cash
flow hedging reserve is reclassified to net profit in the consolidated statement of comprehensive income.
2.4.3 Derecognition of financial instruments
The Group derecognizes a financial asset when the contractual
rights to the cash flows from the financial asset expire or it transfers the financial asset and the transfer qualifies for derecognition
under IFRS 9. A financial liability (or a part of a financial liability) is derecognized from the Group's Balance Sheet when the obligation
specified in the contract is discharged or cancelled or expires.
2.4.4 Fair value of financial instruments
In determining the fair value of its financial instruments,
the Group uses a variety of methods and assumptions that are based on market conditions and risks existing at each reporting date. The
methods used to determine fair value include discounted cash flow analysis, available quoted market prices and dealer quotes. All methods
of assessing fair value result in general approximation of value, and such value may never actually be realized.
Refer to table 'Financial instruments by category'
below for the disclosure on carrying value and fair value of financial assets and liabilities. For financial assets and liabilities maturing
within one year from the Balance Sheet date and which are not carried at fair value, the carrying amounts approximate fair value due to
the short maturity of these instruments.
2.4.5 Impairment
The Group recognizes loss allowances using the expected
credit loss (ECL) model for the financial assets and unbilled revenue which are not fair valued through profit or loss. Loss allowance
for trade receivables and unbilled revenues with no significant financing component is measured at an amount equal to lifetime ECL. For
all other financial assets, expected credit losses are measured at an amount equal to the 12-month ECL, unless there has been a significant
increase in credit risk from initial recognition in which case those are measured at lifetime ECL.
The Group determines the allowance for credit losses
based on historical loss experience adjusted to reflect current and estimated future economic conditions. The Group considers current
and anticipated future economic conditions relating to industries the Group deals with and the countries where it operates.
The amount of ECL (or reversal) that is required to
adjust the loss allowance at the reporting date to the amount that is required to be recorded is recognized as an impairment loss or gain
in the interim consolidated statement of comprehensive income.
Financial instruments by category
The carrying value and fair value of financial instruments
by categories as at June 30, 2023 are as follows:
(In crore)
| Particulars |
Amortized cost |
Financial assets / liabilities at fair value through profit or loss |
Financial assets / liabilities at fair value through OCI |
Total carrying value |
Total fair value |
| |
|
Designated upon initial recognition |
Mandatory |
Equity instruments designated upon initial recognition |
Mandatory |
|
|
| Assets: |
|
|
|
|
|
|
|
| Cash and cash equivalents (Refer to note 2.1) |
12,310 |
– |
– |
– |
– |
12,310 |
12,310 |
| Earmarked bank balance for dividend (Refer Note no. 2.2) |
7,262 |
– |
– |
– |
– |
7,262 |
7,262 |
| Investments (Refer to note 2.3) |
|
|
|
|
|
|
|
| Liquid mutual fund units |
– |
– |
1,397 |
– |
– |
1,397 |
1,397 |
| Target maturity fund units |
– |
– |
409 |
– |
– |
409 |
409 |
| Quoted debt securities |
1,917 |
– |
– |
– |
11,001 |
12,918 |
13,154 (1) |
| Commercial Papers |
– |
– |
– |
– |
1,496 |
1,496 |
1,496 |
| Certificates of deposit |
– |
– |
– |
– |
939 |
939 |
939 |
| Unquoted equity and preference securities |
– |
– |
– |
196 |
– |
196 |
196 |
| Unquoted investment others |
– |
– |
172 |
– |
– |
172 |
172 |
| Trade receivables |
26,183 |
– |
– |
– |
– |
26,183 |
26,183 |
| Unbilled revenues (Refer to note 2.18)(3) |
9,027 |
– |
– |
– |
– |
9,027 |
9,027 |
| Prepayments and other assets (Refer to note 2.5) |
5,106 |
– |
– |
– |
– |
5,106 |
5,014 (2) |
| Derivative financial instruments |
– |
– |
149 |
– |
22 |
171 |
171 |
| Total |
61,805 |
– |
2,127 |
196 |
13,458 |
77,586 |
77,730 |
| Liabilities: |
|
|
|
|
|
|
|
| Trade payables |
3,759 |
– |
– |
– |
– |
3,759 |
3,759 |
| Lease liabilities (Refer to note 2.9) |
8,483 |
– |
– |
– |
– |
8,483 |
8,483 |
| Derivative financial instruments |
– |
– |
46 |
– |
6 |
52 |
52 |
| Financial liability under option arrangements (Refer to note 2.6) |
– |
– |
627 |
– |
– |
627 |
627 |
Other liabilities including contingent consideration
(Refer to note 2.6) |
21,735 |
– |
99 |
– |
– |
21,834 |
21,834 |
| Total |
33,977 |
– |
772 |
– |
6 |
34,755 |
34,755 |
| (1) | | On account of fair value changes including interest accrued |
| (2) | | Excludes interest accrued on quoted debt securities carried at amortized cost of 92
crore. |
| (3) | | Excludes unbilled revenue for contracts where the right to consideration is dependent
on completion of contractual milestones |
The carrying value and fair value of financial instruments
by categories as at March 31, 2023 were as follows:
(In crore)
| Particulars |
Amortized cost |
Financial assets/ liabilities at fair value through profit or loss |
Financial assets/liabilities at fair value through OCI |
Total carrying value |
Total fair value |
| |
|
Designated upon initial recognition |
Mandatory |
Equity instruments designated upon initial recognition |
Mandatory |
|
|
| Assets: |
|
|
|
|
|
|
|
| Cash and cash equivalents (Refer to note 2.1) |
12,173 |
– |
– |
– |
– |
12,173 |
12,173 |
| Investments (Refer to note 2.3) |
|
|
|
|
|
|
|
| Liquid mutual fund units |
– |
– |
975 |
– |
– |
975 |
975 |
| Target maturity fund units |
– |
– |
402 |
– |
– |
402 |
402 |
| Quoted debt securities |
1,920 |
– |
– |
– |
11,500 |
13,420 |
13,648 (1) |
| Commercial Paper |
– |
– |
– |
– |
742 |
742 |
742 |
| Certificates of deposit |
– |
– |
– |
– |
3,574 |
3,574 |
3,574 |
| Unquoted equity and preference securities |
– |
– |
– |
196 |
– |
196 |
196 |
| Unquoted investments others |
– |
– |
169 |
– |
– |
169 |
169 |
| Trade receivables |
25,424 |
– |
– |
– |
– |
25,424 |
25,424 |
| Unbilled revenue (Refer to note 2.18)(3) |
9,502 |
– |
– |
– |
– |
9,502 |
9,502 |
| Prepayments and other assets (Refer to note 2.5) |
5,127 |
– |
– |
– |
– |
5,127 |
5,043 (2) |
| Derivative financial instruments |
– |
– |
69 |
– |
32 |
101 |
101 |
| Total |
54,146 |
– |
1,615 |
196 |
15,848 |
71,805 |
71,949 |
| Liabilities: |
|
|
|
|
|
|
|
| Trade payables |
3,865 |
– |
– |
– |
– |
3,865 |
3,865 |
| Lease liabilities (Refer to note 2.9) |
8,299 |
– |
– |
– |
– |
8,299 |
8,299 |
| Derivative financial instruments |
– |
– |
64 |
– |
14 |
78 |
78 |
| Financial liability under option arrangements (Refer to note 2.6) |
– |
– |
600 |
– |
– |
600 |
600 |
| Other liabilities including contingent consideration (Refer to note 2.6) |
17,359 |
– |
97 |
– |
– |
17,456 |
17,456 |
| Total |
29,523 |
– |
761 |
– |
14 |
30,298 |
30,298 |
| (1) | | On account of fair value changes including interest accrued |
| (2) | | Excludes interest accrued on quoted debt securities carried at amortized cost of 84
crore. |
| (3) | | Excludes unbilled revenue for contracts where the right to consideration is dependent
on completion of contractual milestones |
For trade receivables, trade payables and other assets
and payables maturing within one year from the balance sheet date, the carrying amounts approximate fair value due to the short maturity
of these instruments.
Fair value hierarchy
Level 1 - Quoted prices (unadjusted) in active
markets for identical assets or liabilities.
Level 2 – Inputs other than quoted prices
included within Level 1 that are observable for the asset or liability, either directly (i.e. as prices) or indirectly (i.e. derived from
prices).
Level 3 - Inputs for the assets or liabilities
that are not based on observable market data (unobservable inputs).
The fair value hierarchy of assets and liabilities
measured at fair value on a recurring basis as at June 30, 2023 is as follows:
(In crore)
| Particulars |
As at June 30, 2023 |
Fair value measurement at end of the reporting period using |
| |
|
Level 1 |
Level 2 |
Level 3 |
| Assets |
|
|
|
|
| Investments (Refer to note 2.3) |
|
|
|
|
| Investments in liquid mutual fund units |
1,397 |
1,397 |
– |
– |
| Investments in target maturity fund units |
409 |
409 |
– |
– |
| Investments in quoted debt securities |
13,154 |
11,634 |
1,520 |
– |
| Investments in unquoted equity and preference securities |
196 |
– |
– |
196 |
| Investments in certificates of deposit |
939 |
– |
939 |
– |
| Investments in commercial papers |
1,496 |
– |
1,496 |
– |
| Investments in unquoted investments others |
172 |
– |
– |
172 |
| Others |
|
|
|
|
| Derivative financial instruments - gain on outstanding foreign exchange forward and option contracts |
171 |
– |
171 |
– |
| Liabilities |
|
|
|
|
| Derivative financial instruments - loss on outstanding foreign exchange forward and option contracts |
52 |
– |
52 |
– |
| Financial liability under option arrangements (Refer to note 2.6)(1) |
627 |
– |
– |
627 |
| Liability towards contingent consideration (Refer to note 2.6)(1) |
99 |
– |
– |
99 |
| (1) | | Discount rate ranges from 10% to 17% |
During the three months ended June 30, 2023, quoted
debt securities of 1,449 crore were transferred from Level 2 to Level 1 of fair value hierarchy, since these were valued based
on quoted price.
The fair value hierarchy of assets and liabilities
measured at fair value on a recurring basis as at March 31, 2023 was as follows:
(In crore)
| Particulars |
As at March 31, 2023 |
Fair value measurement at end of the reporting period using |
| |
|
Level 1 |
Level 2 |
Level 3 |
| Assets |
|
|
|
|
| Investments (Refer to note 2.3) |
|
|
|
|
| Investments in liquid mutual fund units |
975 |
975 |
– |
– |
| Investments in target maturity fund units |
402 |
402 |
– |
– |
| Investments in quoted debt securities |
13,648 |
10,701 |
2,947 |
– |
| Investments in unquoted equity and preference securities |
196 |
– |
– |
196 |
| Investments in certificates of deposit |
3,574 |
– |
3,574 |
– |
| Investments in commercial papers |
742 |
– |
742 |
– |
| Investments in unquoted investments others |
169 |
– |
– |
169 |
| Others |
|
|
|
|
| Derivative financial instruments- gain on outstanding foreign exchange forward and option contracts |
101 |
– |
101 |
– |
| Liabilities |
|
|
|
|
| Derivative financial instruments- loss on outstanding foreign exchange forward and option contracts |
78 |
– |
78 |
– |
| Financial liability under option arrangements (Refer to note 2.6)(1) |
600 |
– |
– |
600 |
| Liability towards contingent consideration (Refer to note 2.6)(1) |
97 |
– |
– |
97 |
| (1) | | Discount rate ranges from 10% to 15% |
During the year ended March 31, 2023, quoted debt securities
of 383 crore were transferred from Level 2 to Level 1 of fair value hierarchy, since these were valued based on quoted price and
quoted debt securities of 1,611 crore were transferred
from Level 1 to Level 2 of fair value hierarchy, since these were valued based on market observable inputs.
A one percentage point change in the unobservable inputs
used in fair valuation of Level 3 assets and liabilities does not have a significant impact in its value.
Majority of investments of the Group are fair valued
based on Level 1 or Level 2 inputs. These investments primarily include investment in liquid mutual fund units, target maturity fund units,
quoted debt securities, certificates of deposit, commercial paper, quoted bonds issued by government and quasi-government organizations.
The Group invests after considering counterparty risks based on multiple criteria including Tier I Capital, Capital Adequacy Ratio, Credit
Rating, Profitability, NPA levels and Deposit base of banks and financial institutions. These risks are monitored regularly as per Group’s
risk management program.
2.5 Prepayments and other assets
Prepayments and other assets consist of the following:
(In crore)
| Particulars |
As at |
| |
June 30, 2023 |
March 31, 2023 |
| Current |
|
|
| Rental deposits(1) |
30 |
32 |
| Security deposits(1) |
11 |
10 |
| Loans to employees(1) |
267 |
289 |
| Prepaid expenses(2) |
3,097 |
2,745 |
| Interest accrued and not due(1) |
335 |
488 |
| Withholding taxes and others(2) |
2,978 |
3,268 |
| Advance payments to vendors for supply of goods(2) |
222 |
202 |
| Deposit with corporations(1)(3) |
2,532 |
2,348 |
| Deferred contract cost(2) |
|
|
| Cost of obtaining a contract (2)(4) |
657 |
853 |
| Cost of fulfillment (2) |
200 |
175 |
| Net investment in sublease of right of use asset(1) |
5 |
53 |
| Other non financial assets (2) |
249 |
261 |
| Other financial assets(1) |
790 |
255 |
| Total Current prepayment and other assets |
11,373 |
10,979 |
| Non-current |
|
|
| Loans to employees(1) |
34 |
39 |
| Deposit with corporations(1)(3) |
104 |
96 |
| Rental deposits(1) |
240 |
240 |
| Security deposits(1) |
46 |
47 |
| Withholding taxes and others(2) |
685 |
684 |
| Deferred contract cost(2) |
|
|
| Cost of obtaining a contract (2)(4) |
189 |
191 |
| Cost of fulfillment (2) |
729 |
652 |
| Prepaid expenses(2) |
395 |
332 |
| Net investment in sublease of right of use asset(1) |
6 |
305 |
| Defined benefit plan assets(2) |
34 |
36 |
| Other financial assets(1) |
706 |
925 |
| Total Non- current prepayment and other assets |
3,168 |
3,547 |
| Total prepayment and other assets |
14,541 |
14,526 |
| (1) Financial assets carried at amortized cost |
5,106 |
5,127 |
Withholding taxes and others primarily consist of input
tax credits and Cenvat/VAT recoverable from Government of India.
| (3) | | Deposit with corporations represents amounts deposited to settle certain employee-related
obligations as and when they arise during the normal course of business. |
| (4) | | Includes technology assets taken over by the Group from a customer as a part of transformation
project which is not considered as distinct goods or services and the control related to the assets is not transferred to the Group in
accordance with IFRS 15 - Revenue from contract with customers. Accordingly, the same has been considered as a reduction to the total
contract value and accounted as Deferred contract cost. The Group has entered into financing arrangements with a third party for these
assets. As at June 30, 2023, the financial liability pertaining to such arrangements amounts to 582
crore. During the three months ended June 30, 2023, 20 crore was settled directly by the third party
to the customer on behalf of the Group and accordingly considered as non-cash transaction (Refer to note 2.6) |
2.6 Other liabilities
Other liabilities comprise the following:
(In crore)
| Particulars |
As at |
| |
June 30, 2023 |
March 31, 2023 |
| Current |
|
|
| Accrued compensation to employees(1) |
3,794 |
4,174 |
| Accrued expenses(1) |
7,384 |
7,802 |
| Withholding taxes and others(3) |
3,975 |
3,632 |
| Retention money(1) |
15 |
20 |
| Liabilities of controlled trusts(1) |
211 |
211 |
| Deferred income - government grants(3) |
11 |
29 |
| Accrued defined benefit liability (3) |
4 |
4 |
| Liability towards contingent consideration(2) |
99 |
97 |
| Capital Creditors(1) |
263 |
674 |
| Final dividend payable to shareholders(1)(5) |
6,523 |
– |
| Other non-financial liabilities (3) |
2 |
2 |
| Other financial liabilities(1)(4) |
1,760 |
2,503 |
| Financial liability under option arrangements(2)# |
627 |
600 |
| Total current other liabilities |
24,668 |
19,748 |
| Non-current |
|
|
| Accrued expenses(1) |
1,535 |
1,628 |
| Accrued defined benefit liability (3) |
280 |
445 |
| Accrued compensation to employees(1) |
7 |
5 |
| Deferred income - government grants(3) |
63 |
43 |
| Deferred income(3) |
6 |
6 |
| Other financial liabilities(1)(4) |
243 |
342 |
| Other non-financial liabilities(3) |
7 |
6 |
| Total non-current other liabilities |
2,141 |
2,475 |
| Total other liabilities |
26,809 |
22,223 |
| (1) Financial liability carried at amortized cost |
21,735 |
17,359 |
| (2) Financial liability carried at fair value through profit or loss |
726 |
697 |
| (3) | | Non financial liabilities |
| (4) | | Deferred contract cost (Refer to note 2.5) includes technology assets taken over by the Group
from a customer as a part of transformation project which is not considered as distinct goods or services and the control related to
the assets is not transferred to the Group in accordance with IFRS 15 - Revenue from contract with customers. Accordingly, the same has
been considered as a reduction to the total contract value and accounted as Deferred contract cost. The Group has entered into financing
arrangements with a third party for these assets. As at June 30, 2023, the financial liability pertaining to such arrangements amounts
to 582 crore. During the three months ended June 30, 2023, 20 crore
was settled directly by the third party to the customer on behalf of the Group and accordingly considered as non-cash transaction. |
| (5) | | Pertains to final dividend declared by the Company for fiscal 23 and approved by the shareholders
on June 28, 2023. Payment date for dividend is July 3, 2023 (refer to note 2.19.1) |
| # | | Represents liability related to options issued by the Group over the non-controlling interests
in its subsidiaries |
Accrued expenses primarily relates to cost of technical
sub-contractors, telecommunication charges, legal and professional charges, brand building expenses, overseas travel expenses and office
maintenance and cost of third party software and hardware.
2.7 Provisions and other contingencies
Accounting Policy
Provisions
A provision is recognized if, as a result of a past
event, the Group has a present legal or constructive obligation that is reasonably estimable, and it is probable that an outflow of economic
benefits will be required to settle the obligation. Provisions are determined by discounting the expected future cash flows at a pre-tax
rate that reflects current market assessments of the time value of money and the risks specific to the liability.
Contingent liability is a possible obligation arising
from past events and whose existence will be confirmed only by the occurrence or non-occurrence of one or more uncertain future events
not wholly within the control of the entity or a present obligation that arises from past events but is not recognized because it is not
probable that an outflow of resources embodying economic benefits will be required to settle the obligation or the amount of the obligation
cannot be measured with sufficient reliability.
a. Post sales client support
The Group provides its clients with a fixed-period
post sales support on its fixed-price, fixed-timeframe contracts. Costs associated with such support services are accrued at the time
related revenues are recorded and included in cost of sales. The Group estimates such costs based on historical experience and estimates
are reviewed on a periodic basis for any material changes in assumptions and likelihood of occurrence.
b. Onerous contracts
Provisions for onerous contracts are recognized when
the expected benefits to be derived by the Group from a contract are lower than the unavoidable costs of meeting the future obligations
under the contract. Provisions for estimated losses, if any, on incomplete contracts are recorded in the period in which such losses become
probable based on the estimated efforts or costs to complete the contract. The provision is measured at the present value of the lower
of the expected cost of terminating the contract and the expected net cost of continuing with the contract. Before a provision is established
the Group recognizes any impairment loss on the assets associated with that contract.
Provision for post sales client support and other
provisions
(In crore)
| Particulars |
As at |
| |
June 30, 2023 |
March 31, 2023 |
| Post sales client support and other provisions |
1,538 |
1,307 |
| Total provisions |
1,538 |
1,307 |
Provision for post sales client support represents
cost associated with providing post sales support services which are accrued at the time of recognition of revenues and are expected to
be utilized over a period of 1 year.
Provision for post sales client support and other provisions
is included in cost of sales in the interim consolidated statement of comprehensive income.
As at June 30, 2023 and March 31, 2023 claims against
the Group, not acknowledged as debts, (excluding demands from income tax authorities - Refer to note 2.13) amounted to 728 crore
and 700 crore respectively.
Legal proceedings
The Group is subject to legal proceedings and claims,
which have arisen in the ordinary course of business. The Group’s management reasonably expects that these legal actions, when ultimately
concluded and determined, will not have a material and adverse effect on the Group’s results of operations or financial condition.
2.8 Property, plant and equipment
Accounting Policy
Property, plant and equipment are stated at cost, less
accumulated depreciation and impairment, if any. Costs directly attributable to acquisition are capitalized until the property, plant
and equipment are ready for use, as intended by the Management. The charge in respect of periodic depreciation is derived at after determining
an estimate of an asset’s expected useful life and the expected residual value at the end of its life. The Group depreciates property,
plant and equipment over their estimated useful lives using the straight-line method. The estimated useful lives of assets are as follows:
| Building |
22-25 years |
| Plant and machinery(1) |
5 years |
| Computer equipment |
3-5 years |
| Furniture and fixtures |
5 years |
| Vehicles |
5 years |
| Leasehold improvements |
Lower of useful life of the asset or lease term |
| (1) | | Includes solar plant with a useful life of 25 years |
Depreciation methods, useful lives and residual values
are reviewed periodically, including at each financial year end. The useful lives are based on historical experience with similar assets
as well as anticipation of future events, which may impact their life, such as changes in technology.
Advances paid towards the acquisition of property,
plant and equipment outstanding at each balance sheet date and the cost of assets not ready to use before such date are disclosed under
‘Capital work-in-progress’. Subsequent expenditures relating to property, plant and equipment is capitalized only when it
is probable that future economic benefits associated with these will flow to the Group and the cost of the item can be measured reliably.
The cost and related accumulated depreciation are eliminated from the financial statements upon sale or retirement of the asset.
Impairment
Property, plant and equipment are evaluated for recoverability
whenever events or changes in circumstances indicate that their carrying amounts may not be recoverable. For the purpose of impairment
testing, the recoverable amount (i.e. the higher of the fair value less cost to sell and the value-in-use) is determined on an individual
asset basis unless the asset does not generate cash flows that are largely independent of those from other assets. In such cases, the
recoverable amount is determined for the Cash Generating Unit (CGU) to which the asset belongs.
If such assets are considered to be impaired, the impairment
to be recognized in net profit in the interim condensed consolidated statement of comprehensive income is measured by the amount by which
the carrying value of the assets exceeds the estimated recoverable amount of the asset. An impairment loss is reversed in net profit in
the consolidated statement of comprehensive income if there has been a change in the estimates used to determine the recoverable amount.
The carrying amount of the asset is increased to its revised recoverable amount, provided that this amount does not exceed the carrying
amount that would have been determined (net of any accumulated depreciation) had no impairment loss been recognized for the asset in prior
years.
The changes in the carrying value of property, plant
and equipment for the three months ended June 30, 2023 are as follows:
(In crore)
| Particulars |
Land |
Buildings |
Plant and machinery |
Computer equipment |
Furniture and fixtures |
Vehicles |
Total |
| Gross carrying value as at April 1, 2023 |
1,429 |
11,562 |
5,169 |
8,519 |
3,365 |
45 |
30,089 |
| Additions |
– |
5 |
58 |
219 |
45 |
– |
327 |
| Deletions* |
– |
– |
(51) |
(266) |
(29) |
– |
(346) |
| Translation difference |
– |
(53) |
(6) |
(1) |
(8) |
– |
(68) |
| Gross carrying value as at June 30, 2023 |
1,429 |
11,514 |
5,170 |
8,471 |
3,373 |
45 |
30,002 |
| Accumulated depreciation as at April 1, 2023 |
– |
(4,535) |
(3,877) |
(5,826) |
(2,465) |
(40) |
(16,743) |
| Depreciation |
– |
(109) |
(117) |
(362) |
(100) |
(1) |
(689) |
| Accumulated depreciation on deletions* |
– |
– |
50 |
265 |
28 |
– |
343 |
| Translation difference |
– |
13 |
5 |
1 |
7 |
– |
26 |
| Accumulated depreciation as at June 30, 2023 |
– |
(4,631) |
(3,939) |
(5,922) |
(2,530) |
(41) |
(17,063) |
| Capital work-in progress as at April 1, 2023 |
|
|
|
|
|
|
447 |
| Carrying value as at April 1, 2023 |
1,429 |
7,027 |
1,292 |
2,693 |
900 |
5 |
13,793 |
| Capital work-in progress as at June 30, 2023 |
|
|
|
|
|
|
499 |
| Carrying value as at June 30, 2023 |
1,429 |
6,883 |
1,231 |
2,549 |
843 |
4 |
13,438 |
| * | | During the three months ended June 30, 2023, certain assets which were not in use having
gross book value of 320 crore (net book value: Nil) were retired. |
The changes in the carrying value of property, plant
and equipment for the three months ended June 30, 2022 were as follows:
(In crore)
| Particulars |
Land |
Buildings |
Plant and machinery |
Computer equipment |
Furniture and fixtures |
Vehicles |
Total |
| Gross carrying value as at April 1, 2022 |
1,429 |
11,224 |
4,950 |
8,527 |
3,201 |
44 |
29,375 |
| Additions - Business Combination |
– |
– |
5 |
3 |
3 |
– |
11 |
| Additions |
– |
132 |
87 |
333 |
96 |
– |
648 |
| Deletions* |
– |
– |
(23) |
(71) |
(28) |
– |
(122) |
| Translation difference |
– |
(13) |
(2) |
(2) |
(1) |
– |
(18) |
| Gross carrying value as at June 30, 2022 |
1,429 |
11,343 |
5,017 |
8,790 |
3,271 |
44 |
29,894 |
| Accumulated depreciation as at April 1, 2022 |
– |
(4,100) |
(3,677) |
(6,034) |
(2,452) |
(37) |
(16,300) |
| Depreciation |
– |
(107) |
(112) |
(301) |
(85) |
(1) |
(606) |
| Accumulated depreciation on deletions* |
– |
– |
23 |
71 |
28 |
– |
122 |
| Translation difference |
– |
2 |
2 |
– |
– |
– |
4 |
| Accumulated depreciation as at June 30, 2022 |
– |
(4,205) |
(3,764) |
(6,264) |
(2,509) |
(38) |
(16,780) |
| Capital work-in progress as at April 1, 2022 |
|
|
|
|
|
|
504 |
| Carrying value as at April 1, 2022 |
1,429 |
7,124 |
1,273 |
2,493 |
749 |
7 |
13,579 |
| Capital work-in progress as at June 30, 2022 |
|
|
|
|
|
|
365 |
| Carrying value as at June 30, 2022 |
1,429 |
7,138 |
1,253 |
2,526 |
762 |
6 |
13,479 |
| * | | During the three months ended June 30, 2022, certain assets which were not in use having
gross book value of 68 crore (net book value: Nil) were retired. |
The aggregate depreciation expense is included in cost
of sales in the interim condensed consolidated statement of comprehensive income.
Repairs and maintenance costs are recognized in the
interim condensed consolidated statement of comprehensive income when incurred.
The Group had contractual commitments for capital expenditure
primarily comprising of commitments for infrastructure facilities and computer equipment aggregating to 861 crore and 959
crore as at June 30, 2023 and March 31, 2023, respectively.
2.9 Leases
Accounting Policy
The Group as a lessee
The Group’s lease asset classes primarily consist
of leases for land, buildings and computers. The Group assesses whether a contract contains a lease, at inception of a contract. A contract
is, or contains, a lease if the contract conveys the right to control the use of an identified asset for a period of time in exchange
for consideration. To assess whether a contract conveys the right to control the use of an identified asset, the Group assesses whether:
(1) the contract involves the use of an identified asset (2) the Group has substantially all of the economic benefits from use of the
asset through the period of the lease and (3) the Group has the right to direct the use of the asset.
At the date of commencement of the lease, the Group
recognizes a right-of-use asset (“ROU”) and a corresponding lease liability for all lease arrangements in which it is a lessee,
except for leases with a term of twelve months or less (short-term leases) and low value leases. For these short-term and low value leases,
the Group recognizes the lease payments as an operating expense on a straight-line basis over the term of the lease.
As a lessee, the Group determines the lease term as
the non-cancellable period of a lease adjusted with any option to extend or terminate the lease, if the use of such option is reasonably
certain. The Group makes an assessment on the expected lease term on a lease-by-lease basis and thereby assesses whether it is reasonably
certain that any options to extend or terminate the contract will be exercised. In evaluating the lease term, the Company considers factors
such as any significant leasehold improvements undertaken over the lease term, costs relating to the termination of the lease and the
importance of the underlying asset to Group’s operations taking into account the location of the underlying asset and the availability
of suitable alternatives. The lease term in future periods is reassessed to ensure that the lease term reflects the current economic circumstances.
Certain lease arrangements include the options to extend
or terminate the lease before the end of the lease term. ROU assets and lease liabilities includes these options when it is reasonably
certain that they will be exercised.
The right-of-use assets are initially recognized at
cost, which comprises the initial amount of the lease liability adjusted for any lease payments made at or prior to the commencement date
of the lease plus any initial direct costs less any lease incentives. They are subsequently measured at cost less accumulated depreciation
and impairment losses.
Right-of-use assets are depreciated from the commencement
date on a straight-line basis over the shorter of the lease term and useful life of the underlying asset.
Right-of-use assets are evaluated for recoverability
whenever events or changes in circumstances indicate that their carrying amounts may not be recoverable. For the purpose of impairment
testing, the recoverable amount (i.e. the higher of the fair value less cost to sell and the value-in-use) is determined on an individual
asset basis unless the asset does not generate cash flows that are largely independent of those from other assets. In such cases, the
recoverable amount is determined for the Cash Generating Unit (CGU) to which the asset belongs.
The lease liability is initially measured at amortized
cost at the present value of the future lease payments. The lease payments are discounted using the interest rate implicit in the lease
or, if not readily determinable, using the incremental borrowing rates in the country of domicile of these leases. Lease liabilities are
remeasured with a corresponding adjustment to the related right-of-use asset if the group changes its assessment if whether it will exercise
an extension or a termination option.
Lease liability and ROU asset have been separately
presented in the Balance Sheet and lease payments have been classified as financing cash flows.
The Group as a lessor
Leases for which the group is a lessor is classified
as a finance or operating lease. Whenever the terms of the lease transfer substantially all the risks and rewards of ownership to the
lessee, the contract is classified as a finance lease. All other leases are classified as operating leases.
When the Group is an intermediate lessor, it accounts
for its interests in the head lease and the sublease separately. The sublease is classified as a finance or operating lease by reference
to the right-of-use asset arising from the head lease.
For operating leases, rental income is recognized on
a straight line basis over the term of the relevant lease.
Following are the changes in the carrying value of
right-of-use assets for the three months ended June 30, 2023:
(In crore)
| Particulars |
Category of ROU asset |
Total |
| |
Land |
Buildings |
Vehicles |
Computers |
|
| Balance as of April 1, 2023 |
623 |
3,896 |
15 |
2,348 |
6,882 |
| Additions* |
– |
244 |
2 |
557 |
803 |
| Deletions |
– |
(8) |
– |
(233) |
(241) |
| Depreciation |
(2) |
(184) |
(2) |
(192) |
(380) |
| Translation difference |
(4) |
(1) |
– |
(10) |
(15) |
| Balance as of June 30, 2023 |
617 |
3,947 |
15 |
2,470 |
7,049 |
| * | | Net of adjustments on account of modifications and lease incentives |
Following are the changes in the carrying value of
right-of-use assets for the three months ended June 30, 2022:
(In crore)
| Particulars |
Category of ROU asset |
Total |
| |
Land |
Buildings |
Vehicles |
Computers |
|
| Balance as of April 1, 2022 |
628 |
3,711 |
16 |
468 |
4,823 |
| Additions* |
– |
419 |
1 |
352 |
772 |
| Deletions |
– |
(1) |
– |
(76) |
(77) |
| Depreciation |
(1) |
(162) |
(3) |
(59) |
(225) |
| Translation difference |
(1) |
(10) |
– |
1 |
(10) |
| Balance as of June 30, 2022 |
626 |
3,957 |
14 |
686 |
5,283 |
| * | | Net of adjustments on account of modifications and lease incentives |
The aggregate depreciation expense on ROU assets is
included in cost of sales in the interim condensed consolidated statement of comprehensive income.
The following is the break-up of current and non-current
lease liabilities as of June 30, 2023 and March 31, 2023:
(In crore)
| Particulars |
As at |
| |
June 30, 2023 |
March 31, 2023 |
| Current lease liabilities |
1,824 |
1,242 |
| Non-current lease liabilities |
6,659 |
7,057 |
| Total |
8,483 |
8,299 |
2.10 Goodwill and Intangible assets
2.10.1 Goodwill
Accounting Policy
Goodwill represents the purchase consideration in excess
of the Group's interest in the net fair value of identifiable assets, liabilities and contingent liabilities of the acquired entity. When
the net fair value of the identifiable assets, liabilities and contingent liabilities acquired exceeds the purchase consideration, the
fair value of net assets acquired is reassessed and the bargain purchase gain is recognized immediately in the net profit in the Statement
of Comprehensive Income. Goodwill is measured at cost less accumulated impairment losses.
Impairment
Goodwill is tested for impairment on an annual basis
and whenever there is an indication that the recoverable amount of a cash generating unit (CGU) is less than its carrying amount. For
the impairment test, goodwill is allocated to the CGU or groups of CGU’s which benefit from the synergies of the acquisition and
which represents the lowest level at which goodwill is monitored for internal management purposes. A CGU is the smallest identifiable
group of assets that generates cash inflows that are largely independent of the cash inflows from other assets or group of assets. Impairment
occurs when the carrying amount of a CGU including the goodwill, exceeds the estimated recoverable amount of the CGU. The recoverable
amount of a CGU is the higher of its fair value less cost to sell and its value-in-use. Value-in-use is the present value of future cash
flows expected to be derived from the CGU. Key assumptions in the cash flow projections are prepared based on current economic conditions
and includes estimated long term growth rates, weighted average cost of capital and estimated operating margins.
Following is a summary of changes in the carrying amount
of goodwill:
(In crore)
| Particulars |
As at |
| |
June 30, 2023 |
March 31, 2023 |
| Carrying value at the beginning |
7,248 |
6,195 |
| Goodwill on acquisitions (Refer to Note 2.11) |
– |
630 |
| Translation differences |
(15) |
423 |
| Carrying value at the end |
7,233 |
7,248 |
For the purpose of impairment testing, goodwill acquired
in a business combination is allocated to the CGU or groups of CGUs, which benefit from the synergies of the acquisition.
2.10.2 Intangible assets
Accounting Policy
Intangible assets are stated at cost less accumulated
amortization and impairment. Intangible assets are amortized over their respective individual estimated useful lives on a straight-line
basis, from the date that they are available for use. The estimated useful life of an identifiable intangible asset is based on a number
of factors including the effects of obsolescence, demand, competition, and other economic factors (such as the stability of the industry
and known technological advances), and the level of maintenance expenditures required to obtain the expected future cash flows from the
asset. Amortization methods and useful lives are reviewed periodically including at each financial year end.
Research costs are expensed as incurred. Software product
development costs are expensed as incurred unless technical and commercial feasibility of the project is demonstrated, future economic
benefits are probable, the group has an intention and ability to complete and use or sell the software and the costs can be measured reliably.
The costs which can be capitalized include the cost of material, direct labour, overhead costs that are directly attributable to preparing
the asset for its intended use.
Impairment
Intangible assets are evaluated for recoverability
whenever events or changes in circumstances indicate that their carrying amounts may not be recoverable. For the purpose of impairment
testing, the recoverable amount (i.e. the higher of the fair value less cost to sell and the value-in-use) is determined on an individual
asset basis unless the asset does not generate cash flows that are largely independent of those from other assets. In such cases, the
recoverable amount is determined for the CGU to which the asset belongs.
If such assets are considered to be impaired, the impairment
to be recognized in net profit in the statement of comprehensive income is measured by the amount by which the carrying value of the assets
exceeds the estimated recoverable amount of the asset. An impairment loss is reversed in net profit in the statement of comprehensive
income if there has been a change in the estimates used to determine the recoverable amount. The carrying amount of the asset is increased
to its revised recoverable amount, provided that this amount does not exceed the carrying amount that would have been determined (net
of any accumulated amortization) had no impairment loss been recognized for the asset in prior years.
2.11 Business combinations
Accounting policy
Business combinations have been accounted for using
the acquisition method under the provisions of IFRS 3 (Revised), Business Combinations.
The purchase price in an acquisition is measured at
the fair value of the assets transferred, equity instruments issued and liabilities incurred or assumed at the date of acquisition, which
is the date on which control is transferred to the Group. The purchase price also includes the fair value of any contingent consideration.
Identifiable assets acquired and liabilities and contingent liabilities assumed in a business combination are measured initially at their
fair value on the date of acquisition. Contingent consideration is remeasured at fair value at each reporting date and changes in the
fair value of the contingent consideration are recognized in the Interim Condensed Consolidated Statement of Comprehensive Income.
The interest of non-controlling shareholders is initially
measured either at fair value or at the non-controlling interests’ proportionate share of the acquiree’s identifiable net
assets. The choice of measurement basis is made on an acquisition-by-acquisition basis. Subsequent to acquisition, the carrying amount
of non-controlling interests is the amount of those interests at initial recognition plus the non-controlling interests’ share of
subsequent changes in equity of subsidiaries.
Business combinations between entities under common
control is outside the scope of IFRS 3 (Revised), Business Combinations and is accounted for at carrying value of assets acquired and
liabilities assumed.
The payments related to options issued by the Group
over the non-controlling interests in its subsidiaries are accounted as financial liabilities and initially recognized at the estimated
present value of gross obligations. Such options are subsequently measured at fair value in order to reflect the amount payable under
the option at the date at which it becomes exercisable. In the event that the option expires unexercised, the liability is derecognized.
Transaction costs that the Group incurs in connection
with a business combination such as finder’s fees, legal fees, due diligence fees, and other professional and consulting fees are
expensed as incurred.
2.12 Employees' Stock Option Plans (ESOP)
Accounting Policy
The Group recognizes compensation expense relating
to share-based payments in net profit based on estimated fair-values of the awards on the grant date. The estimated fair value of awards
is recognized as an expense in net profit in the interim condensed consolidated statement of comprehensive income on a straight-line basis
over the requisite service period for each separately vesting portion of the award as if the award was in-substance, multiple awards with
a corresponding increase to share premium.
Infosys Expanded Stock Ownership Program 2019 (the
2019 Plan):
On June 22, 2019 pursuant to the approval by the shareholders
in the Annual General Meeting, the Board has been authorized to introduce, offer, issue and provide share-based incentives to eligible
employees of the Company and its subsidiaries under the 2019 Plan. The maximum number of shares under the 2019 plan shall not exceed 50,000,000
equity shares. To implement the 2019 Plan , up to 45,000,000 equity shares may be issued by way of secondary acquisition of shares by
the Infosys Expanded Stock Ownership Trust. The Restricted Stock Units (RSUs) granted under the 2019 plan shall vest based on the achievement
of defined annual performance parameters as determined by the administrator (Nomination and Remuneration Committee). The performance parameters
will be based on a combination of relative Total Shareholder Return (TSR) against selected industry peers and certain broader market domestic
and global indices and operating performance metrics of the company as decided by administrator. Each of the above performance parameters
will be distinct for the purposes of calculation of quantity of shares to vest based on performance. These instruments will generally
vest between a minimum of 1 to maximum of 3 years from the grant date.
2015 Stock Incentive Compensation Plan (the 2015
Plan):
On March 31, 2016, pursuant to the approval by the
shareholders through postal ballot, the Board was authorized to introduce, offer, issue and allot share-based incentives to eligible employees
of the Company and its subsidiaries under the 2015 Stock Incentive Compensation Plan. The maximum number of shares under the 2015 plan
shall not exceed 24,038,883 equity shares (this includes 11,223,576 equity shares which are held by the trust towards the 2011 Plan as
at March 31, 2016). These instruments will generally vest over a period of 4 years. The plan numbers mentioned above are further adjusted
with the September 2018 bonus issue.
The equity settled and cash settled RSUs and stock
options would vest generally over a period of 4 years and shall be exercisable within the period as approved by the Nomination and Remuneration
Committee (NARC). The exercise price of the RSUs will be equal to the par value of the shares and the exercise price of the stock options
would be the market price as on the date of grant.
Controlled trust holds 11,738,357 and 12,172,119 shares
as at June 30, 2023 and March 31, 2023, respectively under the 2015 plan, out of which 200,000 equity shares each have been earmarked
for welfare activities of the employees as at June 30, 2023 and March 31, 2023.
The following is the summary of grants made during
the three months ended June 30, 2023 and June 30, 2022:
| |
2019 Plan |
2015 Plan |
| Particulars |
Three months ended June 30, |
Three months ended June 30, |
| |
2023 |
2022 |
2023 |
2022 |
| Equity settled RSUs |
|
|
|
|
| Key Managerial Personnel (KMP) |
78,281 |
176,893 |
333,596 |
101,967 |
| Employees other than KMP |
– |
370,960 |
4,500 |
– |
| Total Grants |
78,281 |
547,853 |
338,096 |
101,967 |
Notes on grants to KMP:
CEO & MD
Under the 2015 plan:
The Board, on April 13, 2023, based on the recommendations
of the Nomination and Remuneration Committee, approved the grant of performance-based RSUs (Annual performance equity grant) of fair value
of 34.75 crore for fiscal 2024 under the 2015 Plan. These RSUs will vest in line with the employment agreement based on achievement
of certain performance targets. Accordingly, 2,72,026 performance based RSU’s were granted effective May 2, 2023.
The Board, on April 13, 2023, based on the recommendations
of the Nomination and Remuneration Committee, approved the performance-based grant of RSUs (Annual performance equity ESG grant) of fair
value of 2 crore for fiscal 2024 under the 2015 Plan. These RSUs will vest in line with the employment agreement based on achievement
of certain environment, social and governance milestones as determined by the Board. Accordingly, 15,656 performance based RSU’s
were granted effective May 2, 2023.
The Board, on April 13, 2023, based on the recommendations
of the Nomination and Remuneration Committee, approved the performance-based grant of RSUs (Annual performance Equity TSR grant) of fair
value of 5 crore for fiscal 2024 under the 2015 Plan. These RSUs will vest in line with the employment agreement based on Company’s
performance on cumulative relative TSR over the years and as determined by the Board. Accordingly, 39,140 performance based RSU’s
were granted effective May 2, 2023.
Though the annual time based grants and annual performance
equity TSR grant for the remaining employment term ending on March 31, 2027 have not been granted as of June 30, 2023, since the service
commencement date precedes the grant date, the company has recorded employment stock compensation expense in accordance with IFRS 2, Share
based payments. The grant date for this purpose in accordance with IFRS 2, Share based payments is July 1, 2022.
Under the 2019 plan:
The Board, on April 13, 2023, based on the recommendations
of the Nomination and Remuneration Committee, approved performance-based grant of RSUs amounting to 10 crore for fiscal 2024 under
the 2019 Plan. These RSUs will vest based on achievement of certain performance targets. Accordingly, 78,281 performance based RSU’s
were granted effective May 2, 2023.
Other KMP
Under the 2015 plan:
During the three months ended June 30, 2023, based
on recommendations of Nomination and Remuneration Committee, the Board approved 6,774 performance based RSUs to a KMP under the 2015 plan.
The performance based RSUs will vest over three years based on certain performance targets.
The break-up of employee stock compensation expense
is as follows:
(in crore)
| Particulars |
Three months ended June 30, |
| |
2023 |
2022 |
| Granted to: |
|
|
| KMP |
20 |
17 |
| Employees other than KMP |
126 |
115 |
| Total (1) |
146 |
132 |
| (1) Cash settled stock compensation expense included in the above |
2 |
(2) |
The fair value of the awards are estimated using the
Black-Scholes Model for time and non-market performance based options and Monte Carlo simulation model is used for TSR based options.
The inputs to the model include the share price at
date of grant, exercise price, expected volatility, expected dividends, expected term and the risk free rate of interest. Expected volatility
during the expected term of the options is based on historical volatility of the observed market prices of the Company's publicly traded
equity shares during a period equivalent to the expected term of the options. Expected volatility of the comparative company have been
modelled based on historical movements in the market prices of their publicly traded equity shares during a period equivalent to the expected
term of the options. Correlation coefficient is calculated between each peer entity and the indices as a whole or between each entity
in the peer group.
The fair value of each equity settled award is estimated
on the date of grant using the following assumptions:
| Particulars |
For options granted in |
| |
Fiscal 2024-
Equity Shares-RSU |
Fiscal 2023-
Equity Shares-RSU |
Fiscal 2023-
ADS-RSU |
| Weighted average share price () / ($ ADS) |
1,277 |
1,525 |
18.08 |
| Exercise price ()/ ($ ADS) |
5.00 |
5.00 |
0.07 |
| Expected volatility (%) |
25-31 |
23-32 |
27-34 |
| Expected life of the option (years) |
1-4 |
1-4 |
1-4 |
| Expected dividends (%) |
2-3 |
2-3 |
2-3 |
| Risk-free interest rate (%) |
7 |
5-7 |
2-5 |
| Weighted average fair value as on grant date () / ($ ADS) |
1,113 |
1,210 |
13.69 |
The expected life of the RSU/ESOP is estimated based
on the vesting term and contractual term of the RSU/ESOP, as well as expected exercise behavior of the employee who receives the RSU/Stock
option.
2.13 Income Taxes
Accounting policy
Income tax expense comprises current and deferred income
tax. Income tax expense is recognized in net profit in the Interim Condensed Consolidated Statement of Comprehensive income except to
the extent that it relates to items recognized directly in equity, in which case it is recognized in equity or other comprehensive income.
Current income tax for current and prior periods is recognized at the amount expected to be paid to or recovered from the tax authorities,
using the tax rates and tax laws that have been enacted or substantively enacted by the Balance Sheet date. Deferred income tax assets
and liabilities are recognized for all temporary differences arising between the tax bases of assets and liabilities and their carrying
amounts in the financial statements except when the deferred income tax arises from the initial recognition of goodwill or an asset or
liability in a transaction that is not a business combination and affects neither accounting nor taxable profit or loss at the time of
the transaction. Deferred tax assets are reviewed at each reporting date and are reduced to the extent that it is no longer probable that
the related tax benefit will be realized.
Deferred income tax assets and liabilities are measured
using tax rates and tax laws that have been enacted or substantively enacted by the Balance Sheet date and are expected to apply to taxable
income in the years in which those temporary differences are expected to be recovered or settled. The effect of changes in tax rates on
deferred income tax assets and liabilities is recognized as income or expense in the period that includes the enactment or the substantive
enactment date. A deferred income tax asset is recognized to the extent that it is probable that future taxable profit will be available
against which the deductible temporary differences and tax losses can be utilized. Deferred income taxes are not provided on the undistributed
earnings of subsidiaries and branches where it is expected that the earnings of the subsidiary or branch will not be distributed in the
foreseeable future.
The Group offsets current tax assets and current tax
liabilities; deferred tax assets and deferred tax liabilities, where it has a legally enforceable right to set off the recognized amounts
and where it intends either to settle on a net basis, or to realize the asset and settle the liability simultaneously. The income tax
provision for the interim period is made based on the best estimate of the annual average tax rate expected to be applicable for the full
financial year. Tax benefits of deductions earned on exercise of employee share options in excess of compensation charged to income are
credited to equity.
Income tax expense in the interim consolidated statement
of comprehensive income comprises:
(In crore)
| Particulars |
Three months ended June 30, |
| |
2023 |
2022 |
| Current taxes |
|
|
| Domestic taxes |
1,708 |
1,670 |
| Foreign taxes |
599 |
680 |
| |
2,307 |
2,350 |
| Deferred taxes |
|
|
| Domestic taxes |
192 |
30 |
| Foreign taxes |
(82) |
(208) |
| |
110 |
(178) |
| Income tax expense |
2,417 |
2,172 |
Income tax expense for the three months ended June
30, 2023 and June 30, 2022 includes reversals (net of provisions) of 15 crore and provisions (net of reversals) of 35 crore,
respectively. These provisions and reversals pertaining to prior periods are primarily on account of adjudication of certain disputed
matters, upon filing of tax return and completion of assessments, across various jurisdictions.
Deferred income tax for the three months ended June
30, 2023 and June 30, 2022 substantially relates to origination and reversal of temporary differences.
The Company’s Advanced Pricing Arrangement (APA)
with the Internal Revenue Service (IRS) for US branch income tax expired in March 2021. The Company has applied for renewal of APA and
currently the US taxable income is based on the Company’s best estimate determined based on the expected value method.
As at June 30, 2023, claims against the Group not acknowledged
as debts from the Income tax authorities amounted to 4,066 crore.
As at March 31, 2023, claims against the Group not
acknowledged as debts from the Income tax authorities amounted to 4,062 crore.
The amount paid to statutory authorities against the
tax claims amounted to 6,498 crore and 6,528 crore as at June 30, 2023 and March 31, 2023, respectively.
The claims against the group primarily represent demands
arising on completion of assessment proceedings under the Income Tax Act, 1961. These claims are on account of multiple issues of disallowances
such as disallowance of profits earned from STP Units and SEZ Units, disallowance of deductions in respect of employment of new employees
under section 80JJAA, disallowance of expenditure towards software being held as capital in nature, payments made to Associated Enterprises
held as liable for withholding of taxes. These matters are pending before various Income Tax Authorities and the management including
its tax advisors expect that its position will likely be upheld on ultimate resolution and will not have a material adverse effect on
the Group's financial position and results of operations.
2.14 Basic and diluted shares used in computing
earnings per equity share
Accounting Policy
Basic earnings per equity share is computed by dividing
the net profit attributable to the equity holders of the Group by the weighted average number of equity shares outstanding during the
period. Diluted earnings per equity share is computed by dividing the net profit attributable to the equity holders of the Group by the
weighted average number of equity shares considered for deriving basic earnings per equity share and also the weighted average number
of equity shares that could have been issued upon conversion of all dilutive potential equity shares. The dilutive potential equity shares
are adjusted for the proceeds receivable had the equity shares been actually issued at fair value (i.e. the average market value of the
outstanding equity shares). Dilutive potential equity shares are deemed converted as at the beginning of the period, unless issued at
a later date. Dilutive potential equity shares are determined independently for each period presented.
The number of equity shares and potentially dilutive
equity shares are adjusted retrospectively for all periods presented for any share splits and bonus shares issues including for changes
effected prior to the approval of the financial statements by the Board of Directors.
2.15 Related party transactions
Refer to note 2.14 "Related party transactions"
in the Company’s 2023 Consolidated financial statements under IFRS in Indian rupee for the full names and other details of the Company's
subsidiaries and controlled trusts.
Changes in Subsidiaries
During the three months ended June 30, 2023, there
are no changes in the subsidiaries.
Change in key management personnel
The following are the changes in the key management
personnel:
Independent directors:
-Helene Auriol Potier (appointed as independent director
effective May 26, 2023)
Executive Officers:
-Mohit Joshi (resigned as President effective
March 11, 2023 and was on leave till June 9, 2023 which was his last date with the company)
Transactions with key management personnel
The table below describes the related party transactions
with key management personnel which comprise directors and executive officers:
(In crore)
| Particulars |
Three months ended June 30, |
| |
2023 |
2022 |
| Salaries and other short term employee benefits to whole-time directors and executive officers(1)(2) |
32 |
32 |
| Commission and other benefits to non-executive/ independent directors |
4 |
4 |
| Total |
36 |
36 |
| (1) | | For the three months ended June 30, 2023 and June 30, 2022, includes a charge of 20
crore and 17 crore respectively, towards employee stock compensation expense. (Refer to note 2.12). |
| (2) | | Does not include post-employment benefits and other long-term benefits based on actuarial
valuation as these are done for the Company as a whole. |
2.16 Segment reporting
IFRS 8 Operating Segments establishes standards for
the way that public business enterprises report information about operating segments and related disclosures about products and services,
geographic areas, and major customers. The Group's operations predominantly relate to providing end-to-end business solutions to enable
clients to enhance business performance. The Chief Operating Decision Maker (CODM) evaluates the Group's performance and allocates resources
based on an analysis of various performance indicators by business segments. Accordingly, information has been presented along business
segments. The accounting principles used in the preparation of the financial statements are consistently applied to record revenue and
expenditure in individual segments, and are as set out in the accounting policies.
Business segments of the Group are primarily enterprises
in Financial Services and Insurance, enterprises in Manufacturing, enterprises in Retail, Consumer Packaged Goods and Logistics, enterprises
in the Energy, Utilities, Resources and Services, enterprises in Communication, Telecom OEM and Media, enterprises in Hi-Tech, enterprises
in Life Sciences and Healthcare and all other segments. The Financial services reportable segments has been aggregated to include the
Financial Services operating segment and Finacle operating segment because of the similarity of the economic characteristics. All other
segments represents the operating segments of businesses in India, Japan, China, Infosys Public Services & other enterprises in Public
Services.
Revenue and identifiable operating expenses in relation
to segments are categorized based on items that are individually identifiable to that segment. Revenue for 'all other segments' represents
revenue generated by Infosys Public Services and revenue generated from customers located in India, Japan and China and other enterprises
in Public services. Allocated expenses of segments include expenses incurred for rendering services from the Group's offshore software
development centers and on-site expenses, which are categorized in relation to the associated efforts of the segment. Certain expenses
such as depreciation and amortization, which form a significant component of total expenses, are not specifically allocable to specific
segments as the underlying assets are used interchangeably. The Management believes that it is not practical to provide segment disclosures
relating to those costs and expenses, and accordingly these expenses are separately disclosed as "unallocated" and adjusted
against the total income of the Group.
Assets and liabilities used in the Group's business
are not identified to any of the reportable segments, as these are used interchangeably between segments. The Management believes that
it is currently not practicable to provide segment disclosures relating to total assets and liabilities since a meaningful segregation
of the available data is onerous.
Business segment revenue information is collated based
on individual customers invoiced or in relation to which the revenue is otherwise recognized.
Disclosure of revenue by geographic locations is given
in note 2.17 Revenue from operations.
2.16.1 Business segments
Three months ended June 30, 2023 and June 30, 2022
(In crore)
| Particulars |
Financial
Services(1) |
Retail(2) |
Communication(3) |
Energy, Utilities,
Resources and
Services |
Manufacturing |
Hi-Tech |
Life Sciences(4) |
All other segments(5) |
Total |
| Revenue |
10,661 |
5,513 |
4,441 |
4,889 |
5,350 |
3,056 |
2,749 |
1,274 |
37,933 |
| |
10,562 |
5,004 |
4,464 |
4,259 |
4,172 |
2,812 |
2,257 |
940 |
34,470 |
| Identifiable operating expenses |
6,147 |
2,869 |
2,640 |
2,690 |
3,523 |
1,743 |
1,593 |
819 |
22,024 |
| |
5,856 |
2,524 |
2,867 |
2,276 |
2,973 |
1,675 |
1,334 |
662 |
20,167 |
| Allocated expenses |
1,969 |
1,015 |
817 |
909 |
855 |
511 |
454 |
315 |
6,845 |
| |
1,952 |
942 |
803 |
838 |
814 |
465 |
388 |
237 |
6,439 |
| Segment Profit |
2,545 |
1,629 |
984 |
1,290 |
972 |
802 |
702 |
140 |
9,064 |
| |
2,754 |
1,538 |
794 |
1,145 |
385 |
672 |
535 |
41 |
7,864 |
| Unallocable expenses |
|
|
|
|
|
|
|
|
1,173 |
| |
|
|
|
|
|
|
|
|
950 |
| Operating profit |
|
|
|
|
|
|
|
|
7,891 |
| |
|
|
|
|
|
|
|
|
6,914 |
| Other income, net (Refer to note 2.20) |
|
|
|
|
|
|
|
|
561 |
| |
|
|
|
|
|
|
|
|
676 |
| Finance cost |
|
|
|
|
|
|
|
|
90 |
| |
|
|
|
|
|
|
|
|
56 |
| Profit before income taxes |
|
|
|
|
|
|
|
|
8,362 |
| |
|
|
|
|
|
|
|
|
7,534 |
| Income tax expense |
|
|
|
|
|
|
|
|
2,417 |
| |
|
|
|
|
|
|
|
|
2,172 |
| Net profit |
|
|
|
|
|
|
|
|
5,945 |
| |
|
|
|
|
|
|
|
|
5,362 |
| Depreciation and amortization |
|
|
|
|
|
|
|
|
1,173 |
| |
|
|
|
|
|
|
|
|
950 |
| Non-cash expenses other than depreciation and amortization |
|
|
|
|
|
|
|
|
– |
| |
|
|
|
|
|
|
|
|
|
|
| (1) | | Financial Services include enterprises in Financial Services and Insurance |
| (2) | | Retail includes enterprises in Retail, Consumer Packaged Goods and Logistics |
| (3) | | Communication includes enterprises in Communication, Telecom OEM and Media |
| (4) | | Life Sciences includes enterprises in Life sciences and Health care |
| (5) | | Others include operating segments of businesses in India, Japan, China, Infosys Public
Services & other enterprises in Public Services |
2.16.2 Significant clients
No client individually accounted for more than 10%
of the revenues for the three months ended June 30, 2023 and June 30, 2022, respectively.
2.17 Revenue from Operations
Accounting Policy:
The Group derives revenues primarily from IT services
comprising software development and related services, cloud and infrastructure services, maintenance, consulting and package implementation,
licensing of software products and platforms across the Group’s core and digital offerings (together called as “software related
services”) and business process management services. Contracts with customers are either on a time-and-material, unit of work, fixed-price
or on a fixed-timeframe basis.
Revenues from customer contracts are considered for
recognition and measurement when the contract has been approved in writing by the parties, to the contract, the parties to contract are
committed to perform their respective obligations under the contract, and the contract is legally enforceable. Revenue is recognized upon
transfer of control of promised products or services (“performance obligations”) to customers in an amount that reflects the
consideration the Group has received or expects to receive in exchange for these products or services (“transaction price”).
When there is uncertainty as to collectability, revenue recognition is postponed until such uncertainty is resolved.
The Group assesses the services promised in a contract
and identifies distinct performance obligations in the contract. The Group allocates the transaction price to each distinct performance
obligation based on the relative standalone selling price. The price that is regularly charged for an item when sold separately is the
best evidence of its standalone selling price. In the absence of such evidence, the primary method used to estimate standalone selling
price is the expected cost plus a margin, under which the Group estimates the cost of satisfying the performance obligation and then adds
an appropriate margin based on similar services.
The Group’s contracts may include variable consideration
including rebates, volume discounts and penalties. The Group includes variable consideration as part of transaction price when there is
a basis to reasonably estimate the amount of the variable consideration and when it is probable that a significant reversal of cumulative
revenue recognized will not occur when the uncertainty associated with the variable consideration is resolved.
Revenue on time-and-material and unit of work based
contracts, are recognized as the related services are performed. Fixed price maintenance revenue is recognized ratably either on a straight-line
basis when services are performed through an indefinite number of repetitive acts over a specified period or ratably using a percentage
of completion method when the pattern of benefits from the services rendered to the customer and Group’s costs to fulfil the contract
is not even through the period of contract because the services are generally discrete in nature and not repetitive. Revenue from other
fixed-price, fixed-timeframe contracts, where the performance obligations are satisfied over time is recognized using the percentage-of-completion
method. Efforts or costs expended are used to determine progress towards completion as there is a direct relationship between input and
productivity. Progress towards completion is measured as the ratio of costs or efforts incurred to date (representing work performed)
to the estimated total costs or efforts. Estimates of transaction price and total costs or efforts are continuously monitored over the
term of the contracts and are recognized in net profit in the period when these estimates change or when the estimates are revised. Revenues
and the estimated total costs or efforts are subject to revision as the contract progresses. Provisions for estimated losses, if any,
on incomplete contracts are recorded in the period in which such losses become probable based on the estimated efforts or costs to complete
the contract.
The billing schedules agreed with customers include
periodic performance based billing and / or milestone based progress billings. Revenues in excess of billing are classified as unbilled
revenue while billing in excess of revenues are classified as contract liabilities (which we refer to as unearned revenues).
In arrangements for software development and related
services and maintenance services, by applying the revenue recognition criteria for each distinct performance obligation, the arrangements
with customers generally meet the criteria for considering software development and related services as distinct performance obligations.
For allocating the transaction price, the Group measures the revenue in respect of each performance obligation of a contract at its relative
standalone selling price. The price that is regularly charged for an item when sold separately is the best evidence of its standalone
selling price. In cases where the Group is unable to determine the standalone selling price, the Group uses the expected cost plus margin
approach in estimating the standalone selling price. For software development and related services, the performance obligations are satisfied
as and when the services are rendered since the customer generally obtains control of the work as it progresses.
Certain cloud and infrastructure services contracts
include multiple elements which may be subject to other specific accounting guidance, such as leasing guidance. These contracts are accounted
in accordance with such specific accounting guidance. In such arrangements where the Group is able to determine that hardware and services
are distinct performance obligations, it allocates the consideration to these performance obligations on a relative standalone selling
price basis. In the absence of standalone selling price, the Group uses the expected cost-plus margin approach in estimating the standalone
selling price. When such arrangements are considered as a single performance obligation, revenue is recognized over the period and measure
of progress is determined based on promise in the contract.
Revenue from licenses where the customer obtains a
“right to use” the licenses is recognized at the time the license is made available to the customer. Revenue from licenses
where the customer obtains a “right to access” is recognized over the access period.
Arrangements to deliver software products generally
have three elements: license, implementation and Annual Technical Services (ATS). When implementation services are provided in conjunction
with the licensing arrangement and the license and implementation have been identified as two distinct separate performance obligations,
the transaction price for such contracts are allocated to each performance obligation of the contract based on their relative standalone
selling prices. In the absence of standalone selling price for implementation, the Group uses the expected cost plus margin approach in
estimating the standalone selling price. Where the license is required to be substantially customized as part of the implementation service
the entire arrangement fee for license and implementation is considered to be a single performance obligation and the revenue is recognized
using the percentage-of-completion method as the implementation is performed. Revenue from client training, support and other services
arising due to the sale of software products is recognized as the performance obligations are satisfied. ATS revenue is recognized ratably
on a straight line basis over the period in which the services are rendered.
Contracts with customers includes subcontractor services
or third-party vendor equipment or software in certain integrated services arrangements. In these types of arrangements, revenue from
sales of third-party vendor products or services is recorded net of costs when the Group is acting as an agent between the customer and
the vendor, and gross when the Group is the principal for the transaction. In doing so, the group first evaluates whether it controls
the good or service before it is transferred to the customer. The Group considers whether it has the primary obligation to fulfil the
contract, inventory risk, pricing discretion and other factors to determine whether it controls the goods or service and therefore is
acting as a principal or an agent.
The incremental costs of obtaining a contract (i.e.,
costs that would not have been incurred if the contract had not been obtained) are recognized as an asset if the Group expects to recover
them.
Certain eligible, nonrecurring costs (e.g. set-up or
transition or transformation costs) that do not represent a separate performance obligation are recognized as an asset when such costs
(a) relate directly to the contract; (b) generate or enhance resources of the Group that will be used in satisfying the performance obligation
in the future; and (c) are expected to be recovered.
Capitalized contract costs relating to upfront payments
to customers are amortized to revenue and other capitalized costs are amortized to cost of sales over the respective contract life on
a systematic basis consistent with the transfer of goods or services to customer to which the asset relates. Capitalized costs are monitored
regularly for impairment. Impairment losses are recorded when present value of projected remaining operating cash flows is not sufficient
to recover the carrying amount of the capitalized costs.
The Group presents revenues net of indirect taxes in
its Interim Condensed Consolidated Statement of Comprehensive Income.
Revenues for the three months June 30, 2023 and June
30, 2022 is as follows:
(In crore)
| Particulars |
Three months ended June 30, |
| |
2023 |
2022 |
| Revenue from software services |
35,735 |
32,278 |
| Revenue from products and platforms |
2,198 |
2,192 |
| Total revenue from operations |
37,933 |
34,470 |
Products & platforms
The Group also derives revenues from the sale of products
and platforms including Finacle – core banking solution, Edge Suite of products, Panaya platform, Infosys Equinox, Infosys Helix,
Infosys Applied AI, Infosys Cortex, Stater digital platform and Infosys McCamish – insurance platform.
Disaggregated revenue information
Revenue disaggregation by business segments has been
included in segment information (Refer note 2.16). The table below presents disaggregated revenues from contracts with customers by geography
and contract type. The Group believes that this disaggregation best depicts how the nature, amount, timing and uncertainty of revenues
and cash flows are affected by industry, market and other economic factors.
For the three months ended June 30, 2023 and June
30, 2022
(In crore)
| Particulars |
Three months ended June 30, |
| |
2023 |
2022 |
| Revenues by Geography* |
|
|
| North America |
23,084 |
21,301 |
| Europe |
10,148 |
8,647 |
| India |
1,020 |
881 |
| Rest of the world |
3,681 |
3,641 |
| Total |
37,933 |
34,470 |
| * | | Geographical revenues is based on the domicile of customer. |
The percentage of revenue from fixed-price contracts
for each of the quarter ended June 30, 2023 and June 30, 2022 is 52%.
Trade Receivables and Contract Balances
The timing of revenue recognition, billings and cash
collections results in receivables, unbilled revenue, and unearned revenue on the Group’s Consolidated Balance Sheet. Amounts are
billed as work progresses in accordance with agreed-upon contractual terms, either at periodic intervals (e.g., monthly or quarterly)
or upon achievement of contractual milestones.
The Group’s Receivables are rights to consideration
that are unconditional. Unbilled revenues comprising revenues in excess of billings from time and material contracts and fixed price maintenance
contracts are classified as financial asset when the right to consideration is unconditional and is due only after a passage of time.
Invoicing to the clients for other fixed price contracts
is based on milestones as defined in the contract and therefore the timing of revenue recognition is different from the timing of invoicing
to the customers. Therefore unbilled revenues for other fixed price contracts (contract asset) are classified as non-financial asset because
the right to consideration is dependent on completion of contractual milestones.
Invoicing in excess of earnings are classified as unearned
revenue.
Trade receivables and unbilled revenues are presented
net of impairment in the consolidated statement of balance sheet.
2.18 Unbilled Revenue
(In crore)
| Particulars |
As at |
| |
June 30, 2023 |
March 31, 2023 |
| Unbilled financial asset (1) |
9,027 |
9,502 |
| Unbilled non financial asset (2) |
6,980 |
7,236 |
| Total |
16,007 |
16,738 |
| (1) | | Right to consideration is unconditional and is due only after a passage of time. |
| (2) | | Right to consideration is dependent on completion of contractual milestones. |
2.19 Equity
Accounting policy
Ordinary Shares
Ordinary shares are classified as equity. Incremental
costs directly attributable to the issuance of new ordinary shares, share options and buyback are recognized as a deduction from equity,
net of any tax effects.
Treasury Shares
When any entity within the Group purchases the company's
ordinary shares, the consideration paid including any directly attributable incremental cost is presented as a deduction from total equity,
until they are cancelled, sold or reissued. When treasury shares are sold or reissued subsequently, the amount received is recognized
as an increase in equity, and the resulting surplus or deficit on the transaction is transferred to/ from Share premium.
Description of reserves
Retained earnings
Retained earnings represent the amount of accumulated
earnings of the Group.
Share premium
The amount received in excess of the par value of equity
shares has been classified as share premium. Additionally, share-based compensation recognized in net profit in the interim condensed
consolidated statement of comprehensive income is credited to share premium. Amounts have been utilized for bonus issue and share buyback
from share premium account.
Special Economic Zone Re-investment reserve
The Special Economic Zone Re-investment reserve has
been created out of the profit of the eligible SEZ unit in terms of the provisions of Sec 10AA (1)(ii) of Income Tax Act, 1961. The reserve
should be utilized by the Company for acquiring new plant and machinery for the purpose of its business in terms of the provisions of
the Sec 10AA (2) of the Income Tax Act, 1961.
Capital Redemption Reserve
In accordance with section 69 of the Indian Companies
Act, 2013, the Company creates capital redemption reserve equal to the nominal value of the shares bought back as an appropriation from
general reserve / retained earnings.
Other components of equity
Other components of equity include currency translation,
re-measurement of net defined benefit liability/asset, fair value changes of equity instruments fair valued through other comprehensive
income, changes on fair valuation of investments, net of taxes.
Cash flow hedge reserve
When a derivative is designated as a cash flow hedging
instrument, the effective portion of changes in the fair value of the derivative is recognized in other comprehensive income and accumulated
in the cash flow hedging reserve. The cumulative gain or loss previously recognized in the cash flow hedging reserve is transferred to
the net profit in the interim condensed consolidated Statement of Comprehensive Income upon the occurrence of the related forecasted transaction.
2.19.1 Dividend
The final dividend on shares is recorded as a liability
on the date of approval by the shareholders and interim dividends are recorded as a liability on the date of declaration by the Company's
Board of Directors. Income tax consequences of dividends on financial instruments classified as equity will be recognized according to
where the entity originally recognized those past transactions or events that generated distributable profits.
The Company declares and pays dividends in Indian rupees.
Companies are required to pay / distribute dividend after deducting applicable taxes. The remittance of dividends outside India is governed
by Indian law on foreign exchange and is also subject to withholding tax at applicable rates.
The amount of per share dividend recognized as distribution
to equity shareholders in accordance with Companies Act 2013 is as follows:
(In )
| Particulars |
Three months ended June 30, |
| |
2023 |
2022 |
| Final dividend for fiscal 2022 |
– |
16.00 |
| Final dividend for fiscal 2023 |
17.50 |
– |
The Board of Directors in their meeting held on April
13, 2023 recommended a final dividend of 17.50/- per equity share for the financial year ended March 31, 2023. The same was approved
by the shareholders at the Annual General Meeting (AGM) of the Company held on June 28, 2023 which will result in a net cash outflow of
7,242 crore, excluding dividend paid on treasury shares. Payment date for the dividend is July 3, 2023.
2.19.2 Capital allocation policy
Effective fiscal 2020, the company expects to return
approximately 85% of the free cash flow cumulatively over a 5-year period through a combination of semi-annual dividends and/or share
buyback and/or special dividends, subject to applicable laws and requisite approvals, if any. Free cash flow is defined as net cash provided
by operating activities less capital expenditure as per the consolidated statement of cash flows prepared under IFRS. Dividend and buyback
include applicable taxes.
The Company’s objective when managing capital
is to safeguard its ability to continue as a going concern and to maintain an optimal capital structure so as to maximize shareholder
value. In order to maintain or achieve an optimal capital structure, the Company may adjust the amount of dividend payment, return capital
to shareholders, issue new shares or buy back issued shares. As of June 30, 2023, the Company has only one class of equity shares and
has no debt. Consequent to the above capital structure there are no externally imposed capital requirements.
2.19.3 Share capital and share premium
The Company has only one class of shares referred to
as equity shares having a par value of 5/- each. 11,738,357 shares and 12,172,119 shares were held by controlled trust, as at June
30, 2023 and March 31, 2023, respectively.
2.20 Break-up of expenses and other income, net
a. Accounting policy
Gratuity and Pensions
The Group provides for gratuity, a defined benefit
retirement plan ('the Gratuity Plan') covering eligible employees majorly of Infosys and its Indian subsidiaries. The Gratuity Plan provides
a lump-sum payment to vested employees at retirement, death, incapacitation or termination of employment, of an amount based on the respective
employee's salary and the tenure of employment with the Group. The Company contributes Gratuity liabilities to the Infosys Limited Employees'
Gratuity Fund Trust (the Trust). In case of Infosys BPM and EdgeVerve, contributions are made to the Infosys BPM Employees' Gratuity Fund
Trust and EdgeVerve Systems Limited Employees' Gratuity Fund Trust, respectively. Trustees administer contributions made to the Trusts
and contributions are invested in a scheme with the Life Insurance Corporation of India as permitted by Indian law.
The Group operates defined benefit pension plan in
certain overseas jurisdictions, in accordance with the local laws. These plans are managed by third party fund managers. The plans provide
for periodic payouts after retirement and/or a lumpsum payment as set out in rules of each fund and includes death and disability benefits.
The defined benefit plans require contributions which are based on a percentage of salary that varies depending on the age of the respective
employees.
Liabilities with regard to these defined benefit plans
are determined by actuarial valuation, performed by an independent actuary, at each Balance Sheet date using the projected unit credit
method. These defined benefit plans expose the Group to actuarial risks, such as longevity risk, interest rate risk and market risk.
The Group recognizes the net obligation of a defined
benefit plan in its Balance Sheet as an asset or liability. Gains and losses through re-measurements of the net defined benefit liability
/ (asset) are recognized in other comprehensive income and are not reclassified to profit or loss in subsequent periods. The actual return
of the portfolio of plan assets, in excess of the yields computed by applying the discount rate used to measure the defined benefit obligation
is recognized in other comprehensive income. The effect of any plan amendments is recognized in net profit in the Consolidated Statement
of Comprehensive Income.
Provident fund
Eligible employees of Infosys receive benefits from
a provident fund, which is a defined benefit plan. Both the eligible employee and the Company make monthly contributions to the provident
fund plan equal to a specified percentage of the covered employee's salary. The Company contributes a portion to the Infosys Limited Employees'
Provident Fund Trust. The trust invests in specific designated instruments as permitted by Indian law. The remaining portion is contributed
to the government administered pension fund. The rate at which the annual interest is payable to the beneficiaries by the trust is being
administered by the Government of India. The Company has an obligation to make good the shortfall, if any, between the return from the
investments of the trust and the notified interest rate.
In respect of Indian subsidiaries, eligible employees
receive benefits from a provident fund, which is a defined contribution plan. Both the eligible employee and the respective companies
make monthly contributions to this provident fund plan equal to a specified percentage of the covered employee's salary. Amounts collected
under the provident fund plan are deposited in a government administered provident fund. The Companies have no further obligation to the
plan beyond its monthly contributions.
Superannuation
Certain employees of Infosys, Infosys BPM and EdgeVerve
are participants in a defined contribution plan. The Group has no further obligations to the plan beyond its monthly contributions which
are periodically contributed to a trust fund, the corpus of which is invested with the Life Insurance Corporation of India.
Compensated absences
The Group has a policy on compensated absences which
are both accumulating and non-accumulating in nature. The expected cost of accumulating compensated absences is determined by actuarial
valuation performed by an independent actuary at each Balance Sheet date using projected unit credit method on the additional amount expected
to be paid/availed as a result of the unused entitlement that has accumulated at the Balance Sheet date. Expense on non-accumulating compensated
absences is recognized in the period in which the absences occur.
The Code on Social Security, 2020 (‘Code’)
relating to employee benefits during employment and post-employment benefits received Presidential assent in September 2020. The Code
has been published in the Gazette of India. However, the date on which the entire Code will come into effect has not been notified. The
Company will assess the impact of the Code when it comes into effect in entirety and will record any related impact in the period the
Code becomes effective.
Other income, net
Accounting policy
Other income is comprised primarily of interest income,
dividend income, gain/loss on investment and exchange gain/loss on forward and options contracts and on translation of foreign currency
assets and liabilities. Interest income is recognized using the effective interest method. Dividend income is recognized when the right
to receive payment is established.
Foreign currency
Accounting policy
Functional currency
The functional currency of Infosys, Infosys BPM, EdgeVerve
and Skava and controlled trusts is the Indian rupee. The functional currencies for foreign subsidiaries are their respective local currencies.
These financial statements are presented in Indian rupees (rounded off to crore; one crore equals ten million).
Transactions and translations
Foreign-currency denominated monetary assets and liabilities
are translated into the relevant functional currency at exchange rates in effect at the Balance Sheet date. The gains or losses resulting
from such translations are recognized in the Interim Condensed Consolidated Statement of Comprehensive Income and reported within exchange
gains/ (losses) on translation of assets and liabilities, net, except when deferred in Other Comprehensive Income as qualifying cash flow
hedges. Non-monetary assets and non-monetary liabilities denominated in a foreign currency and measured at fair value are translated at
the exchange rate prevalent at the date when the fair value was determined. Non-monetary assets and non-monetary liabilities denominated
in a foreign currency and measured at historical cost are translated at the exchange rate prevalent at the date of transaction. The related
revenue and expense are recognized using the same exchange rate.
Transaction gains or losses realized upon settlement
of foreign currency transactions are included in determining net profit for the period in which the transaction is settled. Revenue, expense
and cash-flow items denominated in foreign currencies are translated into the relevant functional currencies using the exchange rate in
effect on the date of the transaction.
The translation of financial statements of the foreign
subsidiaries to the presentation currency is performed for assets and liabilities using the exchange rate in effect at the Balance Sheet
date and for revenue, expense and cash-flow items using the average exchange rate for the respective periods. The gains or losses resulting
from such translation are included in currency translation reserves under other components of equity. When a subsidiary is disposed off,
in full, the relevant amount is transferred to net profit in the statement of comprehensive income. However when a change in the parent's
ownership does not result in loss of control of a subsidiary, such changes are recorded through equity.
Other Comprehensive Income, net of taxes includes translation
differences on non-monetary financial assets measured at fair value at the reporting date, such as equities classified as financial instruments
and measured at fair value through other comprehensive income (FVOCI).
Goodwill and fair value adjustments arising on the
acquisition of a foreign entity are treated as assets and liabilities of the foreign entity and translated at the exchange rate in effect
at the Balance Sheet date.
Government grants
The Group recognizes government grants only when there
is reasonable assurance that the conditions attached to them will be complied with, and the grants will be received. Government grants
related to assets are treated as deferred income and are recognized in the net profit in the statement of comprehensive income on a systematic
and rational basis over the useful life of the asset. Government grants related to revenue are recognized on a systematic basis in the
statement of comprehensive income over the periods necessary to match them with the related costs which they are intended to compensate.
Operating Profits
Operating profit of the Group is computed considering
the revenues, net of cost of sales, selling and marketing expenses and administrative expenses.
b. The table below provides details of break-up
of expenses:
Cost of sales
(In crore)
| Particulars |
Three months ended June 30, |
| |
2023 |
2022 |
| Employee benefit costs |
18,736 |
16,621 |
| Depreciation and amortization |
1,173 |
950 |
| Travelling costs |
319 |
254 |
| Cost of technical sub-contractors |
3,123 |
3,909 |
| Cost of software packages for own use |
465 |
406 |
| Third party items bought for service delivery to clients |
2,231 |
1,976 |
| Short-term leases (Refer to note 2.9) |
10 |
7 |
| Consultancy and professional charges |
29 |
28 |
| Communication costs |
89 |
88 |
| Repairs and maintenance |
118 |
109 |
| Provision for post-sales client support |
50 |
12 |
| Others |
39 |
9 |
| Total |
26,382 |
24,369 |
Selling and marketing expenses
(In crore)
| Particulars |
Three months ended June 30, |
| |
2023 |
2022 |
| Employee benefit costs |
1,380 |
1,126 |
| Travelling costs |
88 |
76 |
| Branding and marketing |
263 |
222 |
| Short-term leases (Refer to note 2.9) |
1 |
1 |
| Communication costs |
3 |
3 |
| Consultancy and professional charges |
31 |
29 |
| Others |
17 |
36 |
| Total |
1,783 |
1,493 |
Administrative expenses
(In crore)
| Particulars |
Three months ended June 30, |
| |
2023 |
2022 |
| Employee benefit costs |
665 |
590 |
| Consultancy and professional charges |
286 |
399 |
| Repairs and maintenance |
250 |
217 |
| Power and fuel |
50 |
39 |
| Communication costs |
90 |
79 |
| Travelling costs |
55 |
46 |
| Impairment loss recognized/(reversed) under expected credit loss model |
91 |
44 |
| Rates and taxes |
94 |
74 |
| Insurance charges |
52 |
41 |
| Short-term leases (Refer to note 2.9) |
10 |
10 |
| Commission to non-whole time directors |
3 |
4 |
| Contribution towards Corporate Social Responsibility |
70 |
60 |
| Others |
161 |
91 |
| Total |
1,877 |
1,694 |
Other income consists of the following:
(In crore)
| Particulars |
Three months ended June 30, |
| |
2023 |
2022 |
| Interest income on financial assets carried at amortized cost |
274 |
239 |
| Interest income on financial assets carried at fair value through other comprehensive income |
243 |
240 |
| Gain/(loss) on investments carried at fair value through profit or loss |
52 |
8 |
| Gain/(loss) on investments carried at fair value through other comprehensive income |
– |
1 |
| Exchange gains / (losses) on forward and options contracts |
134 |
(290) |
| Exchange gains / (losses) on translation of other assets and liabilities |
(137) |
417 |
| Others |
(5) |
61 |
| Total |
561 |
676 |
for and on behalf of the Board of Directors of Infosys
Limited
|
Nandan M. Nilekani
Chairman |
Salil Parekh
Chief Executive Officer
and Managing Director |
Bobby Parikh
Director |
| |
|
|
|
Nilanjan Roy
Chief Financial Officer |
Jayesh Sanghrajka
Executive Vice President and
Deputy Chief Financial Officer |
A.G.S. Manikantha
Company Secretary |
| |
|
|
|
Bengaluru
July 20, 2023 |
|
|
Exhibit 99.9
Ind AS Standalone
INDEPENDENT AUDITOR’S REPORT
TO THE BOARD OF DIRECTORS OF
INFOSYS LIMITED
Report on the Audit of the Interim Condensed
Standalone Financial Statements
Opinion
We have audited the accompanying interim condensed
standalone financial statements of INFOSYS LIMITED (the “Company”), which comprise the Condensed Balance Sheet as at
June 30, 2023, the Condensed Statement of Profit and Loss (including Other Comprehensive Income), the Condensed Statement of Changes in
Equity and the Condensed Statement of Cash Flows for the three months ended on that date, and a summary of the significant accounting
policies and other explanatory information (hereinafter referred to as the “interim condensed standalone financial statements”).
In our opinion and to the best of our information
and according to the explanations given to us, the aforesaid interim condensed standalone financial statements give a true and fair view
in conformity with Indian Accounting Standard 34 “Interim Financial Reporting” (“Ind AS 34”) prescribed under
section 133 of the Companies Act, 2013 (the “Act”), read with relevant rules issued thereunder and other accounting principles
generally accepted in India, of the state of affairs of the Company as at June 30, 2023 and its profit, total comprehensive income, changes
in equity and its cash flows for the three months ended on that date.
Basis for Opinion
We conducted our audit of the interim condensed
standalone financial statements in accordance with the Standards on Auditing (“SA”s) specified under section 143 (10) of the
Act. Our responsibilities under those Standards are further described in the Auditor’s Responsibilities for the Audit of the Interim
Condensed Standalone Financial Statements section of our report. We are independent of the Company in accordance with the Code of Ethics
issued by the Institute of Chartered Accountants of India (“ICAI”) together with the ethical requirements that are relevant
to our audit of the interim condensed standalone financial statements under the provisions of the Act and the Rules made thereunder, and
we have fulfilled our other ethical responsibilities in accordance with these requirements and the ICAI’s Code of Ethics. We believe
that the audit evidence obtained by us is sufficient and appropriate to provide a basis for our audit opinion on the interim condensed
standalone financial statements.
Responsibilities of Management and Those
Charged with Governance for the Interim Condensed Standalone Financial Statements
The Company’s Board of Directors is responsible
for the preparation and presentation of these interim condensed standalone financial statements that give a true and fair view of the
financial position, financial performance, including total comprehensive income, changes in equity and cash flows of the Company in accordance
with Ind AS 34 and other accounting principles generally accepted in India. This responsibility also includes maintenance of adequate
accounting records in accordance with the provisions of the Act for safeguarding the assets of the Company and for preventing and detecting
frauds and other irregularities; selection and application of appropriate accounting policies; making judgments and estimates that are
reasonable and prudent; and design, implementation and maintenance of adequate internal financial controls, that were operating effectively
for ensuring the accuracy and completeness of the accounting records, relevant to the preparation and presentation of the interim condensed
standalone financial statements that give a true and fair view and are free from material misstatement, whether due to fraud or error.
In preparing the interim condensed standalone financial
statements, management is responsible for assessing the Company’s ability to continue as a going concern, disclosing, as applicable,
matters related to going concern and using the going concern basis of accounting unless Board of Directors either intends to liquidate
the Company or to cease operations, or has no realistic alternative but to do so.
The Board of Directors is responsible for overseeing
the Company’s financial reporting process.
Auditor’s Responsibilities for the
Audit of the Interim Condensed Standalone Financial Statements
Our objectives are to obtain reasonable assurance
about whether the interim condensed standalone financial statements as a whole are free from material misstatement, whether due to fraud
or error, and to issue an auditor’s report that includes our opinion. Reasonable assurance is a high level of assurance, but is
not a guarantee that an audit conducted in accordance with SAs will always detect a material misstatement when it exists. Misstatements
can arise from fraud or error and are considered material if, individually or in the aggregate, they could reasonably be expected to influence
the economic decisions of users taken on the basis of these interim condensed standalone financial statements.
As part of an audit in accordance with SAs, we
exercise professional judgment and maintain professional scepticism throughout the audit. We also:
| · | Identify and assess the risks
of material misstatement of the interim condensed standalone financial statements, whether due to fraud or error, design and perform audit
procedures responsive to those risks, and obtain audit evidence that is sufficient and appropriate to provide a basis for our opinion.
The risk of not detecting a material misstatement resulting from fraud is higher than for one resulting from error, as fraud may involve
collusion, forgery, intentional omissions, misrepresentations, or the override of internal control. |
| · | Obtain an understanding of internal
financial controls relevant to the audit in order to design audit procedures that are appropriate in the circumstances, but not for the
purpose of expressing an opinion on effectiveness of such controls. |
| · | Evaluate the appropriateness
of accounting policies used and the reasonableness of accounting estimates and related disclosures made by management. |
| · | Conclude on the appropriateness
of management’s use of the going concern basis of accounting and, based on the audit evidence obtained, whether a material uncertainty
exists related to events or conditions that may cast significant doubt on the Company’s ability to continue as a going concern.
If we conclude that a material uncertainty exists, we are required to draw attention in our auditor’s report to the related disclosures
in the interim condensed standalone financial statements or, if such disclosures are inadequate, to modify our opinion. Our conclusions
are based on the audit evidence obtained up to the date of our auditor’s report. However, future events or conditions may cause
the Company to cease to continue as a going concern. |
| · | Evaluate the overall presentation,
structure and content of the interim condensed standalone financial statements, including the disclosures, and whether the interim condensed
standalone financial statements represent the underlying transactions and events in a manner that achieves fair presentation. |
Materiality is the magnitude of misstatements
in the interim condensed standalone financial statements that, individually or in aggregate, makes it probable that the economic decisions
of a reasonably knowledgeable user of the interim condensed standalone financial statements may be influenced. We consider quantitative
materiality and qualitative factors in (i) planning the scope of our audit work and in evaluating the results of our work; and (ii) to
evaluate the effect of any identified misstatements in the interim condensed standalone financial statements.
We also communicate with those charged with governance
regarding, among other matters, the planned scope and timing of the audit and significant audit findings including any significant deficiencies
in internal control that we identify during our audit.
We also provide those charged with governance with
a statement that we have complied with relevant ethical requirements regarding independence, and to communicate with them all relationships
and other matters that may reasonably be thought to bear on our independence, and where applicable, related safeguards.
| |
For DELOITTE HASKINS & SELLS LLP |
| |
Chartered Accountants |
| |
(Firm’s Registration No. 117366W/W-100018) |
| |
|
| |
Sanjiv V. Pilgaonkar |
| |
Partner |
| Place: Bengaluru |
(Membership No.039826) |
| Date: July 20, 2023 |
UDIN:23039826BGXSAO3665 |
INFOSYS LIMITED
Condensed Standalone Financial Statements under Indian Accounting
Standards (Ind AS) for the three months June 30, 2023
| Index |
| Condensed Balance Sheet |
| Condensed Statement of Profit and Loss |
| Condensed Statement of Changes in Equity |
| Condensed Statement of Cash Flows |
| Overview and Notes to the Interim Condensed Standalone Financial Statements |
| 1. Overview |
| 1.1 Company overview |
| 1.2 Basis of preparation of financial statements |
| 1.3 Use of estimates and judgments |
| 1.4 Critical accounting estimates and judgements |
| 2. Notes to Interim Condensed Financial Statements |
| 2.1 Property, plant and equipment |
| 2.2 Goodwill and intangible assets |
| 2.3 Leases |
| 2.4 Investments |
| 2.5 Loans |
| 2.6 Other financial assets |
| 2.7 Trade Receivables |
| 2.8 Cash and cash equivalents |
| 2.9 Earmarked bank balance for dividend |
| 2.10 Other assets |
| 2.11 Financial instruments |
| 2.12 Equity |
| 2.13 Other financial liabilities |
| 2.14 Trade payables |
| 2.15 Other liabilities |
| 2.16 Provisions |
| 2.17 Income taxes |
| 2.18 Revenue from operations |
| 2.19 Other income, net |
| 2.20 Expenses |
| 2.21 Basic and diluted shares used in computing earnings per equity share |
| 2.22 Contingent liabilities and commitments |
| 2.23 Related party transactions |
| 2.24 Segment Reporting |
INFOSYS LIMITED
(In crore)
| Condensed Balance Sheet as at |
Note No. |
June 30, 2023 |
March 31, 2023 |
| ASSETS |
|
|
|
| Non-current assets |
|
|
|
| Property, plant and equipment |
2.1 |
11,340 |
11,656 |
| Right-of-use assets |
2.3 |
3,686 |
3,561 |
| Capital work-in-progress |
|
324 |
275 |
| Goodwill |
2.2 |
211 |
211 |
| Other intangible assets |
|
– |
3 |
| Financial assets |
|
|
|
| Investments |
2.4 |
23,211 |
23,686 |
| Loans |
2.5 |
34 |
39 |
| Other financial assets |
2.6 |
958 |
1,341 |
| Deferred tax assets (net) |
|
575 |
779 |
| Income tax assets (net) |
|
6,353 |
5,916 |
| Other non-current assets |
2.10 |
1,837 |
1,788 |
| Total non - current assets |
|
48,529 |
49,255 |
| Current assets |
|
|
|
| Financial assets |
|
|
|
| Investments |
2.4 |
3,447 |
4,476 |
| Trade receivables |
2.7 |
22,188 |
20,773 |
| Cash and cash equivalents |
2.8 |
6,267 |
6,534 |
| Earmarked bank balance for dividend |
2.9 |
7,262 |
– |
| Loans |
2.5 |
277 |
291 |
| Other financial assets |
2.6 |
8,786 |
9,088 |
| Other current assets |
2.10 |
10,812 |
10,920 |
| Total current assets |
|
59,039 |
52,082 |
| Total assets |
|
107,568 |
101,337 |
| EQUITY AND LIABILITIES |
|
|
|
| Equity |
|
|
|
| Equity share capital |
2.12 |
2,075 |
2,074 |
| Other equity |
|
64,671 |
65,671 |
| Total equity |
|
66,746 |
67,745 |
| LIABILITIES |
|
|
|
| Non-current liabilities |
|
|
|
| Financial liabilities |
|
|
|
| Lease liabilities |
2.3 |
3,496 |
3,553 |
| Other financial liabilities |
2.13 |
1,205 |
1,317 |
| Deferred tax liabilities (net) |
|
788 |
866 |
| Other non-current liabilities |
2.15 |
272 |
414 |
| Total non - current liabilities |
|
5,761 |
6,150 |
| Current liabilities |
|
|
|
| Financial liabilities |
|
|
|
| Lease liabilities |
2.3 |
720 |
713 |
| Trade payables |
2.14 |
|
|
| Total outstanding dues of micro enterprises and small enterprises |
|
95 |
97 |
| Total outstanding dues of creditors other than micro enterprises and small enterprises |
|
2,564 |
2,329 |
| Other financial liabilities |
2.13 |
17,640 |
12,697 |
| Other current liabilities |
2.15 |
8,596 |
7,609 |
| Provisions |
2.16 |
1,360 |
1,163 |
| Income tax liabilities (net) |
|
4,086 |
2,834 |
| Total current liabilities |
|
35,061 |
27,442 |
| Total equity and liabilities |
|
107,568 |
101,337 |
The accompanying notes form an integral part of the
interim condensed standalone financial statements.
As per our report of even date attached
| |
| for Deloitte Haskins & Sells LLP |
for and on behalf of the Board of Directors of Infosys Limited |
| Chartered Accountants |
|
| Firm's Registration No: |
|
117366W/W-100018
|
|
|
Sanjiv V. Pilgaonkar
Partner
Membership No. 039826 |
Nandan M. Nilekani
Chairman |
Salil Parekh
Chief Executive Officer and
Managing Director |
Bobby Parikh
Director |
| |
|
|
|
| |
Nilanjan Roy
Chief Financial Officer |
Jayesh Sanghrajka
Executive Vice President and
Deputy Chief Financial Officer |
A.G.S. Manikantha
Company Secretary |
Bengaluru
July 20, 2023
|
INFOSYS LIMITED
(In crore except equity share and per equity
share data)
| Condensed Statement of Profit and Loss for the |
Note No. |
Three months ended June 30, |
| |
|
2023 |
2022 |
| Revenue from operations |
2.18 |
31,811 |
29,527 |
| Other income, net |
2.19 |
1,001 |
648 |
| Total income |
|
32,812 |
30,175 |
| Expenses |
|
|
|
| Employee benefit expenses |
2.20 |
16,353 |
14,914 |
| Cost of technical sub-contractors |
|
4,676 |
5,011 |
| Travel expenses |
|
359 |
314 |
| Cost of software packages and others |
2.20 |
1,174 |
1,183 |
| Communication expenses |
|
129 |
119 |
| Consultancy and professional charges |
|
215 |
363 |
| Depreciation and amortization expenses |
|
746 |
643 |
| Finance cost |
|
43 |
34 |
| Other expenses |
2.20 |
971 |
692 |
| Total expenses |
|
24,666 |
23,273 |
| Profit before tax |
|
8,146 |
6,902 |
| Tax expense: |
|
|
|
| Current tax |
2.17 |
2,065 |
2,032 |
| Deferred tax |
2.17 |
125 |
(31) |
| Profit for the period |
|
5,956 |
4,901 |
| Other comprehensive income |
|
|
|
| Items that will not be reclassified subsequently to profit or loss |
|
|
|
| Remeasurement of the net defined benefit liability/asset, net |
|
87 |
(96) |
| Equity instruments through other comprehensive income, net |
|
1 |
3 |
| Items that will be reclassified subsequently to profit or loss |
|
|
|
| Fair value changes on derivatives designated as cash flow hedge, net |
|
6 |
26 |
| Fair value changes on investments, net |
|
68 |
(344) |
| |
|
|
|
| Total other comprehensive income/ (loss), net of tax |
|
162 |
(411) |
| Total comprehensive income for the period |
|
6,118 |
4,490 |
| Earnings per equity share |
|
|
|
| Equity shares of par value 5/- each |
|
|
|
| Basic () |
|
14.36 |
11.65 |
| Diluted () |
|
14.34 |
11.64 |
| Weighted average equity shares used in computing earnings per equity share |
|
|
|
| Basic (in shares) |
2.21 |
4,14,91,57,540 |
4,20,71,62,325 |
| Diluted (in shares) |
2.21 |
4,15,26,38,175 |
4,21,06,04,236 |
The accompanying notes form an integral part of the
interim condensed standalone financial statements.
As per our report of even date attached
| |
| for Deloitte Haskins & Sells LLP |
for and on behalf of the Board of Directors of Infosys Limited |
| Chartered Accountants |
|
| Firm's Registration No: |
|
117366W/W-100018
|
|
|
Sanjiv V. Pilgaonkar
Partner
Membership No. 039826 |
Nandan M. Nilekani
Chairman |
Salil Parekh
Chief Executive Officer and
Managing Director |
Bobby Parikh
Director |
| |
|
|
|
|
|
Nilanjan Roy
Chief Financial Officer |
Jayesh Sanghrajka
Executive Vice President and
Deputy Chief Financial Officer |
A.G.S. Manikantha
Company Secretary |
Bengaluru
July 20, 2023
|
INFOSYS LIMITED
Condensed Statement of Changes in Equity
(In crore)
| Particulars |
|
Other Equity |
|
| |
|
Reserves & Surplus |
Other comprehensive income |
| |
Equity Share Capital |
Capital reserve |
Capital redemption reserve |
Securities Premium |
Retained earnings |
General reserve |
Share Options Outstanding Account |
Special Economic Zone Re-investment reserve (1) |
Equity Instruments through other comprehensive income |
Effective portion of Cash flow hedges |
Other items of other comprehensive income / (loss) |
Total equity attributable to equity holders of the Company |
| |
|
Capital reserve |
Other reserves (2) |
|
|
|
|
|
|
|
|
|
|
| Balance as at April 1, 2022 |
2,103 |
54 |
2,844 |
139 |
172 |
55,449 |
9 |
606 |
7,926 |
266 |
2 |
(264) |
69,306 |
| Impact on adoption of amendment to Ind AS 37# |
– |
– |
– |
– |
– |
(9) |
– |
– |
– |
– |
– |
– |
(9) |
| |
2,103 |
54 |
2,844 |
139 |
172 |
55,440 |
9 |
606 |
7,926 |
266 |
2 |
(264) |
69,297 |
| Changes in equity for the three months ended June 30, 2022 |
|
|
|
|
|
|
|
|
|
|
|
|
|
| Profit for the period |
– |
– |
– |
– |
– |
4,901 |
– |
– |
– |
– |
– |
– |
4,901 |
| Remeasurement of the net defined benefit liability/asset, net* |
– |
– |
– |
– |
– |
– |
– |
– |
– |
– |
– |
(96) |
(96) |
| Equity instruments through other comprehensive income, net* |
– |
– |
– |
– |
– |
– |
– |
– |
– |
3 |
– |
– |
3 |
| Fair value changes on derivatives designated as cash flow hedge, net* |
– |
– |
– |
– |
– |
– |
– |
– |
– |
– |
26 |
– |
26 |
| Fair value changes on investments, net* |
– |
– |
– |
– |
– |
– |
– |
– |
– |
– |
– |
(344) |
(344) |
| Total comprehensive income for the period |
– |
– |
– |
– |
– |
4,901 |
– |
– |
– |
3 |
26 |
(440) |
4,490 |
| Transferred from Special Economic Zone Re-investment reserve on utilization |
– |
– |
– |
– |
– |
265 |
– |
– |
(265) |
– |
– |
– |
– |
| Transferred on account of exercise of stock options (Refer to note 2.12) |
– |
– |
– |
– |
135 |
– |
– |
(135) |
– |
– |
– |
– |
– |
| Transfer on account of options not exercised |
– |
– |
– |
– |
– |
– |
1 |
(1) |
– |
– |
– |
– |
– |
| Shares issued on exercise of employee stock options (Refer to note 2.12) |
1 |
– |
– |
– |
– |
– |
– |
– |
– |
– |
– |
– |
1 |
| Employee stock compensation expense (Refer to note 2.12) |
– |
– |
– |
– |
– |
– |
– |
134 |
– |
– |
– |
– |
134 |
| Income tax benefit arising on exercise of stock options |
– |
– |
– |
– |
– |
– |
– |
14 |
– |
– |
– |
– |
14 |
| Dividends |
– |
– |
– |
– |
– |
(6,732) |
– |
– |
– |
– |
– |
– |
(6,732) |
| Balance as at June 30, 2022 |
2,104 |
54 |
2,844 |
139 |
307 |
53,874 |
10 |
618 |
7,661 |
269 |
28 |
(704) |
67,204 |
INFOSYS LIMITED
Condensed Statement of Changes in Equity (contd.)
(In crore)
| Particulars |
|
Other Equity |
|
| |
|
Reserves & Surplus |
Other comprehensive income |
|
| |
Equity Share Capital |
Capital reserve |
Capital redemption reserve |
Securities Premium |
Retained earnings |
General reserve |
Share Options Outstanding Account |
Special Economic Zone Re-investment reserve (1) |
Equity Instruments through other comprehensive income |
Effective portion of Cash flow hedges |
Other items of other comprehensive income / (loss) |
Total equity attributable to equity holders of the Company |
| |
|
Capital reserve |
Other reserves (2) |
|
|
|
|
|
|
|
|
|
|
| Balance as at April 1, 2023 |
2,074 |
54 |
2,862 |
169 |
133 |
52,183 |
2 |
878 |
9,654 |
260 |
(5) |
(519) |
67,745 |
| Changes in equity for the three months ended June 30, 2023 |
|
|
|
|
|
|
|
|
|
|
|
|
|
| Profit for the period |
– |
– |
– |
– |
– |
5,956 |
– |
– |
– |
– |
– |
– |
5,956 |
| Remeasurement of the net defined benefit liability/asset, net* |
– |
– |
– |
– |
– |
– |
– |
– |
– |
– |
– |
87 |
87 |
| Equity instruments through other comprehensive income, net* |
– |
– |
– |
– |
– |
– |
– |
– |
– |
1 |
– |
– |
1 |
| Fair value changes on derivatives designated as cash flow hedge, net* |
– |
– |
– |
– |
– |
– |
– |
– |
– |
– |
6 |
– |
6 |
| Fair value changes on investments, net* |
– |
– |
– |
– |
– |
– |
– |
– |
– |
– |
– |
68 |
68 |
| Total comprehensive income for the period |
– |
– |
– |
– |
– |
5,956 |
– |
– |
– |
1 |
6 |
155 |
6,118 |
| Transferred to Special Economic Zone Re-investment reserve |
– |
– |
– |
– |
– |
(760) |
– |
– |
760 |
– |
– |
– |
– |
| Transferred from Special Economic Zone Re-investment reserve on utilization |
– |
– |
– |
– |
– |
194 |
– |
– |
(194) |
– |
– |
– |
– |
| Transferred on account of exercise of stock options (Refer to note 2.12) |
– |
– |
– |
– |
274 |
– |
– |
(274) |
– |
– |
– |
– |
– |
| Transferred on account of options not exercised |
– |
– |
– |
– |
– |
– |
6 |
(6) |
– |
– |
– |
– |
– |
| Shares issued on exercise of employee stock options (Refer to note 2.12) |
1 |
– |
– |
– |
– |
– |
– |
– |
– |
– |
– |
– |
1 |
| Employee stock compensation expense (Refer to note 2.12) |
– |
– |
– |
– |
– |
– |
– |
144 |
– |
– |
– |
– |
144 |
| Income tax benefit arising on exercise of stock options |
– |
– |
– |
– |
– |
– |
– |
– |
– |
– |
– |
– |
– |
| Reserves on common control transaction |
– |
– |
– |
– |
– |
– |
– |
– |
– |
– |
– |
– |
– |
| Dividends |
– |
– |
– |
– |
– |
(7,262) |
– |
– |
– |
– |
– |
– |
(7,262) |
| Balance as at June 30, 2023 |
2,075 |
54 |
2,862 |
169 |
407 |
50,311 |
8 |
742 |
10,220 |
261 |
1 |
(364) |
66,746 |
| # | | Impact on account of adoption of amendment to Ind AS 37 Provisions, Contingent Liabilities
and Contingents Assets |
| (1) | | The Special Economic Zone Re-investment Reserve has been created out of the profit of
eligible SEZ units in terms of the provisions of Sec 10AA(1)(ii) of Income Tax Act, 1961. The reserve should be utilized by the Company
for acquiring new plant and machinery for the purpose of its business in the terms of the Sec 10AA(2) of the Income Tax Act, 1961. |
| (2) | | Profit / loss on transfer of business between entities under common control taken to reserve. |
The accompanying notes form an integral part of the
interim condensed standalone financial statements.
As per our report of even date attached
| |
| for Deloitte Haskins & Sells LLP |
for and on behalf of the Board of Directors of Infosys Limited |
| Chartered Accountants |
|
| Firm's Registration No: |
|
117366W/W-100018
|
|
|
Sanjiv V. Pilgaonkar
Partner
Membership No. 039826 |
Nandan M. Nilekani
Chairman |
Salil Parekh
Chief Executive Officer and
Managing Director |
Bobby Parikh
Director |
| |
|
|
|
|
|
Nilanjan Roy
Chief Financial Officer |
Jayesh Sanghrajka
Executive Vice President and
Deputy Chief Financial Officer |
A.G.S. Manikantha
Company Secretary |
Bengaluru
July 20, 2023
|
INFOSYS LIMITED
Condensed Statement of Cash Flows
Accounting Policy
Cash flows are reported using the indirect method, whereby profit for the
period is adjusted for the effects of transactions of a non-cash nature, any deferrals or accruals of past or future operating cash receipts
or payments and item of income or expenses associated with investing or financing cash flows. The cash flows from operating, investing
and financing activities of the Company are segregated. The Company considers all highly liquid investments that are readily convertible
to known amounts of cash to be cash equivalents.
(In crore)
| Particulars |
Note No. |
Three months ended June 30, |
| |
|
2023 |
2022 |
| Cash flow from operating activities: |
|
|
|
| Profit for the year |
|
5,956 |
4,901 |
| Adjustments to reconcile net profit to net cash provided by operating activities: |
|
|
|
| Depreciation and Amortization |
|
746 |
643 |
| Income tax expense |
2.17 |
2,190 |
2,001 |
| Impairment loss recognized / (reversed) under expected credit loss model |
|
86 |
28 |
| Finance cost |
|
43 |
34 |
| Interest and dividend income |
|
(817) |
(426) |
| Stock compensation expense |
|
132 |
118 |
| Other adjustments |
|
213 |
(8) |
| Exchange differences on translation of assets and liabilities, net |
|
19 |
29 |
| Changes in assets and liabilities |
|
|
|
| Trade receivables and unbilled revenue |
|
(476) |
(2,100) |
| Loans, other financial assets and other assets |
|
(523) |
(569) |
| Trade payables |
|
233 |
(36) |
| Other financial liabilities, other liabilities and provisions |
|
(1,159) |
1,785 |
| Cash generated from operations |
|
6,643 |
6,400 |
| Income taxes paid |
|
(1,252) |
(1,100) |
| Net cash generated by operating activities |
|
5,391 |
5,300 |
| Cash flow from investing activities: |
|
|
|
| Expenditure on property, plant and equipment |
|
(736) |
(571) |
| Deposits placed with corporation |
|
(392) |
(152) |
| Redemption of deposits placed with corporation |
|
226 |
– |
| Interest and dividend received |
|
571 |
489 |
| Dividend received from subsidiary |
|
400 |
– |
| Loan given to subsidiaries |
|
– |
(427) |
| Investment in subsidiaries |
|
(9) |
(17) |
| Proceeds from liquidation of a subsidiary |
|
79 |
– |
| Other receipts |
|
123 |
18 |
| Payments to acquire investments |
|
|
|
| Liquid mutual fund units |
|
(15,756) |
(18,378) |
| Commercial papers |
|
(1,336) |
(259) |
| Certificates of deposits |
|
(817) |
(2,738) |
| Government Securities |
|
– |
(1,370) |
| Non-convertible debentures |
|
(104) |
– |
| Others |
|
– |
(3) |
| Proceeds on sale of investments |
|
|
|
| Liquid mutual fund units |
|
15,350 |
18,805 |
| Non-convertible debentures |
|
275 |
220 |
| Certificates of deposit |
|
3,350 |
2,188 |
| Commercial papers |
|
600 |
– |
| Government Securities |
|
– |
636 |
| Net cash (used in) / generated from investing activities |
|
1,824 |
(1,559) |
| Cash flow from financing activities: |
|
|
|
| Payment of lease liabilities |
|
(191) |
(156) |
| Shares issued on exercise of employee stock options |
|
1 |
1 |
| Other receipts |
|
– |
43 |
| Other payments |
|
(21) |
(5) |
| Payment of dividends |
|
(1) |
(6,733) |
| Net cash used in financing activities |
|
(212) |
(6,850) |
| Net increase / (decrease) in cash and cash equivalents |
|
7,003 |
(3,109) |
| Effect of exchange differences on translation of foreign currency cash and cash equivalents |
|
(8) |
(10) |
| Cash and cash equivalents at the beginning of the period |
2.8 |
6,534 |
12,270 |
| Cash and cash equivalents at the end of the period |
2.8 |
13,529 |
9,151 |
| Supplementary information: |
|
|
|
| Restricted cash balance |
2.8 |
77 |
87 |
| Closing cash and cash equivalents as per Standalone Statement of Cash flow |
|
13,529 |
9,151 |
| Less: Earmarked bank balance for dividend |
|
7,262 |
– |
| Closing cash and cash equivalents as per Standalone Balance Sheet |
2.8 |
6,267 |
9,151 |
The accompanying notes form an integral part of the
interim condensed standalone financial statements.
As per our report of even date attached
| |
| for Deloitte Haskins & Sells LLP |
for and on behalf of the Board of Directors of Infosys Limited |
| Chartered Accountants |
|
| Firm's Registration No: |
|
117366W/W-100018
|
|
|
Sanjiv V. Pilgaonkar
Partner
Membership No. 039826 |
Nandan M. Nilekani
Chairman |
Salil Parekh
Chief Executive Officer
and Managing Director |
Bobby Parikh
Director |
| |
|
|
|
|
|
Nilanjan Roy
Chief Financial Officer |
Jayesh Sanghrajka
Executive Vice President and
Deputy Chief Financial Officer |
A.G.S. Manikantha
Company Secretary |
Bengaluru
July 20, 2023
|
INFOSYS LIMITED
Overview and Notes to the Interim Condensed Standalone
Financial Statements
1. Overview
1.1 Company overview
Infosys Limited ('the Company' or Infosys) provides
consulting, technology, outsourcing and next-generation digital services, to enable clients to execute strategies for their digital transformation.
Infosys strategic objective is to build a sustainable organization that remains relevant to the agenda of clients, while creating growth
opportunities for employees and generating profitable returns for investors. Infosys strategy is to be a navigator for our clients as
they ideate, plan and execute on their journey to a digital future.
The Company is a public limited company incorporated
and domiciled in India and has its registered office at Electronics City, Hosur Road, Bengaluru 560100, Karnataka, India. The company
has its primary listings on the BSE Ltd. and National Stock Exchange of India Limited. The Company’s American Depositary Shares
(ADS) representing equity shares are listed on the New York Stock Exchange (NYSE).
The interim condensed standalone financial statements
are approved for issue by the Company's Board of Directors on July 20, 2023.
1.2 Basis of preparation of financial statements
These interim condensed standalone financial statements
are prepared in compliance with Indian Accounting Standard (Ind AS) 34 Interim Financial Reporting, under the historical cost convention
on accrual basis except for certain financial instruments which are measured at fair values, the provisions of the Companies Act, 2013
(''the Act'') and guidelines issued by the Securities and Exchange Board of India (SEBI). Accordingly, these interim condensed standalone
financial statements do not include all the information required for a complete set of financial statements. These interim condensed standalone
financial statements should be read in conjunction with the standalone financial statements and related notes included in the Company’s
Annual Report for the year ended March 31, 2023. The Ind AS are prescribed under Section 133 of the Act read with Rule 3 of the Companies
(Indian Accounting Standards) Rules, 2015 and relevant amendment rules issued thereafter.
Accounting policies have been consistently applied
except where a newly issued accounting standard is initially adopted or a revision to an existing accounting standard requires a change
in the accounting policy hitherto in use.
The material accounting policy information used in preparation of the audited condensed standalone
interim financial statements have been discussed in the respective notes.
1.3 Use of estimates and judgments
The preparation of the interim condensed standalone
financial statements in conformity with Ind AS requires the management to make estimates, judgments and assumptions. These estimates,
judgments and assumptions affect the application of accounting policies and the reported amounts of assets and liabilities, the disclosures
of contingent assets and liabilities at the date of the interim condensed standalone financial statements and reported amounts of revenues
and expenses during the period. The application of accounting policies that require critical accounting estimates involving complex and
subjective judgments and the use of assumptions in these financial statements have been disclosed in Note no. 1.4. Accounting estimates
could change from period to period. Actual results could differ from those estimates. Appropriate changes in estimates are made as management
becomes aware of changes in circumstances surrounding the estimates. Changes in estimates and judgements are reflected in the interim
condensed standalone financial statements in the period in which changes are made and, if material, their effects are disclosed in the
notes to the interim condensed standalone financial statements.
1.4 Critical accounting estimates and judgments
a. Revenue recognition
The Company’s contracts with customers include
promises to transfer multiple products and services to a customer. Revenues from customer contracts are considered for recognition and
measurement when the contract has been approved, in writing, by the parties to the contract, the parties to contract are committed to
perform their respective obligations under the contract, and the contract is legally enforceable. The Company assesses the services promised
in a contract and identifies distinct performance obligations in the contract. Identification of distinct performance obligations to determine
the deliverables and the ability of the customer to benefit independently from such deliverables, and allocation of transaction price
to these distinct performance obligations involves significant judgement.
Fixed price maintenance revenue is recognized ratably
on a straight-line basis when services are performed through an indefinite number of repetitive acts over a specified period. Revenue
from fixed price maintenance contract is recognized ratably using a percentage of completion method when the pattern of benefits from
the services rendered to the customer and Company’s costs to fulfil the contract is not even through the period of the contract
because the services are generally discrete in nature and not repetitive. The use of method to recognize the maintenance revenues requires
judgment and is based on the promises in the contract and nature of the deliverables.
The Company uses the percentage-of-completion method
in accounting for other fixed-price contracts. Use of the percentage-of-completion method requires the Company to determine the actual
efforts or costs expended to date as a proportion of the estimated total efforts or costs to be incurred. Efforts or costs expended have
been used to measure progress towards completion as there is a direct relationship between input and productivity. The estimation of total
efforts or costs involves significant judgement and is assessed throughout the period of the contract to reflect any changes based on
the latest available information.
Contracts with customers includes subcontractor services
or third-party vendor equipment or software in certain integrated services arrangements. In these types of arrangements, revenue from
sales of third-party vendor products or services is recorded net of costs when the Company is acting as an agent between the customer
and the vendor, and gross when the Company is the principal for the transaction. In doing so, the Company first evaluates whether it controls
the good or service before it is transferred to the customer. The Company considers whether it has the primary obligation to fulfil the
contract, inventory risk, pricing discretion and other factors to determine whether it controls the goods or service and therefore, is
acting as a principal or an agent.
Provisions for estimated losses, if any, on incomplete
contracts are recorded in the period in which such losses become probable based on the estimated efforts or costs to complete the contract.
b. Income taxes
The Company's two major tax jurisdictions are India
and the United States, though the Company also files tax returns in other overseas jurisdictions.Significant judgments are involved in
determining the provision for income taxes, including amount expected to be paid/recovered for uncertain tax positions.
In assessing the realizability of deferred income tax
assets, Management considers whether some portion or all of the deferred income tax assets will not be realized. The ultimate realization
of deferred income tax assets is dependent upon the generation of future taxable income during the periods in which the temporary differences
become deductible. Management considers the scheduled reversals of deferred income tax liabilities, projected future taxable income and
tax planning strategies in making this assessment. Based on the level of historical taxable income and projections for future taxable
income over the periods in which the deferred income tax assets are deductible, management believes that the company will realize the
benefits of those deductible differences. The amount of the deferred income tax assets considered realizable, however, could be reduced
in the near term if estimates of future taxable income during the carry forward period are reduced. (Refer to note 2.17)
c. Property, plant and equipment
Property, plant and equipment represent a significant
proportion of the asset base of the Company. The charge in respect of periodic depreciation is derived after determining an estimate of
an asset’s expected useful life and the expected residual value at the end of its life. The useful lives and residual values of
Company's assets are determined by the management at the time the asset is acquired and reviewed periodically, including at each financial
year end. The lives are based on historical experience with similar assets as well as anticipation of future events, which may impact
their life, such as changes in technology. (Refer to note 2.1)
2. Notes to the Interim Condensed Standalone Financial
Statements
2.1 PROPERTY, PLANT AND EQUIPMENT
Accounting Policy
Property, plant and equipment are stated at cost, less
accumulated depreciation and impairment, if any. Costs directly attributable to acquisition are capitalized until the property, plant
and equipment are ready for use, as intended by the Management. The charge in respect of periodic depreciation is derived at after determining
an estimate of an asset’s expected useful life and the expected residual value at the end of its life. The Company depreciates property,
plant and equipment over their estimated useful lives using the straight-line method.
The estimated useful lives of assets are as follows:
| Building(1) |
22-25 years |
| Plant and machinery(1) |
5 years |
| Office equipment |
5 years |
| Computer equipment(1) |
3-5 years |
| Furniture and fixtures(1) |
5 years |
| Vehicles(1) |
5 years |
| Leasehold improvements |
Lower of useful life of the asset or lease term |
(1) Based on technical evaluation, the
Management believes that the useful lives as given above best represent the period over which Management expects to use these assets.
Hence, the useful lives for these assets is different from the useful lives as prescribed under Part C of Schedule II of the Companies
Act 2013.
Depreciation methods, useful lives and residual values
are reviewed periodically, including at each financial year end. The useful lives are based on historical experience with similar assets
as well as anticipation of future events, which may impact their life, such as changes in technology.
Advances paid towards the acquisition of property,
plant and equipment outstanding at each Balance Sheet date is classified as capital advances under other non-current assets and the cost
of assets not ready to use before such date are disclosed under ‘Capital work-in-progress’. Subsequent expenditures relating
to property, plant and equipment is capitalized only when it is probable that future economic benefits associated with these will flow
to the Company and the cost of the item can be measured reliably. The cost and related accumulated depreciation are eliminated from the
financial statements upon sale or retirement of the asset.
Impairment
Property, plant and equipment are evaluated for recoverability
whenever events or changes in circumstances indicate that their carrying amounts may not be recoverable. For the purpose of impairment
testing, the recoverable amount (i.e. the higher of the fair value less cost to sell and the value-in-use) is determined on an individual
asset basis unless the asset does not generate cash flows that are largely independent of those from other assets. In such cases, the
recoverable amount is determined for the Cash Generating Unit (CGU) to which the asset belongs.
If such assets are considered to be impaired, the impairment
to be recognized in the condensed Statement of Profit and Loss is measured by the amount by which the carrying value of the assets exceeds
the estimated recoverable amount of the asset. An impairment loss is reversed in the condensed Statement of Profit and Loss if there has
been a change in the estimates used to determine the recoverable amount. The carrying amount of the asset is increased to its revised
recoverable amount, provided that this amount does not exceed the carrying amount that would have been determined (net of any accumulated
depreciation) had no impairment loss been recognized for the asset in prior years.
The changes in the carrying value of property, plant
and equipment for the three months ended June 30, 2023 are as follows:
(In crore)
| Particulars |
Land- Freehold |
Buildings(1)(2) |
Plant and machinery(2) |
Office Equipment(2) |
Computer equipment(2) |
Furniture and fixtures(2) |
Leasehold Improvements |
Vehicles |
Total |
| Gross carrying value as at April 1, 2023 |
1,429 |
10,445 |
3,144 |
1,314 |
7,235 |
2,129 |
968 |
45 |
26,709 |
| Additions |
– |
5 |
16 |
21 |
187 |
24 |
22 |
– |
275 |
| Deletions* |
– |
– |
(13) |
(10) |
(224) |
(18) |
(7) |
– |
(272) |
| Gross carrying value as at June 30, 2023 |
1,429 |
10,450 |
3,147 |
1,325 |
7,198 |
2,135 |
983 |
45 |
26,712 |
| Accumulated depreciation as at April 1, 2023 |
– |
(4,223) |
(2,558) |
(1,060) |
(4,977) |
(1,549) |
(646) |
(40) |
(15,053) |
| Depreciation |
– |
(98) |
(57) |
(29) |
(301) |
(60) |
(44) |
(1) |
(590) |
| Accumulated depreciation on deletions* |
– |
– |
13 |
10 |
224 |
18 |
6 |
– |
271 |
| Accumulated depreciation as at June 30, 2023 |
– |
(4,321) |
(2,602) |
(1,079) |
(5,054) |
(1,591) |
(684) |
(41) |
(15,372) |
| Carrying value as at April 1, 2023 |
1,429 |
6,222 |
586 |
254 |
2,258 |
580 |
322 |
5 |
11,656 |
| Carrying value as at June 30, 2023 |
1,429 |
6,129 |
545 |
246 |
2,144 |
544 |
299 |
4 |
11,340 |
| * | | During the three months ended June 30, 2023, certain assets which were not in use having gross
book value of 250 crore (net book value: nil) were retired. |
The changes in the carrying value of property, plant
and equipment for the three months ended June 30, 2022 were as follows:
(In crore)
| Particulars |
Land- Freehold |
Buildings(1)(2) |
Plant and machinery(2) |
Office Equipment(2) |
Computer equipment(2) |
Furniture and fixtures(2) |
Leasehold Improvements |
Vehicles |
Total |
| Gross carrying value as at April 1, 2022 |
1,429 |
10,115 |
3,054 |
1,250 |
7,239 |
2,070 |
817 |
44 |
26,018 |
| Additions |
– |
131 |
47 |
21 |
249 |
44 |
58 |
– |
550 |
| Deletions |
– |
– |
(3) |
(2) |
(38) |
(1) |
– |
– |
(44) |
| Gross carrying value as at June 30, 2022 |
1,429 |
10,246 |
3,098 |
1,269 |
7,450 |
2,113 |
875 |
44 |
26,524 |
| Accumulated depreciation as at April 1, 2022 |
– |
(3,834) |
(2,494) |
(993) |
(5,163) |
(1,614) |
(499) |
(37) |
(14,634) |
| Depreciation |
– |
(95) |
(59) |
(26) |
(247) |
(51) |
(35) |
(1) |
(514) |
| Accumulated depreciation on deletions |
– |
– |
3 |
2 |
38 |
1 |
– |
– |
44 |
| Accumulated depreciation as at June 30, 2022 |
– |
(3,929) |
(2,550) |
(1,017) |
(5,372) |
(1,664) |
(534) |
(38) |
(15,104) |
| Carrying value as at April 1, 2022 |
1,429 |
6,281 |
560 |
257 |
2,076 |
456 |
318 |
7 |
11,384 |
| Carrying value as at June 30, 2022 |
1,429 |
6,317 |
548 |
252 |
2,078 |
449 |
341 |
6 |
11,420 |
| (1) | | Buildings include 250/- being the value of five shares
of 50/- each in Mittal Towers Premises Co-operative Society Limited. |
| (2) | | Includes certain assets provided on cancellable operating lease to subsidiaries. |
The aggregate depreciation has been included under
depreciation and amortization expense in the statement of Profit and Loss.
Repairs and maintenance costs are recognized in the
statement of Profit and Loss when incurred.
2.2 GOODWILL AND INTANGIBLE ASSETS
2.2.1 Goodwill
Following is a summary of changes in the carrying amount of goodwill:
(In crore)
| Particulars |
As at |
| |
June 30, 2023 |
March 31, 2023 |
| Carrying value at the beginning |
211 |
211 |
| Carrying value at the end |
211 |
211 |
2.2.2 Intangible Assets:
Accounting Policy
Intangible assets are stated at cost less accumulated
amortization and impairment. Intangible assets are amortized over their respective individual estimated useful lives on a straight-line
basis, from the date that they are available for use. The estimated useful life of an identifiable intangible asset is based on a number
of factors including the effects of obsolescence, demand, competition, and other economic factors (such as the stability of the industry,
and known technological advances), and the level of maintenance expenditures required to obtain the expected future cash flows from the
asset. Amortization methods and useful lives are reviewed periodically including at each financial year end.
Research costs are expensed as incurred. Software product
development costs are expensed as incurred unless technical and commercial feasibility of the project is demonstrated, future economic
benefits are probable, the Company has an intention and ability to complete and use or sell the software and the costs can be measured
reliably. The costs which can be capitalized include the cost of material, direct labor, overhead costs that are directly attributable
to prepare the asset for its intended use.
2.3 LEASES
Accounting Policy
The Company as a lessee
The Company’s lease asset classes primarily consist
of leases for land, buildings and computers. The Company assesses whether a contract contains a lease, at inception of a contract. A contract
is, or contains, a lease if the contract conveys the right to control the use of an identified asset for a period of time in exchange
for consideration. To assess whether a contract conveys the right to control the use of an identified asset, the Company assesses whether:
(i) the contract involves the use of an identified asset (ii) the Company has substantially all of the economic benefits from use of the
asset through the period of the lease and (iii) the Company has the right to direct the use of the asset.
At the date of commencement of the lease, the Company
recognizes a right-of-use asset (“ROU”) and a corresponding lease liability for all lease arrangements in which it is a lessee,
except for leases with a term of twelve months or less (short-term leases) and low value leases. For these short-term and low value leases,
the Company recognizes the lease payments as an operating expense on a straight-line basis over the term of the lease.
As a lessee, the Company determines the lease term
as the non-cancellable period of a lease adjusted with any option to extend or terminate the lease, if the use of such option is reasonably
certain. The Company makes an assessment on the expected lease term on a lease-by-lease basis and thereby assesses whether it is reasonably
certain that any options to extend or terminate the contract will be exercised. In evaluating the lease term, the Company considers factors
such as any significant leasehold improvements undertaken over the lease term, costs relating to the termination of the lease and the
importance of the underlying asset to Infosys’s operations taking into account the location of the underlying asset and the availability
of suitable alternatives. The lease term in future periods is reassessed to ensure that the lease term reflects the current economic circumstances.
Certain lease arrangements include the options to extend
or terminate the lease before the end of the lease term. ROU assets and lease liabilities includes these options when it is reasonably
certain that they will be exercised.
The right-of-use assets are initially recognized at
cost, which comprises the initial amount of the lease liability adjusted for any lease payments made at or prior to the commencement date
of the lease plus any initial direct costs less any lease incentives. They are subsequently measured at cost less accumulated depreciation
and impairment losses.
Right-of-use assets are depreciated from the commencement
date on a straight-line basis over the shorter of the lease term and useful life of the underlying asset. Right-of-use assets are evaluated
for recoverability whenever events or changes in circumstances indicate that their carrying amounts may not be recoverable. For the purpose
of impairment testing, the recoverable amount (i.e. the higher of the fair value less cost to sell and the value-in-use) is determined
on an individual asset basis unless the asset does not generate cash flows that are largely independent of those from other assets. In
such cases, the recoverable amount is determined for the Cash Generating Unit (CGU) to which the asset belongs.
The lease liability is initially measured at amortized
cost at the present value of the future lease payments. The lease payments are discounted using the interest rate implicit in the lease
or, if not readily determinable, using the incremental borrowing rates in the country of domicile of these leases. Lease liabilities are
remeasured with a corresponding adjustment to the related right of use asset if the Company changes its assessment if whether it will
exercise an extension or a termination option. Lease liability and ROU asset have been separately presented in the Balance Sheet and lease
payments have been classified as financing cash flows.
The Company as a lessor
Leases for which the Company is a lessor is classified
as a finance or operating lease. Whenever the terms of the lease transfer substantially all the risks and rewards of ownership to the
lessee, the contract is classified as a finance lease. All other leases are classified as operating leases.
When the Company is an intermediate lessor, it accounts
for its interests in the head lease and the sublease separately. The sublease is classified as a finance or operating lease by reference
to the right-of-use asset arising from the head lease.
For operating leases, rental income is recognized on
a straight line basis over the term of the relevant lease.
Following are the changes in the carrying value of
right-of-use assets for the three months ended June 30, 2023:
(In crore)
| Particulars |
Category of ROU asset |
Total |
| |
Land |
Buildings |
Computers |
|
| Balance as at April 1, 2023 |
548 |
2,669 |
344 |
3,561 |
| Additions* |
– |
256 |
72 |
328 |
| Deletion |
– |
(2) |
(46) |
(48) |
| Depreciation |
(1) |
(122) |
(32) |
(155) |
| Balance as at June 30, 2023 |
547 |
2,801 |
338 |
3,686 |
| * | | Net of adjustments on account of modifications and lease incentives |
Following are the changes in the carrying value of
right-of-use assets for the three months ended June 30, 2022:
(In crore)
| Particulars |
Category of ROU asset |
Total |
| |
Land |
Buildings |
Computers |
|
| Balance as at April 1, 2022 |
552 |
2,621 |
138 |
3,311 |
| Additions* |
– |
348 |
20 |
368 |
| Deletion |
– |
(1) |
(17) |
(18) |
| Depreciation |
(1) |
(107) |
(12) |
(120) |
| Balance as at June 30, 2022 |
551 |
2,861 |
129 |
3,541 |
| * | | Net of adjustments on account of modifications and lease incentives |
The aggregate depreciation expense on ROU assets is
included under depreciation and amortization expense in the interim condensed statement of Profit and Loss.
The following is the break-up of current and non-current
lease liabilities as at June 30, 2023 and March 31, 2023:
(In crore)
| Particulars |
As at |
| |
June 30, 2023 |
March 31, 2023 |
| Current lease liabilities |
720 |
713 |
| Non-current lease liabilities |
3,496 |
3,553 |
| Total |
4,216 |
4,266 |
2.4 INVESTMENTS
(In crore)
| Particulars |
As at |
| |
June 30, 2023 |
March 31, 2023 |
| Non-current investments |
|
|
| Equity instruments of subsidiaries |
9,028 |
9,078 |
| Redeemable Preference shares of subsidiary |
2,831 |
2,831 |
| Preference securities and equity instruments |
196 |
196 |
| Compulsorily convertible debentures |
– |
– |
| Target maturity fund units |
409 |
402 |
| Others |
82 |
82 |
| Tax free bonds |
1,739 |
1,742 |
| Government bonds |
14 |
14 |
| Non-convertible debentures |
2,262 |
2,490 |
| Government Securities |
6,650 |
6,851 |
| Total non-current investments |
23,211 |
23,686 |
| Current investments |
|
|
| Liquid mutual fund units |
700 |
260 |
| Commercial Papers |
1,169 |
420 |
| Certificates of deposit |
271 |
2,765 |
| Tax free bonds |
150 |
150 |
| Government bonds |
– |
– |
| Government Securities |
206 |
5 |
| Non-convertible debentures |
951 |
876 |
| Total current investments |
3,447 |
4,476 |
| Total carrying value |
26,658 |
28,162 |
(In crore, except as otherwise stated)
| Particulars |
As at |
| |
June 30, 2023 |
March 31, 2023 |
| Non-current investments |
|
|
| Unquoted |
|
|
| Investment carried at cost |
|
|
| Investments in equity instruments of subsidiaries |
|
|
| Infosys BPM Limited |
662 |
662 |
| 33,828 (33,828) equity shares of 10,000/- each, fully paid up |
|
|
| Infosys Technologies (China) Co. Limited |
369 |
369 |
| Infosys Technologies, S. de R.L. de C.V., Mexico |
65 |
65 |
| 17,49,99,990 (17,49,99,990) equity shares of MXN 1 par value, fully paid up |
|
|
| Infosys Technologies (Sweden) AB |
76 |
76 |
| 1,000 (1,000) equity shares of SEK 100 par value, fully paid |
|
|
| Infosys Technologies (Shanghai) Company Limited |
1,010 |
1,010 |
| Infosys Public Services, Inc. |
99 |
99 |
| 3,50,00,000 (3,50,00,000) shares of USD 0.50 par value, fully paid |
|
|
| Infosys Consulting Holding AG |
1,323 |
1,323 |
| 23,350 (23,350) - Class A shares of CHF 1,000 each and |
|
|
| 26,460 (26,460) - Class B Shares of CHF 100 each, fully paid up |
|
|
| Infosys Americas Inc. |
1 |
1 |
| 10,000 (10,000) shares of USD 10 per share, fully paid up |
|
|
| EdgeVerve Systems Limited |
1,312 |
1,312 |
| 1,31,18,40,000 (1,31,18,40,000) equity shares of 10/- each, fully paid up |
|
|
| Infosys Nova Holdings LLC# |
2,637 |
2,637 |
| Infosys Singapore Pte Ltd |
10 |
10 |
| 1,09,90,000 (1,09,90,000) shares of SGD 1.00 par value, fully paid |
|
|
| Brilliant Basics Holding Limited |
59 |
59 |
| 1,346 (1,346) shares of GBP 0.005 each, fully paid up |
|
|
| Infosys Arabia Limited |
2 |
2 |
| 70 (70) shares |
|
|
| Skava Systems Private Limited |
– |
59 |
| 25,000 (25,000) shares of 10/- each, fully paid up |
|
|
| Panaya Inc. |
582 |
582 |
| 2 (2) shares of USD 0.01 per share, fully paid up |
|
|
| Infosys Chile SpA |
7 |
7 |
| 100 (100) shares |
|
|
| WongDoody, Inc. |
380 |
380 |
| 100 (100) shares |
|
|
| Infosys Luxembourg S.a r.l. |
26 |
17 |
| 20,000 (20,000) shares |
|
|
| Infosys Austria GmbH |
– |
– |
| 80,000 (80,000) shares of EUR 1 par value, fully paid up |
|
|
| Infosys Consulting Brazil |
337 |
337 |
| 27,50,71,070 (27,50,71,070) shares of BRL 1 per share, fully paid up |
|
|
| Infosys Consulting S.R.L. (Romania) |
34 |
34 |
| 99,183 (99,183) shares of RON 100 per share, fully paid up |
|
|
| Infosys Limited Bulgaria EOOD |
2 |
2 |
| 4,58,000 (4,58,000) shares of BGN 1 per share, fully paid up |
|
|
| Infosys Germany Holdings GmbH |
2 |
2 |
| 25,000 (25,000) shares EUR 1 per share, fully paid up |
|
|
| Infosys Green Forum |
1 |
1 |
| 10,00,000 (10,00,000) shares 10 per share, fully paid up |
|
|
| Infosys Automotive and Mobility GmbH |
15 |
15 |
| Infosys Germany GmbH |
– |
– |
| 25,000 (25,000) shares EUR 1 per share, fully paid up |
|
|
| Infosys Turkey Bilgi Teknolojileri Limited Sirketi |
7 |
7 |
| 1,30,842 (1) share Turkish Liras 100 (10,000) per share, fully paid up |
|
|
| Infosys Consulting S.R.L. (Argentina) |
2 |
2 |
| 2,94,500 (Nil) shares AR$ 100 per share, fully paid up |
|
|
| Infosys Business Solutions LLC |
8 |
8 |
| 10,000 (Nil) shares USD 100 per share, fully paid up |
|
|
| Investments in Redeemable Preference shares of subsidiary |
|
|
| Infosys Singapore Pte Ltd |
2,831 |
2,831 |
| 45,62,00,000 (24,92,00,000) shares of SGD 1 per share, fully paid up |
|
|
| 40,000,000 (Nil) shares of USD 1 per share, fully paid up |
|
|
| |
11,859 |
11,909 |
| Investments carried at fair value through profit or loss |
|
|
| Target maturity fund units |
409 |
402 |
| Others (1) |
82 |
82 |
| |
491 |
484 |
| Investments carried at fair value through other comprehensive income |
|
|
| Preference securities |
193 |
193 |
| Equity instruments |
3 |
3 |
| |
196 |
196 |
| Quoted |
|
|
| Investments carried at amortized cost |
|
|
| Tax free bonds |
1,739 |
1,742 |
| Government bonds |
14 |
14 |
| |
1,753 |
1,756 |
| Investments carried at fair value through other comprehensive income |
|
|
| Non-convertible debentures |
2,262 |
2,490 |
| Government Securities |
6,650 |
6,851 |
| |
8,912 |
9,341 |
| Total non-current investments |
23,211 |
23,686 |
| |
| Current investments |
|
|
| Unquoted |
|
|
| Investments carried at fair value through profit or loss |
|
|
| Liquid mutual fund units |
700 |
260 |
| |
700 |
260 |
| Investments carried at fair value through other comprehensive income |
|
|
| Commercial Papers |
1,169 |
420 |
| Certificates of deposit |
271 |
2,765 |
| |
1,440 |
3,185 |
| Quoted |
|
|
| Investments carried at amortized cost |
|
|
| Tax free bonds |
150 |
150 |
| |
150 |
150 |
| Investments carried at fair value through other comprehensive income |
|
|
| Government Securities |
206 |
5 |
| Non-convertible debentures |
951 |
876 |
| |
1,157 |
881 |
| Total current investments |
3,447 |
4,476 |
| Total investments |
26,658 |
28,162 |
| Aggregate amount of quoted investments |
11,972 |
12,128 |
| Market value of quoted investments (including interest accrued), current |
1,326 |
1,050 |
| Market value of quoted investments (including interest accrued), non-current |
10,898 |
11,336 |
| Aggregate amount of unquoted investments |
14,686 |
16,034 |
| # Aggregate amount of impairment in value of investments |
94 |
94 |
| Reduction in the fair value of assets held for sale |
854 |
854 |
| Investments carried at cost |
11,859 |
11,909 |
| Investments carried at amortized cost |
1,903 |
1,906 |
| Investments carried at fair value through other comprehensive income |
11,705 |
13,603 |
| Investments carried at fair value through profit or loss |
1,191 |
744 |
| (1) | | Uncalled capital commitments outstanding as of June 30, 2023 and March 31, 2023 was 8
crore and 8 crore, respectively. |
Refer to note 2.11 for accounting policies on financial
instruments.
Method of fair valuation:
(In crore)
| Class of investment |
Method |
Fair value as at |
| |
|
June 30, 2023 |
March 31, 2023 |
| Liquid mutual fund units - carried at fair value through profit or loss |
Quoted price |
700 |
260 |
| Target maturity fund units - carried at fair value through profit or loss |
Quoted price |
409 |
402 |
| Tax free bonds and government bonds - carried at amortized cost |
Quoted price and market observable inputs |
2,139 |
2,134 |
| Non-convertible debentures - carried at fair value through other comprehensive income |
Quoted price and market observable inputs |
3,213 |
3,366 |
| Government securities - carried at fair value through other comprehensive income |
Quoted price and market observable inputs |
6,856 |
6,856 |
| Commercial Papers - carried at fair value through other comprehensive income |
Market observable inputs |
1,169 |
420 |
| Certificates of deposit - carried at fair value through other comprehensive income |
Market observable inputs |
271 |
2,765 |
| Unquoted equity and preference securities - carried at fair value through other comprehensive income |
Discounted cash flows method, Market multiples method, Option pricing model |
196 |
196 |
| Others - carried at fair value through profit or loss |
Discounted cash flows method, Market multiples method, Option pricing model |
82 |
82 |
| Total |
|
15,035 |
16,481 |
Note : Certain quoted investments are classified as Level 2 in the absence
of active market for such investments.
2.5 LOANS
(In crore)
| Particulars |
As at |
| |
June 30, 2023 |
March 31, 2023 |
| Non- Current |
|
|
| Loans considered good - Unsecured |
|
|
| Other Loans |
|
|
| Loans to employees |
34 |
39 |
| |
34 |
39 |
| Loans credit impaired - Unsecured |
|
|
| Other Loans |
|
|
| Loans to employees |
– |
– |
| Less: Allowance for credit impairment |
– |
– |
| |
– |
– |
| Total non - current loans |
34 |
39 |
| Current |
|
|
| Loans considered good - Unsecured |
|
|
| Loans to subsidiaries |
44 |
43 |
| Other Loans |
|
|
| Loans to employees |
233 |
248 |
| Total current loans |
277 |
291 |
| Total Loans |
311 |
330 |
2.6 OTHER FINANCIAL ASSETS
(In crore)
| Particulars |
As at |
| |
June 30, 2023 |
March 31, 2023 |
| Non-current |
|
|
| Security deposits (1) |
42 |
43 |
| Net investment in Sublease of right of use asset (1) |
– |
298 |
| Rental deposits (1) |
184 |
183 |
| Unbilled revenues (1)(5)# |
611 |
686 |
| Others(1) |
121 |
131 |
| Total non-current other financial assets |
958 |
1,341 |
| Current |
|
|
| Security deposits (1) |
1 |
1 |
| Rental deposits (1) |
4 |
5 |
| Restricted deposits (1)* |
2,282 |
2,116 |
| Unbilled revenues (1)(5)# |
4,462 |
5,166 |
| Interest accrued but not due (1) |
284 |
441 |
| Foreign currency forward and options contracts (2)(3) |
144 |
79 |
| Net investment in Sublease of right-of-use asset (1) |
– |
48 |
| Others (1)(4) |
1,609 |
1,232 |
| Total current other financial assets |
8,786 |
9,088 |
| Total other financial assets |
9,744 |
10,429 |
| (1) Financial assets carried at amortized cost |
9,600 |
10,350 |
| (2) Financial assets carried at fair value through other comprehensive income |
22 |
32 |
| (3) Financial assets carried at fair value through Profit or Loss |
122 |
47 |
| (4) Includes dues from subsidiaries |
1,327 |
1,051 |
| (5) Includes dues from subsidiaries |
143 |
290 |
| * | | Restricted deposits represent deposit with financial institutions to settle employee related
obligations as and when they arise during the normal course of business. |
| # | | Classified as financial asset as right to consideration is unconditional and is due only
after a passage of time. |
2.7 TRADE RECEIVABLES
(In crore)
| Particulars |
As at |
| |
June 30, 2023 |
March 31, 2023 |
| Current |
|
|
| Trade Receivable considered good - Unsecured (1) |
22,683 |
21,202 |
| Less: Allowance for expected credit loss |
495 |
429 |
| Trade Receivable considered good - Unsecured |
22,188 |
20,773 |
| |
| Trade Receivable - credit impaired - Unsecured |
120 |
106 |
| Less: Allowance for credit impairment |
120 |
106 |
| Trade Receivable - credit impaired - Unsecured |
– |
– |
| Total trade receivables (2) |
22,188 |
20,773 |
| (1) Includes dues from subsidiaries |
717 |
611 |
| (2) Includes dues from companies where directors are interested |
– |
– |
2.8 CASH AND CASH EQUIVALENTS
(In crore)
| Particulars |
As at |
| |
June 30, 2023 |
March 31, 2023 |
| Balances with banks |
|
|
| In current and deposit accounts |
4,797 |
4,864 |
| Cash on hand |
– |
– |
| Others |
|
|
| Deposits with financial institutions |
1,470 |
1,670 |
| Total Cash and cash equivalents |
6,267 |
6,534 |
| Balances with banks in unpaid dividend accounts |
36 |
37 |
| Deposit with more than 12 months maturity |
– |
700 |
Cash and cash equivalents as at June 30, 2023 and March
31, 2023 include restricted cash and bank balances of 77 crore and 46 crore, respectively.
The deposits maintained by the Company with banks and
financial institutions comprise of time deposits, which can be withdrawn by the Company at any point without prior notice or penalty on
the principal.
2.9 EARMARKED BANK BALANCE FOR DIVIDEND
(In crore)
| Particulars |
As at |
| |
June 30, 2023 |
March 31, 2023 |
| Current |
|
|
| Earmarked bank balance for dividend |
7,262 |
— |
| Total |
7,262 |
— |
The Board of Directors in their meeting held on April
13, 2023 recommended a final dividend of 17.50/- per equity share for the financial year ended March 31, 2023. The same was approved
by the shareholders at the Annual General Meeting (AGM) of the Company held on June 28, 2023. Payment date for the dividend is July 3,
2023. Earmarked bank balance for dividend represents cash which is deposited in a designated bank account only for payment of final dividend
for financial year ended March 31, 2023.
2.10 OTHER ASSETS
(In crore)
| Particulars |
As at |
| |
June 30, 2023 |
March 31, 2023 |
| Non-current |
|
|
| Capital advances |
145 |
141 |
| Advances other than capital advances |
|
|
| Others |
|
|
| Prepaid expenses |
57 |
63 |
| Defined benefit plan assets |
9 |
9 |
| Deferred contract cost |
|
|
| Cost of obtaining a contract(3) |
123 |
139 |
| Cost of fulfillment |
666 |
601 |
| Unbilled revenues(2) |
169 |
167 |
| Withholding taxes and others |
668 |
668 |
| Total non-current other assets |
1,837 |
1,788 |
| Current |
|
|
| Advances other than capital advances |
|
|
| Payment to vendors for supply of goods |
176 |
171 |
| Others |
|
|
| Prepaid expenses (1) |
1,927 |
1,705 |
| Unbilled revenues(2) |
6,118 |
6,365 |
| Deferred contract cost |
|
|
| Cost of obtaining a contract(3) |
319 |
400 |
| Cost of fulfillment |
132 |
109 |
| Withholding taxes and others |
2,092 |
2,047 |
| Other receivables |
48 |
123 |
| Total current other assets |
10,812 |
10,920 |
| Total other assets |
12,649 |
12,708 |
| (1) Includes dues from subsidiaries |
182 |
198 |
| (2) | | Classified as non-financial asset as the contractual right to consideration is dependent
on completion of contractual milestones. |
| (3) | | Includes technology assets taken over by the Company from a customer as a part of transformation
project which is not considered as distinct goods or services and the control related to the assets is not transferred to the Company
in accordance with Ind AS 115 - Revenue from contract with customers. Accordingly, the same has been considered as a reduction to the
total contract value and accounted as Deferred contract cost. The Company has entered into a financing arrangement with a third party
for these assets which has been considered as financial liability. As at June 30, 2023, the financial liability pertaining to such arrangements
amounts to 92 crore. (Refer to note 2.12) |
Withholding taxes and others primarily consist of input
tax credits and Cenvat/ VAT recoverable from Government of India.
2.11 FINANCIAL INSTRUMENTS
Accounting Policy
2.11.1 Initial recognition
The Company recognizes financial assets and financial
liabilities when it becomes a party to the contractual provisions of the instrument. All financial assets and liabilities are recognized
at fair value on initial recognition, except for trade receivables which are initially measured at transaction price. Transaction costs
that are directly attributable to the acquisition or issue of financial assets and financial liabilities, which are not at fair value
through profit or loss, are added to the fair value on initial recognition. Regular way purchase and sale of financial assets are accounted
for at trade date.
2.11.2 Subsequent measurement
a. Non-derivative financial instruments
(i) Financial assets carried at amortized cost
A financial asset is subsequently measured at amortized
cost if it is held within a business model whose objective is to hold the asset in order to collect contractual cash flows and the contractual
terms of the financial asset give rise on specified dates to cash flows that are solely payments of principal and interest on the principal
amount outstanding.
(ii) Financial assets carried at fair value through
other comprehensive income (FVOCI)
A financial asset is subsequently measured at fair
value through other comprehensive income if it is held within a business model whose objective is achieved by both collecting contractual
cash flows and selling financial assets and the contractual terms of the financial asset give rise on specified dates to cash flows that
are solely payments of principal and interest on the principal amount outstanding. The Company has made an irrevocable election for its
investments which are classified as equity instruments to present the subsequent changes in fair value in other comprehensive income based
on its business model.
(iii) Financial assets carried at fair value
through profit or loss
A financial asset which is not classified in any of
the above categories are subsequently fair valued through profit or loss.
(iv) Financial liabilities
Financial liabilities are subsequently carried at amortized
cost using the effective interest method, except for contingent consideration recognized in a business combination which is subsequently
measured at fair value through profit or loss.
(v) Investment in subsidiaries
Investment in subsidiaries is carried at cost in the
separate financial statements.
b. Derivative financial instruments
The Company holds derivative financial instruments
such as foreign exchange forward and option contracts to mitigate the risk of changes in exchange rates on foreign currency exposures.
The counterparty for such contracts is generally a bank.
(i) Financial assets or financial liabilities,
carried at fair value through profit or loss.
This category includes derivative financial assets
or liabilities which are not designated as hedges.
Although the Company believes that these derivatives
constitute hedges from an economic perspective, they may not qualify for hedge accounting under Ind AS 109, Financial Instruments. Any
derivative that is either not designated as hedge, or is so designated but is ineffective as per Ind AS 109, is categorized as a financial
asset or financial liability, at fair value through profit or loss.
Derivatives not designated as hedges are recognized
initially at fair value and attributable transaction costs are recognized in net profit in the Statement of Profit and Loss when incurred.
Subsequent to initial recognition, these derivatives are measured at fair value through profit or loss and the resulting exchange gains
or losses are included in other income. Assets/ liabilities in this category are presented as current assets/current liabilities if they
are either held for trading or are expected to be realized within 12 months after the Balance Sheet date.
(ii) Cash flow hedge
The Company designates certain foreign exchange forward
and options contracts as cash flow hedges to mitigate the risk of foreign exchange exposure on highly probable forecast cash transactions.
When a derivative is designated as a cash flow hedge instrument, the effective portion of changes in the fair value of the derivative
is recognized in other comprehensive income and accumulated in the cash flow hedge reserve. Any ineffective portion of changes in the
fair value of the derivative is recognized immediately in the net profit in the Statement of Profit and Loss. If the hedging instrument
no longer meets the criteria for hedge accounting, then hedge accounting is discontinued prospectively. If the hedging instrument expires
or is sold, terminated or exercised, the cumulative gain or loss on the hedging instrument recognized in cash flow hedge reserve till
the period the hedge was effective remains in cash flow hedge reserve until the forecasted transaction occurs. The cumulative gain or
loss previously recognized in the cash flow hedge reserve is transferred to the net profit in the condensed Statement of Profit and Loss
upon the occurrence of the related forecasted transaction. If the forecasted transaction is no longer expected to occur, then the amount
accumulated in cash flow hedge reserve is reclassified to net profit in the Statement of Profit and Loss.
2.11.3 Derecognition of financial instruments
The Company derecognizes a financial asset when the
contractual rights to the cash flows from the financial asset expire or it transfers the financial asset and the transfer qualifies for
derecognition under Ind AS 109. A financial liability (or a part of a financial liability) is derecognized from the Company's Balance
Sheet when the obligation specified in the contract is discharged or cancelled or expires.
2.11.4 Fair value of financial instruments
In determining the fair value of its financial instruments,
the Company uses a variety of methods and assumptions that are based on market conditions and risks existing at each reporting date. The
methods used to determine fair value include discounted cash flow analysis, option pricing model, market multiples, available quoted market
prices and dealer quotes. All methods of assessing fair value result in general approximation of value, and such value may never actually
be realized.
Refer to table 'Financial instruments by category'
below for the disclosure on carrying value and fair value of financial assets and liabilities. For financial assets and liabilities maturing
within one year from the Balance Sheet date and which are not carried at fair value, the carrying amounts approximate fair value due to
the short maturity of these instruments.
2.11.5 Impairment
The Company recognizes loss allowances using the expected
credit loss (ECL) model for the financial assets and unbilled revenues which are not fair valued through profit or loss. Loss allowance
for trade receivables and unbilled revenues with no significant financing component is measured at an amount equal to lifetime ECL. For
all other financial assets, expected credit losses are measured at an amount equal to the 12-month ECL, unless there has been a significant
increase in credit risk from initial recognition in which case those are measured at lifetime ECL. The Company determines the allowance
for credit losses based on historical loss experience adjusted to reflect current and estimated future economic conditions. The Company
considers current and anticipated future economic conditions relating to industries the Company deals with and the countries where it
operates.The amount of ECLs (or reversal) that is required to adjust the loss allowance at the reporting date to the amount that is required
to be recorded is recognized as an impairment loss or gain in statement of profit and loss.
Financial instruments by category
The carrying value and fair value of financial instruments
by categories as at June 30, 2023 are as follows:
(In crore)
| Particulars |
Amortized cost |
Financial assets/ liabilities at fair value through profit or loss
|
Financial assets/liabilities at fair value through OCI
|
Total carrying value |
Total fair value |
| |
|
Designated upon initial recognition |
Mandatory |
Equity instruments designated upon initial recognition |
Mandatory |
|
|
| Assets: |
|
|
|
|
|
|
|
| Cash and cash equivalents (Refer to note 2.8) |
6,267 |
– |
– |
– |
– |
6,267 |
6,267 |
| Earmarked bank balance for dividend (Refer note 2.9) |
7,262 |
– |
– |
– |
– |
7,262 |
7,262 |
| Investments (Refer to note 2.4) |
|
|
|
|
|
|
|
| Preference securities, Equity instruments and others |
– |
– |
82 |
196 |
– |
278 |
278 |
| Tax free bonds and government bonds |
1,903 |
– |
– |
– |
– |
1,903 |
2,139(1) |
| Liquid mutual fund units |
– |
– |
700 |
– |
– |
700 |
700 |
| Target maturity fund units |
– |
– |
409 |
– |
– |
409 |
409 |
| Commercial Papers |
– |
– |
– |
– |
1,169 |
1,169 |
1,169 |
| Certificates of deposits |
– |
– |
– |
– |
271 |
271 |
271 |
| Non convertible debentures |
– |
– |
– |
– |
3,213 |
3,213 |
3,213 |
| Government Securities |
– |
– |
– |
– |
6,856 |
6,856 |
6,856 |
| Trade receivables (Refer to note 2.7) |
22,188 |
– |
– |
– |
– |
22,188 |
22,188 |
| Loans (Refer to note 2.5) |
311 |
– |
– |
– |
– |
311 |
311 |
| Other financial assets (Refer to note 2.6) (3) |
9,600 |
– |
122 |
– |
22 |
9,744 |
9,652(2) |
| Total |
47,531 |
– |
1,313 |
196 |
11,531 |
60,571 |
60,715 |
| Liabilities: |
|
|
|
|
|
|
|
| Trade payables (Refer to note 2.14) |
2,659 |
– |
– |
– |
– |
2,659 |
2,659 |
| Lease liabilities (Refer to note 2.3) |
4,216 |
– |
– |
– |
– |
4,216 |
4,216 |
| Other financial liabilities (Refer to note 2.13) |
16,753 |
– |
8 |
– |
6 |
16,767 |
16,767 |
| Total |
23,628 |
– |
8 |
– |
6 |
23,642 |
23,642 |
| (1) | | On account of fair value changes including interest accrued |
| (2) | | Excludes interest accrued on tax free bonds and government bonds carried at amortized
cost of 92 crore |
| (3) | | Excludes unbilled revenue on contracts where the right to consideration is dependent on
completion of contractual milestones |
The carrying value and fair value of financial instruments
by categories as at March 31, 2023 were as follows:
(In crore)
| Particulars |
Amortized cost |
Financial assets/ liabilities at fair value through profit or loss |
Financial assets/liabilities at fair value through OCI |
Total carrying value |
Total fair value |
| |
|
Designated upon initial recognition |
Mandatory |
Equity instruments designated upon initial recognition |
Mandatory |
|
|
| Assets: |
|
|
|
|
|
|
|
| Cash and cash equivalents (Refer to note 2.8) |
6,534 |
– |
– |
– |
– |
6,534 |
6,534 |
| Investments (Refer to note 2.4) |
|
|
|
|
|
|
|
| Preference securities, Equity instruments and others |
– |
– |
82 |
196 |
– |
278 |
278 |
| Tax free bonds and government bonds |
1,906 |
– |
– |
– |
– |
1,906 |
2,134(1) |
| Target maturity fund units |
– |
– |
402 |
– |
– |
402 |
402 |
| Liquid mutual fund units |
– |
– |
260 |
– |
– |
260 |
260 |
| Commercial Papers |
– |
– |
– |
– |
420 |
420 |
420 |
| Certificates of deposits |
– |
– |
– |
– |
2,765 |
2,765 |
2,765 |
| Non convertible debentures |
– |
– |
– |
– |
3,366 |
3,366 |
3,366 |
| Government Securities |
– |
– |
– |
– |
6,856 |
6,856 |
6,856 |
| Trade receivables (Refer to note 2.7) |
20,773 |
– |
– |
– |
– |
20,773 |
20,773 |
| Loans (Refer to note 2.5) |
330 |
– |
– |
– |
– |
330 |
330 |
| Other financial assets (Refer to note 2.6)(3) |
10,350 |
– |
47 |
– |
32 |
10,429 |
10,345(2) |
| Total |
39,893 |
– |
791 |
196 |
13,439 |
54,319 |
54,463 |
| Liabilities: |
|
|
|
|
|
|
|
| Trade payables (Refer to note 2.14) |
2,426 |
– |
– |
– |
– |
2,426 |
2,426 |
| Lease Liabilities (Refer to note 2.3) |
4,266 |
– |
– |
– |
– |
4,266 |
4,266 |
| Other financial liabilities (Refer to note 2.13) |
11,989 |
– |
42 |
– |
14 |
12,045 |
12,045 |
| Total |
18,681 |
– |
42 |
– |
14 |
18,737 |
18,737 |
| (1) | | On account of fair value changes including interest accrued |
| (2) | | Excludes interest accrued on tax free bonds and government bonds carried at amortized
cost of 84 crore |
| (3) | | Excludes unbilled revenue on contracts where the right to consideration is dependent on
completion of contractual milestones |
For trade receivables, trade payables, other assets
and payables maturing within one year from the Balance Sheet date, the carrying amounts approximate the fair value due to the short maturity
of these instruments.
Fair value hierarchy
Level 1 - Quoted prices (unadjusted) in active
markets for identical assets or liabilities.
Level 2 – Inputs other than quoted prices
included within Level 1 that are observable for the asset or liability, either directly (i.e. as prices) or indirectly (i.e. derived from
prices).
Level 3 - Inputs for the assets or liabilities
that are not based on observable market data (unobservable inputs).
The fair value hierarchy of assets and liabilities
measured at fair value on a recurring basis as at June 30, 2023 is as follows:
(In crore)
| Particulars |
As at June 30, 2023 |
Fair value measurement at end of the reporting period using |
| |
|
Level 1 |
Level 2 |
Level 3 |
| Assets |
|
|
|
|
| Investments (Refer to note 2.4) |
|
|
|
|
| Investments in tax free bonds |
2,125 |
1,969 |
156 |
– |
| Investments in government bonds |
14 |
14 |
– |
– |
| Investments in liquid mutual fund units |
700 |
700 |
– |
– |
| Investments in target maturity fund units |
409 |
409 |
– |
– |
| Investments in certificates of deposit |
271 |
– |
271 |
– |
| Investments in commercial papers |
1,169 |
– |
1,169 |
– |
| Investments in non convertible debentures |
3,213 |
1,923 |
1,290 |
– |
| Investments in government securities |
6,856 |
6,856 |
– |
– |
| Investments in equity instruments |
3 |
– |
– |
3 |
| Investments in preference securities |
193 |
– |
– |
193 |
| Other investments |
82 |
– |
– |
82 |
| Others |
|
|
|
|
| Derivative financial instruments - gain on outstanding foreign exchange forward and option contracts (Refer to note 2.6) |
144 |
– |
144 |
– |
| Liabilities |
|
|
|
|
| Derivative financial instruments - loss on outstanding foreign exchange forward and option contracts (Refer to note 2.13) |
14 |
– |
14 |
– |
During the three months ended June 30, 2023, tax free bonds and non-convertible
debentures of 1,368 crore were transferred from Level 2 to Level 1 of fair value hierarchy since these were valued based on quoted
price.
The fair value hierarchy of assets and liabilities measured at fair value
on a recurring basis as at March 31, 2023 was as follows:
(In crore)
| Particulars |
As at March 31, 2023 |
Fair value measurement at end of the reporting period using |
| |
|
Level 1 |
Level 2 |
Level 3 |
| Assets |
|
|
|
|
| Investments (Refer to note 2.4) |
|
|
|
|
| Investments in tax free bonds |
2,120 |
1,331 |
789 |
– |
| Investments in target maturity fund units |
402 |
402 |
– |
– |
| Investments in government bonds |
14 |
14 |
– |
– |
| Investments in liquid mutual fund units |
260 |
260 |
– |
– |
| Investments in certificates of deposit |
2,765 |
– |
2,765 |
– |
| Investments in commercial papers |
420 |
– |
420 |
– |
| Investments in non convertible debentures |
3,366 |
1,364 |
2,002 |
– |
| Investments in government securities |
6,856 |
6,856 |
– |
– |
| Investments in equity instruments |
3 |
– |
– |
3 |
| Investments in preference securities |
193 |
– |
– |
193 |
| Other investments |
82 |
– |
– |
82 |
| Others |
|
|
|
|
| Derivative financial instruments - gain on outstanding foreign exchange forward and option contracts (Refer to note 2.6) |
79 |
– |
79 |
– |
| Liabilities |
|
|
|
|
| Derivative financial instruments - loss on outstanding foreign exchange forward and option contracts (Refer note 2.13) |
56 |
– |
56 |
– |
During the year ended March 31, 2023, tax free bonds
and government securities of 383 crore were transferred from Level 2 to Level 1 of fair value hierarchy since these were valued
based on quoted price. Further non-convertible debentures of 1,611 crore were transferred from Level 1 to Level 2 of fair value
hierarchy, since these were valued based on market observable inputs.
A one percentage point change in the unobservable inputs
used in fair valuation of Level 3 assets and liabilities does not have a significant impact in its value.
Majority of investments of the Company are fair valued
based on Level 1 or Level 2 inputs. These investments primarily include investment in liquid mutual fund units, target maturity fund units,
tax free bonds, certificates of deposit, commercial paper, treasury bills, government securities, quoted bonds issued by government and
quasi-government organizations and non-convertible debentures. The Company invests after considering counterparty risks based on multiple
criteria including Tier I capital, Capital Adequacy Ratio, Credit Rating, Profitability, NPA levels and Deposit base of banks and financial
institutions. These risks are monitored regularly as per Company's risk management program.
2.12 EQUITY
Accounting policy
Ordinary Shares
Ordinary shares are classified as equity share capital.
Incremental costs directly attributable to the issuance of new ordinary shares, share options and buyback are recognized as a deduction
from equity, net of any tax effects.
Description of reserves
Capital redemption reserve
In accordance with section 69 of the Indian Companies
Act, 2013, the Company creates capital redemption reserve equal to the nominal value of the shares bought back as an appropriation from
general reserve / retained earnings.
Retained earnings
Retained earnings represent the amount of accumulated
earnings of the Company.
Securities premium
The amount received in excess of the par value of equity
shares has been classified as securities premium. Amounts have been utilized for bonus issue and share buyback from share premium account.
Share options outstanding account
The Share options outstanding account is used to record
the fair value of equity-settled share based payment transactions with employees. The amounts recorded in share options outstanding account
are transferred to securities premium upon exercise of stock options and transferred to general reserve on account of stock options not
exercised by employees.
Special Economic Zone Re-investment reserve
The Special Economic Zone Re-investment reserve has
been created out of the profit of the eligible SEZ unit in terms of the provisions of Sec 10AA (1)(ii) of Income Tax Act, 1961. The reserve
should be utilized by the Company for acquiring new plant and machinery for the purpose of its business in terms of the provisions of
the Sec 10AA (2) of the Income Tax Act, 1961.
Other components of equity
Other components of equity include remeasurement of
net defined benefit liability / asset, equity instruments fair valued through other comprehensive income, changes on fair valuation of
investments and changes in fair value of derivatives designated as cash flow hedges, net of taxes.
Cash flow hedge reserve
When a derivative is designated as a cash flow hedging
instrument, the effective portion of changes in the fair value of the derivative is recognized in other comprehensive income and accumulated
in the cash flow hedging reserve. The cumulative gain or loss previously recognized in the cash flow hedging reserve is transferred to
the Statement of Profit and Loss upon the occurrence of the related forecasted transaction.
2.12.1 EQUITY SHARE CAPITAL
(In crore, except as otherwise stated)
| Particulars |
As at |
| |
June 30, 2023 |
March 31, 2023 |
| Authorized |
|
|
| Equity shares, 5/- par value |
|
|
| 4,80,00,00,000 (4,80,00,00,000) equity shares |
2,400 |
2,400 |
| Issued, Subscribed and Paid-Up |
|
|
| Equity shares, 5/- par value (1) |
2,075 |
2,074 |
| 4,15,01,92,365 (4,14,85,60,044 ) equity shares fully paid-up |
|
|
| |
2,075 |
2,074 |
| (1) | | Refer to note 2.21 for details of basic and diluted shares |
Forfeited shares amounted to 1,500/- (1,500/-)
The Company has only one class of shares referred to
as equity shares having a par value of 5/-. Each holder of equity shares is entitled to one vote per share. The equity shares represented
by American Depository Shares (ADS) carry similar rights to voting and dividends as the other equity shares. Each ADS represents one underlying
equity share.
In the event of liquidation of the Company, the holders
of equity shares will be entitled to receive any of the remaining assets of the company in proportion to the number of equity shares held
by the shareholders, after distribution of all preferential amounts. However, no such preferential amounts exist currently. For details
of shares reserved for issue under the employee stock option plan of the Company, refer to the note below.
The reconciliation of the number of shares outstanding
and the amount of share capital as at June 30, 2023 and March 31, 2023 is set out below:
(in crore, except as stated otherwise)
| Particulars |
As at June 30, 2023 |
As at March 31, 2023 |
| |
Number of shares |
Amount |
Number of shares |
Amount |
| As at the beginning of the period |
4,14,85,60,044 |
2,074 |
4,20,67,38,641 |
2,103 |
| Add: Shares issued on exercise of employee stock options |
1,632,321 |
1 |
22,47,751 |
1 |
| Less: Shares bought back |
– |
– |
6,04,26,348 |
30 |
| As at the end of the period |
4,15,01,92,365 |
2,075 |
4,14,85,60,044 |
2,074 |
Capital allocation policy
Effective fiscal 2020, the company expects to return
approximately 85% of the free cash flow cumulatively over a 5-year period through a combination of semi annual dividends and/or share
buyback and/or special dividends, subject to applicable laws and requisite approvals, if any. Free cash flow is defined as net cash provided
by operating activities less capital expenditure as per the consolidated statement of cash flows prepared under IFRS. Dividend and buyback
include applicable taxes.
The Company’s objective when managing capital
is to safeguard its ability to continue as a going concern and to maintain an optimal capital structure so as to maximize shareholder
value. In order to maintain or achieve an optimal capital structure, the Company may adjust the amount of dividend payment, return capital
to shareholders, issue new shares or buy back issued shares. As of June 30, 2023, the Company has only one class of equity shares and
has no debt. Consequent to the above capital structure there are no externally imposed capital requirements.
2.12.2 DIVIDEND
The final dividend on shares is recorded as a liability
on the date of approval by the shareholders and interim dividends are recorded as a liability on the date of declaration by the Company's
Board of Directors. Income tax consequences of dividends on financial instruments classified as equity will be recognized according to
where the entity originally recognized those past transactions or events that generated distributable profits.
The Company declares and pays dividends in Indian rupees.
Companies are required to pay/distribute dividend after deducting applicable taxes. The remittance of dividends outside India is governed
by Indian law on foreign exchange and is also subject to withholding tax at applicable rates.
The amount of per share dividend recognized as distribution
to equity shareholders in accordance with Companies Act, 2013 is as follows:-
(in )
| Particulars |
Three months ended June 30, |
| |
2023 |
2022 |
| Final dividend for fiscal 2022 |
– |
16.00 |
| Final dividend for fiscal 2023 |
17.50 |
– |
The Board of Directors in their meeting held on April
13, 2023 recommended a final dividend of 17.50/- per equity share for the financial year ended March 31, 2023. The same was approved
by the shareholders at the Annual General Meeting (AGM) of the Company held on June 28, 2023 which will result in a net cash outflow of
7,262 crore. Payment date for the dividend is July 3, 2023.
2.12.3 Employee Stock Option Plan (ESOP):
Accounting Policy
The Company recognizes compensation expense relating
to share-based payments in net profit based on estimated fair-values of the awards on the grant date. The estimated fair value of awards
is recognized as an expense in the statement of profit and loss on a straight-line basis over the requisite service period for each separately
vesting portion of the award as if the award was in-substance, multiple awards with a corresponding increase to share options outstanding
account.
Infosys Expanded Stock Ownership Program 2019 (the
2019 Plan):
On June 22, 2019 pursuant to approval by the shareholders
in the Annual General Meeting, the Board has been authorized to introduce, offer, issue and provide share-based incentives to eligible
employees of the Company and its subsidiaries under the 2019 Plan. The maximum number of shares under the 2019 plan shall not exceed 5,00,00,000
equity shares. To implement the 2019 Plan, up to 4,50,00,000 equity shares may be issued by way of secondary acquisition of shares by
Infosys Expanded Stock Ownership Trust. The Restricted Stock Units (RSUs) granted under the 2019 plan shall vest based on the achievement
of defined annual performance parameters as determined by the administrator (Nomination and Remuneration Committee). The performance parameters
will be based on a combination of relative Total Shareholder Return (TSR) against selected industry peers and certain broader market domestic
and global indices and operating performance metrics of the company as decided by administrator. Each of the above performance parameters
will be distinct for the purposes of calculation of quantity of shares to vest based on performance. These instruments will generally
vest between a minimum of 1 to maximum of 3 years from the grant date.
2015 Stock Incentive Compensation Plan (the 2015
Plan):
On March 31, 2016, pursuant to the approval by the
shareholders through postal ballot, the Board was authorized to introduce, offer, issue and allot share-based incentives to eligible employees
of the Company and its subsidiaries under the 2015 Plan. The maximum number of shares under the 2015 plan shall not exceed 2,40,38,883
equity shares (this includes 1,12,23,576 equity shares which are held by the trust towards the 2011 Plan as at March 31, 2016). These
instruments will generally vest over a period of 4 years. The plan numbers mentioned above are further adjusted with the September 2018
bonus issue.
The equity settled and cash settled RSUs and stock options would vest generally over a period of 4 years and shall be exercisable
within the period as approved by the Nomination and Remuneration Committee (NARC). The exercise price of the RSUs will be equal to the
par value of the shares and the exercise price of the stock options would be the market price as on the date of grant.
Controlled trust holds 1,17,38,357 shares and 12,172,119
shares as at June 30, 2023 and March 31, 2023, respectively under the 2015 plan. Out of these shares, 200,000 equity shares each have
been earmarked for welfare activities of the employees as at June 30, 2023 and March 31, 2023.
The following is the summary of grants made during
the three months ended June 30, 2023 and June 30, 2022:
| |
2019 plan |
2015 plan |
| Particulars |
Three months ended June 30, |
Three months ended June 30, |
| |
2023 |
2022 |
2023 |
2022 |
| Equity settled RSUs |
|
|
|
|
| Key Managerial Personnel (KMP) |
78,281 |
176,893 |
333,596 |
101,967 |
| Employees other than KMP |
– |
370,960 |
4,500 |
– |
| Total Grants |
78,281 |
547,853 |
338,096 |
101,967 |
Notes on grants to KMP:
CEO & MD
Under the 2015 plan:
The Board, on April 13, 2023, based on the recommendations
of the Nomination and Remuneration Committee, approved the grant of performance-based RSUs (Annual performance equity grant) of fair value
of 34.75 crore for fiscal 2024 under the 2015 Plan. These RSUs will vest in line with the employment agreement based on achievement
of certain performance targets. Accordingly, 2,72,026 performance based RSU’s were granted effective May 2, 2023.
The Board, on April 13, 2023, based on the recommendations
of the Nomination and Remuneration Committee, approved the performance-based grant of RSUs (Annual performance equity ESG grant) of fair
value of 2 crore for fiscal 2024 under the 2015 Plan. These RSUs will vest in line with the employment agreement based on achievement
of certain environment, social and governance milestones as determined by the Board. Accordingly, 15,656 performance based RSU’s
were granted effective May 2, 2023.
The Board, on April 13, 2023, based on the recommendations
of the Nomination and Remuneration Committee, approved the performance-based grant of RSUs (Annual performance Equity TSR grant) of fair
value of 5 crore for fiscal 2024 under the 2015 Plan. These RSUs will vest in line with the employment agreement based on Company’s
performance on cumulative relative TSR over the years and as determined by the Board. Accordingly, 39,140 performance based RSU’s
were granted effective May 2, 2023.
Though the annual time based grants and annual performance
equity TSR grant for the remaining employment term ending on March 31, 2027 have not been granted as of June 30, 2023, since the service
commencement date precedes the grant date, the company has recorded employment stock compensation expense in accordance with Ind AS 102,
Share based payment. The grant date for this purpose in accordance with Ind AS 102, Share based payment is July 1, 2022.
Under the 2019 plan:
The Board, on April 13, 2023, based on the recommendations
of the Nomination and Remuneration Committee, approved performance-based grant of RSUs amounting to 10 crore for fiscal 2024 under
the 2019 Plan. These RSUs will vest based on achievement of certain performance targets. Accordingly, 78,281 performance based RSU’s
were granted effective May 2, 2023.
Other KMP
Under the 2015 plan:
During the three months ended June 30, 2023, based
on recommendations of Nomination and Remuneration Committee, the Board approved 6,774 performance based RSUs to a KMP under the 2015 plan.
The performance based RSUs will vest over three years based on certain performance targets.
The break-up of employee stock compensation expense
is as follows:
(in crore)
| Particulars |
Three months ended June 30, |
| |
2023 |
2022 |
| Granted to: |
|
|
| KMP |
20 |
17 |
| Employees other than KMP |
112 |
101 |
| Total (1) |
132 |
118 |
| (1) Cash settled stock compensation expense included in the above
|
1 |
(2) |
The fair value of the awards are estimated using the
Black-Scholes Model for time and non-market performance-based options and Monte Carlo simulation model is used for TSR based options.The
inputs to the model include the share price at date of grant, exercise price, expected volatility, expected dividends, expected term and
the risk free rate of interest. Expected volatility during the expected term of the options is based on historical volatility of the observed
market prices of the Company's publicly traded equity shares during a period equivalent to the expected term of the options. Expected
volatility of the comparative company have been modelled based on historical movements in the market prices of their publicly traded equity
shares during a period equivalent to the expected term of the options. Correlation coefficient is calculated between each peer entity
and the indices as a whole or between each entity in the peer group.
The fair value of each equity settled award is estimated
on the date of grant using the following assumptions:
| Particulars |
For options granted in |
| |
Fiscal 2024-
Equity Shares-RSU |
Fiscal 2023-
Equity Shares-RSU |
Fiscal 2023-
ADS-RSU |
| Weighted average share price () / ($ ADS) |
1,277 |
1,525 |
18.08 |
| Exercise price () / ($ ADS) |
5.00 |
5.00 |
0.07 |
| Expected volatility (%) |
25-31 |
23-32 |
27-34 |
| Expected life of the option (years) |
1-4 |
1-4 |
1-4 |
| Expected dividends (%) |
2-3 |
2-3 |
2-3 |
| Risk-free interest rate (%) |
7 |
5-7 |
2-5 |
| Weighted average fair value as on grant date () / ($ ADS) |
1,113 |
1,210 |
13.69 |
The expected life of the RSU/ESOP is estimated based
on the vesting term and contractual term of the RSU/ESOP, as well as expected exercise behavior of the employee who receives the RSU/ESOP.
2.13 OTHER FINANCIAL LIABILITIES
(In crore)
| Particulars |
As at |
| |
June 30, 2023 |
March 31, 2023 |
| Non-current |
|
|
| Others |
|
|
| Compensated absences |
74 |
76 |
| Accrued compensation to employees (1) |
7 |
5 |
| Accrued expenses (1) |
1,089 |
1,184 |
| Other payables (1)(6) |
35 |
52 |
| Total non-current other financial liabilities |
1,205 |
1,317 |
| Current |
|
|
| Unpaid dividends (1) |
36 |
37 |
| Others |
|
|
| Accrued compensation to employees (1) |
2,788 |
3,072 |
| Accrued expenses (1)(4) |
4,296 |
4,430 |
| Retention monies (1) |
14 |
17 |
| Capital creditors (1) |
246 |
652 |
| Compensated absences |
2,004 |
1,893 |
| Final dividend payable to share holders(1)* |
6,543 |
- |
| Other payables (1)(5)(6) |
1,699 |
2,540 |
| Foreign currency forward and options contracts (2)(3) |
14 |
56 |
| Total current other financial liabilities |
17,640 |
12,697 |
| Total other financial liabilities |
18,845 |
14,014 |
| (1) Financial liability carried at amortized cost |
16,753 |
11,989 |
| (2) Financial liability carried at fair value through profit or loss |
8 |
42 |
| (3) Financial liability carried at fair value through other comprehensive income |
6 |
14 |
| (4) Includes dues to subsidiaries |
30 |
30 |
| (5) Includes dues to subsidiaries |
327 |
422 |
(6) Deferred contract cost (Refer to
note 2.10) includes technology assets taken over by the Company from a customer as a part of transformation project which is not considered
as distinct goods or services and the control related to the assets is not transferred to the Company in accordance with Ind AS 115 -
Revenue from contract with customers. Accordingly, the same has been considered as a reduction to the total contract value and accounted
as Deferred contract cost. The Company has entered into a financing arrangement with a third party for these assets which has been considered
as financial liability. As at June 30, 2023, the financial liability pertaining to such arrangements amounts to 92 crore.
| * | | Pertains to final dividend declared by the Company for fiscal 2023 and approved by the
shareholders on June 28, 2023. Payment date for dividend is July 3, 2023 (Refer note 2.12.2). |
Accrued expenses primarily relate to cost of technical
sub-contractors, telecommunication charges, legal and professional charges, brand building expenses, overseas travel expenses, office
maintenance and cost of third party software and hardware.
2.14 TRADE PAYABLES
(In crore)
| Particulars |
As at |
| |
June 30, 2023 |
March 31, 2023 |
| Outstanding dues of micro enterprises and small enterprises |
95 |
97 |
| Outstanding dues of creditors other than micro enterprises and small enterprises(1) |
2,564 |
2,329 |
| Total trade payables |
2,659 |
2,426 |
| (1)
Includes dues to subsidiaries |
820 |
653 |
2.15 OTHER LIABILITIES
(In crore)
| Particulars |
As at |
| |
June 30, 2023 |
March 31, 2023 |
| Non-current |
|
|
| Accrued defined benefit liability |
247 |
412 |
| Others |
|
|
| Deferred income |
2 |
2 |
| Deferred income - government grants |
23 |
– |
| Total non - current other liabilities |
272 |
414 |
| Current |
|
|
| Accrued defined benefit liability |
2 |
2 |
| Unearned revenue |
5,732 |
5,491 |
| Others |
|
|
| Deferred income - government grants |
10 |
28 |
| Withholding taxes and others |
2,852 |
2,088 |
| Total current other liabilities |
8,596 |
7,609 |
| Total other liabilities |
8,868 |
8,023 |
2.16 PROVISIONS
Accounting Policy
A provision is recognized if, as a result of a past
event, the Company has a present legal or constructive obligation that is reasonably estimable, and it is probable that an outflow of
economic benefits will be required to settle the obligation. Provisions are determined by discounting the expected future cash flows at
a pre-tax rate that reflects current market assessments of the time value of money and the risks specific to the liability.
a. Post-sales client support
The Company provides its clients with a fixed-period
post sales support on its fixed-price, fixed-timeframe contracts. Costs associated with such support services are accrued at the time
related revenues are recorded in the Statement of Profit and Loss. The Company estimates such costs based on historical experience and
estimates are reviewed on a periodic basis for any material changes in assumptions and likelihood of occurrence.
b. Onerous contracts
Provisions for onerous contracts are recognized when
the expected benefits to be derived by the Company from a contract are lower than the unavoidable costs of meeting the future obligations
under the contract. Provisions for estimated losses, if any, on incomplete contracts are recorded in the period in which such losses become
probable based on the estimated efforts or costs to complete the contract. The provision is measured at the present value of the lower
of the expected cost of terminating the contract and the expected net cost of continuing with the contract. Before a provision is established,
the Company recognizes any impairment loss on the assets associated with that contract.
Provision for post-sales client support and other
provisions
(In crore)
| Particulars |
As at |
| |
June 30, 2023 |
March 31, 2023 |
| Current |
|
|
| Others |
|
|
| Post-sales client support and others |
1,360 |
1,163 |
| Total provisions |
1,360 |
1,163 |
Provision for post sales client support and other provisions
majorly represents costs associated with providing sales support services which are accrued at the time of recognition of revenues and
are expected to be utilized over a period of 1 year.
2.17 INCOME TAXES
Accounting Policy
Income tax expense comprises current and deferred income
tax. Income tax expense is recognized in net profit in the statement of Profit and Loss except to the extent that it relates to items
recognized directly in equity, in which case it is recognized in equity or other comprehensive income. Current income tax for current
and prior periods is recognized at the amount expected to be paid to or recovered from the tax authorities, using the tax rates and tax
laws that have been enacted or substantively enacted by the Balance Sheet date. Deferred income tax assets and liabilities are recognized
for all temporary differences arising between the tax bases of assets and liabilities and their carrying amounts in the financial statements.
Deferred tax assets are reviewed at each reporting date and are reduced to the extent that it is no longer probable that the related tax
benefit will be realized.
Deferred income tax assets and liabilities are measured
using tax rates and tax laws that have been enacted or substantively enacted by the Balance Sheet date and are expected to apply to taxable
income in the years in which those temporary differences are expected to be recovered or settled. The effect of changes in tax rates on
deferred income tax assets and liabilities is recognized as income or expense in the period that includes the enactment or the substantive
enactment date. A deferred income tax asset is recognized to the extent that it is probable that future taxable profit will be available
against which the deductible temporary differences and tax losses can be utilized. Deferred income taxes are not provided on the undistributed
earnings of subsidiaries and branches where it is expected that the earnings of the subsidiary or branch will not be distributed in the
foreseeable future.
The Company offsets current tax assets and current tax liabilities; deferred tax assets and deferred tax liabilities,
where it has a legally enforceable right to set off the recognized amounts and where it intends either to settle on a net basis, or to
realize the asset and settle the liability simultaneously. The income tax provision for the interim period is made based on the best estimate
of the annual average tax rate expected to be applicable for the full financial year. Tax benefits of deductions earned on exercise of
employee share options in excess of compensation charged to income are credited to equity.
Income tax expense in the statement of Profit and Loss
comprises:
(In crore)
| Particulars |
Three months ended June 30, |
| |
2023 |
2022 |
| Current taxes |
2,065 |
2,032 |
| Deferred taxes |
125 |
(31) |
| Income tax expense |
2,190 |
2,001 |
Income tax expense for the three months ended June
30, 2023 and June 30, 2022 includes reversals (net of provisions) of 46 crore and provisions (net of reversals) of 19 crore,
respectively. These provisions and reversals pertaining to prior periods are primarily on account of adjudication of certain disputed
matters, upon filing of tax return and completion of assessments, across various jurisdictions.
Deferred income tax for the three months June 30, 2023
and June 30, 2022 substantially relates to origination and reversal of temporary differences.
The Company’s Advanced Pricing Arrangement (APA)
with the Internal Revenue Service (IRS) for US branch income tax expired in March 2021. The Company has applied for renewal of APA and
currently the US taxable income is based on the Company’s best estimate determined based on the expected value method.
2.18 REVENUE FROM OPERATIONS
Accounting Policy
The Company derives revenues primarily from IT services
comprising software development and related services, cloud and infrastructure services, maintenance, consulting and package implementation,
licensing of software products and platforms across the Company’s core and digital offerings (together called as “software
related services”). Contracts with customers are either on a time-and-material, unit of work, fixed-price or on a fixed-timeframe
basis.
Revenues from customer contracts are considered for
recognition and measurement when the contract has been approved in writing, by the parties, to the contract, the parties to contract are
committed to perform their respective obligations under the contract, and the contract is legally enforceable. Revenue is recognized upon
transfer of control of promised products or services (“performance obligations”) to customers in an amount that reflects the
consideration the Company has received or expects to receive in exchange for these products or services (“transaction price”).
When there is uncertainty as to collectability, revenue recognition is postponed until such uncertainty is resolved.
The Company assesses the services promised in a contract
and identifies distinct performance obligations in the contract. The Company allocates the transaction price to each distinct performance
obligation based on the relative standalone selling price. The price that is regularly charged for an item when sold separately is the
best evidence of its standalone selling price. In the absence of such evidence, the primary method used to estimate standalone selling
price is the expected cost plus a margin, under which the Company estimates the cost of satisfying the performance obligation and then
adds an appropriate margin based on similar services
The Company’s contracts may include variable
consideration including rebates, volume discounts and penalties. The Company includes variable consideration as part of transaction price
when there is a basis to reasonably estimate the amount of the variable consideration and when it is probable that a significant reversal
of cumulative revenue recognized will not occur when the uncertainty associated with the variable consideration is resolved.
Revenue on time-and-material and unit of work based
contracts, are recognized as the related services are performed. Fixed price maintenance revenue is recognized ratably either on a straight-line
basis when services are performed through an indefinite number of repetitive acts over a specified period or ratably using a percentage
of completion method when the pattern of benefits from the services rendered to the customer and Company’s costs to fulfil the contract
is not even through the period of contract because the services are generally discrete in nature and not repetitive. Revenue from other
fixed-price, fixed-timeframe contracts, where the performance obligations are satisfied over time is recognized using the percentage-of-completion
method. Efforts or costs expended are used to determine progress towards completion as there is a direct relationship between input and
productivity. Progress towards completion is measured as the ratio of costs or efforts incurred to date (representing work performed)
to the estimated total costs or efforts. Estimates of transaction price and total costs or efforts are continuously monitored over the
term of the contracts and are recognized in net profit in the period when these estimates change or when the estimates are revised. Revenues
and the estimated total costs or efforts are subject to revision as the contract progresses. Provisions for estimated losses, if any,
on incomplete contracts are recorded in the period in which such losses become probable based on the estimated efforts or costs to complete
the contract.
The billing schedules agreed with customers include
periodic performance based billing and / or milestone based progress billings. Revenues in excess of billing are classified as unbilled
revenue while billing in excess of revenues are classified as contract liabilities (which we refer to as "unearned revenues").
In arrangements for software development and related
services and maintenance services, by applying the revenue recognition criteria for each distinct performance obligation, the arrangements
with customers generally meet the criteria for considering software development and related services as distinct performance obligations.
For allocating the transaction price, the Company measures the revenue in respect of each performance obligation of a contract at its
relative standalone selling price. The price that is regularly charged for an item when sold separately is the best evidence of its standalone
selling price. In cases where the Company is unable to determine the standalone selling price, the Company uses the expected cost plus
margin approach in estimating the standalone selling price. For software development and related services, the performance obligations
are satisfied as and when the services are rendered since the customer generally obtains control of the work as it progresses.
Certain cloud and infrastructure services contracts
include multiple elements which may be subject to other specific accounting guidance, such as leasing guidance. These contracts are accounted
in accordance with such specific accounting guidance. In such arrangements where the Company is able to determine that hardware and services
are distinct performance obligations, it allocates the consideration to these performance obligations on a relative standalone selling
price basis. In the absence of standalone selling price, the Company uses the expected cost-plus margin approach in estimating the standalone
selling price. When such arrangements are considered as a single performance obligation, revenue is recognized over the period and measure
of progress is determined based on promise in the contract.
Revenue from licenses where the customer obtains a
“right to use” the licenses is recognized at the time the license is made available to the customer. Revenue from licenses
where the customer obtains a “right to access” is recognized over the access period.
Arrangements to deliver software products generally
have three elements: license, implementation and Annual Technical Services (ATS). When implementation services are provided in conjunction
with the licensing arrangement and the license and implementation have been identified as two distinct separate performance obligations,
the transaction price for such contracts are allocated to each performance obligation of the contract based on their relative standalone
selling prices. In the absence of standalone selling price for implementation, the Company uses the expected cost plus margin approach
in estimating the standalone selling price. Where the license is required to be substantially customized as part of the implementation
service the entire arrangement fee for license and implementation is considered to be a single performance obligation and the revenue
is recognized using the percentage-of-completion method as the implementation is performed. Revenue from client training, support and
other services arising due to the sale of software products is recognized as the performance obligations are satisfied. ATS revenue is
recognized ratably on a straight line basis over the period in which the services are rendered.
Contracts with customers includes subcontractor services
or third-party vendor equipment or software in certain integrated services arrangements. In these types of arrangements, revenue from
sales of third-party vendor products or services is recorded net of costs when the Company is acting as an agent between the customer
and the vendor, and gross when the Company is the principal for the transaction. In doing so, the Company first evaluates whether it controls
the good or service before it is transferred to the customer. The Company considers whether it has the primary obligation to fulfil the
contract, inventory risk, pricing discretion and other factors to determine whether it controls the goods or service and therefore is
acting as a principal or an agent.
The incremental costs of obtaining a contract (i.e.,
costs that would not have been incurred if the contract had not been obtained) are recognized as an asset if the Company expects to recover
them.
Certain eligible, nonrecurring costs (e.g. set-up or transition or transformation costs) that do not represent a separate performance
obligation are recognized as an asset when such costs (a) relate directly to the contract; (b) generate or enhance resources of the Company
that will be used in satisfying the performance obligation in the future; and (c) are expected to be recovered.
Capitalized contract costs
relating to upfront payments to customers are amortized to revenue and other capitalized costs are amortized to expenses over the respective
contract life on a systematic basis consistent with the transfer of goods or services to customer to which the asset relates. Capitalized
costs are monitored regularly for impairment. Impairment losses are recorded when present value of projected remaining operating cash
flows is not sufficient to recover the carrying amount of the capitalized costs.
The Company presents revenues net of indirect taxes
in its Statement of Profit and Loss.
Revenue from operations for the three months
ended June 30, 2023 and June 30, 2022 is as follows:
(In crore)
| Particulars |
Three months ended June 30, |
| |
2023 |
2022 |
| Revenue from software services |
31,748 |
29,487 |
| Revenue from products and platforms |
63 |
40 |
| Total revenue from operations |
31,811 |
29,527 |
Products & platforms
The Company derives revenues from the sale of products
and platforms including Infosys Applied AI which applies next-generation AI and machine learning.The percentage of revenue from fixed-price
contracts for each of the quarter ended June 30, 2023 and June 30, 2022 is 55%.
Trade receivables and Contract Balances
The timing of revenue recognition, billings and cash
collections results in receivables, unbilled revenue, and unearned revenue on the Company’s Balance Sheet. Amounts are billed as
work progresses in accordance with agreed-upon contractual terms, either at periodic intervals (e.g., monthly or quarterly) or upon achievement
of contractual milestones.
The Company’s receivables are rights to consideration
that are unconditional. Unbilled revenues comprising revenues in excess of billings from time and material contracts and fixed price maintenance
contracts are classified as financial asset when the right to consideration is unconditional and is due only after a passage of time.
Invoicing to the clients for other fixed price contracts
is based on milestones as defined in the contract and therefore the timing of revenue recognition is different from the timing of invoicing
to the customers. Therefore unbilled revenues for other fixed price contracts (contract asset) are classified as non-financial asset because
the right to consideration is dependent on completion of contractual milestones.
Invoicing in excess of earnings are classified as unearned
revenue.
Trade receivables and unbilled revenues are presented
net of impairment in the Balance Sheet.
2.19 OTHER INCOME, NET
2.19.1 Other income
Accounting Policy
Other income is comprised primarily of interest income,
dividend income, gain / loss on investments and exchange gain/loss on forward and options contracts and on translation of foreign currency
assets and liabilities. Interest income is recognized using the effective interest method. Dividend income is recognized when the right
to receive payment is established.
2.19.2 Foreign currency
Accounting Policy
Functional currency
The functional currency of the Company is the Indian
rupee. These financial statements are presented in Indian rupees (rounded off to crore; one crore equals ten million).
Transactions and translations
Foreign-currency denominated monetary assets and liabilities
are translated into the relevant functional currency at exchange rates in effect at the Balance Sheet date. The gains or losses resulting
from such translations are recognized in the Statement of Profit and Loss and reported within exchange gains/(losses) on translation of
assets and liabilities, net, except when deferred in Other Comprehensive Income as qualifying cash flow hedges. Non-monetary assets and
non-monetary liabilities denominated in a foreign currency and measured at fair value are translated at the exchange rate prevalent at
the date when the fair value was determined. Non-monetary assets and non-monetary liabilities denominated in a foreign currency and measured
at historical cost are translated at the exchange rate prevalent at the date of the transaction. The related revenue and expense are recognized
using the same exchange rate.
Transaction gains or losses realized upon settlement
of foreign currency transactions are included in determining net profit for the period in which the transaction is settled. Revenue, expense
and cash-flow items denominated in foreign currencies are translated into the relevant functional currencies using the exchange rate in
effect on the date of the transaction.
Other Comprehensive Income, net of taxes includes translation
differences on non-monetary financial assets measured at fair value at the reporting date, such as equities classified as financial instruments
and measured at fair value through other comprehensive income (FVOCI).
Government grant
The Company recognizes government grants only when
there is reasonable assurance that the conditions attached to them shall be complied with, and the grants will be received. Government
grants related to assets are treated as deferred income and are recognized in the net profit in the Statement of Profit and Loss on a
systematic and rational basis over the useful life of the asset. Government grants related to revenue are recognized on a systematic basis
in the net profit in the Statement of Profit and Loss over the periods necessary to match them with the related costs which they are intended
to compensate.
Other income for the three months June 30, 2023 and
June 30, 2022 is as follows:
(In crore)
| Particulars |
Three months ended June 30, |
| |
2023 |
2022 |
| Interest income on financial assets carried at amortized cost |
|
|
| Tax free bonds and government bonds |
33 |
37 |
| Deposit with Bank and others |
179 |
169 |
| Interest income on financial assets carried at fair value through other comprehensive income |
|
|
| Non-convertible debentures, commercial papers, certificates of deposit and government securities |
205 |
219 |
| Income on investments carried at fair value through other comprehensive income |
– |
1 |
| Income on investments carried at fair value through profit or loss |
|
|
| Gain / (loss) on liquid mutual funds and other investments |
41 |
19 |
| Dividend received from subsidiary |
400 |
– |
| Exchange gains/(losses) on foreign currency forward and options contracts |
135 |
(196) |
| Exchange gains/(losses) on translation of other assets and liabilities |
(66) |
334 |
| Miscellaneous income, net |
74 |
65 |
| Total other income |
1,001 |
648 |
2.20 EXPENSES
Accounting Policy
2.20.1 Gratuity and Pension
The Company provides for gratuity, a defined benefit retirement plan ('the
Gratuity Plan') covering eligible Indian employees of Infosys. The Gratuity Plan provides a lump-sum payment to vested employees at retirement,
death, incapacitation or termination of employment, of an amount based on the respective employee's salary and the tenure of employment
with the Company. The Company contributes Gratuity liabilities to the Infosys Limited Employees' Gratuity Fund Trust (the Trust). Trustees
administer contributions made to the Trusts and contributions are invested in a scheme with the Life Insurance Corporation of India as
permitted by Indian law.
The Company operates defined benefit pension plan in certain overseas jurisdictions,
in accordance with the local laws. These plans are managed by third party fund managers. The plans provide for periodic payouts after
retirement or for a lumpsum payment as set out in rules of each fund and includes death and disability benefits. The defined benefit plans
require contributions which are based on a percentage of salary that varies depending on the age of the respective employees
Liabilities with regard to these defined benefit plans are determined by
actuarial valuation, performed by an external actuary, at each Balance Sheet date using the projected unit credit method. These defined
benefit plans expose the Company to actuarial risks, such as longevity risk, interest rate risk and market risk.
The Company recognizes the net obligation of a defined benefit plan in its
Balance Sheet as an asset or liability. Gains and losses through re-measurements of the net defined benefit liability/(asset) are recognized
in other comprehensive income and are not reclassified to profit or loss in subsequent periods. The actual return of the portfolio of
plan assets, in excess of the yields computed by applying the discount rate used to measure the defined benefit obligation is recognized
in other comprehensive income. The effect of any plan amendments is recognized in net profit in the Statement of Profit and Loss.
2.20.2 Provident fund
Eligible employees of Infosys receive benefits from a provident fund, which
is a defined benefit plan. Both the eligible employee and the Company make monthly contributions to the provident fund plan equal to a
specified percentage of the covered employee's salary. The Company contributes a portion to the Infosys Limited Employees' Provident Fund
Trust. The trust invests in specific designated instruments as permitted by Indian law. The remaining portion is contributed to the government
administered pension fund. The rate at which the annual interest is payable to the beneficiaries by the trust is being administered by
the Government of India. The Company has an obligation to make good the shortfall, if any, between the return from the investments of
the Trust and the notified interest rate.
2.20.3 Superannuation
Certain employees of Infosys are participants in a defined contribution
plan. The Company has no further obligations to the Plan beyond its monthly contributions which are periodically contributed to a trust
fund, the corpus of which is invested with the Life Insurance Corporation of India.
2.20.4 Compensated absences
The Company has a policy on compensated absences which are both accumulating
and non-accumulating in nature. The expected cost of accumulating compensated absences is determined by actuarial valuation performed
by an independent actuary at each Balance Sheet date using projected unit credit method on the additional amount expected to be paid/availed
as a result of the unused entitlement that has accumulated at the Balance Sheet date. Expense on non-accumulating compensated absences
is recognized in the period in which the absences occur.
(In crore)
| Particulars |
Three months ended June 30, |
| |
2023 |
2022 |
| Employee benefit expenses |
|
|
| Salaries including bonus |
15,708 |
14,261 |
| Contribution to provident and other funds |
499 |
444 |
| Share based payments to employees (Refer to note 2.12) |
132 |
118 |
| Staff welfare |
14 |
91 |
| |
16,353 |
14,914 |
| Cost of software packages and others |
|
|
| For own use |
378 |
338 |
| Third party items bought for service delivery to clients |
796 |
845 |
| |
1,174 |
1,183 |
| Other expenses |
|
|
| Power and fuel |
44 |
35 |
| Brand and Marketing |
224 |
191 |
| Short-term leases |
1 |
3 |
| Rates and taxes |
75 |
54 |
| Repairs and Maintenance |
242 |
221 |
| Consumables |
7 |
7 |
| Insurance |
42 |
34 |
| Provision for post-sales client support and others |
54 |
17 |
| Commission to non-whole time directors |
3 |
4 |
| Impairment loss recognized / (reversed) under expected credit loss model |
86 |
28 |
| Auditor's remuneration |
|
|
| Statutory audit fees |
1 |
2 |
| Tax matters |
– |
– |
| Other services |
– |
– |
| Contributions towards Corporate Social Responsibility |
60 |
52 |
| Others |
132 |
44 |
| |
971 |
692 |
2.21 BASIC AND DILUTED SHARES USED IN COMPUTING EARNINGS PER EQUITY SHARE
Accounting Policy
Basic earnings per equity share is computed by dividing the net profit attributable
to the equity holders of the Company by the weighted average number of equity shares outstanding during the period. Diluted earnings per
equity share is computed by dividing the net profit attributable to the equity holders of the Company by the weighted average number of
equity shares considered for deriving basic earnings per equity share and also the weighted average number of equity shares that could
have been issued upon conversion of all dilutive potential equity shares. The dilutive potential equity shares are adjusted for the proceeds
receivable had the equity shares been actually issued at fair value (i.e. the average market value of the outstanding equity shares).
Dilutive potential equity shares are deemed converted as at the beginning of the period, unless issued at a later date. Dilutive potential
equity shares are determined independently for each period presented.
The number of equity shares and potentially dilutive equity shares
are adjusted retrospectively for all periods presented for any share splits and bonus shares issues including for changes effected prior
to the approval of the financial statements by the Board of Directors.
2.22 CONTINGENT LIABILITIES AND COMMITMENTS
Accounting Policy
Contingent liability is a possible obligation arising from past events and
whose existence will be confirmed only by the occurrence or non-occurrence of one or more uncertain future events not wholly within the
control of the entity or a present obligation that arises from past events but is not recognized because it is not probable that an outflow
of resources embodying economic benefits will be required to settle the obligation or the amount of the obligation cannot be measured
with sufficient reliability.
(In crore)
| Particulars |
As at |
| |
June 30, 2023 |
March 31, 2023 |
| Contingent liabilities: |
|
|
| Claims against the Company, not acknowledged as debts(1) |
4,351 |
4,316 |
| [Amount paid to statutory authorities 6,097 crore (6,115 crore)] |
|
|
| Commitments: |
|
|
| Estimated amount of contracts remaining to be executed on capital contracts and not provided for |
774 |
824 |
| (net of advances and deposits)(2) |
|
|
| Other Commitments* |
8 |
8 |
| * | | Uncalled capital pertaining to investments |
| (1) | | As at June 30, 2023 and March 31, 2023, claims against the Company not acknowledged as debts
in respect of income tax matters amounted to 3,964 crore and 3,953
crore, respectively.The claims against the Company primarily represent demands arising on completion of assessment proceedings under
the Income Tax Act, 1961. These claims are on account of multiple issues of disallowances such as disallowance of profits earned from
STP Units and SEZ Units, disallowance of deductions in respect of employment of new employees under section 80JJAA, disallowance of expenditure
towards software being held as capital in nature, payments made to Associated Enterprises held as liable for withholding of taxes. These
matters are pending before various Income Tax Authorities and the management including its tax advisors expect that its position will
likely be upheld on ultimate resolution and will not have a material adverse effect on the Company's financial position and results of
operations. |
Amount paid to statutory authorities against the tax
claims amounted to 6,088 crore and 6,105 crore as at June 30, 2023 and March 31, 2023, respectively.
| (2) | | Capital contracts primarily comprises of commitments for infrastructure facilities and computer
equipments. |
Legal Proceedings
The Company is subject to legal proceedings and claims,
which have arisen in the ordinary course of business. The Company’s management reasonably expects that these legal actions, when
ultimately concluded and determined, will not have a material and adverse effect on the Company’s results of operations or financial
condition.
2.23 RELATED PARTY TRANSACTIONS
Refer to the Company's Annual Report for the year ended
March 31, 2023 for the full names and other details of the Company's subsidiaries and controlled trusts.
Changes in Subsidiaries
During the three months ended June 30, 2023, there
are no changes in the subsidiaries.
The Company’s related party transactions during
the three months June 30, 2023 and June 30, 2022 and outstanding balances as at June 30, 2023 and June 30, 2022 are with its subsidiaries
with whom the Company generally enters into transactions which are at arms length and in the ordinary course of business.
Change in key management personnel
The following are the changes in the key management
personnel:
Independent directors:
-Helene Auriol Potier (appointed as independent director
effective May 26, 2023)
Executive Officers:
-Mohit Joshi (resigned as President effective March
11, 2023 and was on leave till June 9, 2023 which was his last date with the company)
Transactions with key management personnel
The table below describes the compensation to key management
personnel which comprise directors and executive officers:
(In crore)
| Particulars |
Three months ended June 30, |
| |
2023 |
2022 |
| Salaries and other short term employee benefits to whole-time directors and executive officers(1)(2) |
32 |
32 |
| Commission and other benefits to non-executive / independent directors |
4 |
4 |
| Total |
36 |
36 |
| (1) | | Total employee stock compensation expense for the three months ended June 30, 2023 and
June 30, 2022 includes a charge of 20 crore and 17 crore, respectively,
towards key managerial personnel.(Refer to note 2.12). |
| (2) | | Does not include post-employment benefits and other long-term benefits based on actuarial
valuation as these are done for the Company as a whole. |
2.24 SEGMENT REPORTING
The Company publishes this financial statement along
with the interim condensed consolidated financial statements. In accordance with Ind AS 108, Operating Segments, the Company has disclosed
the segment information in the interim condensed consolidated financial statements.
| for and on behalf of the Board of Directors of Infosys Limited |
| |
|
Nandan M. Nilekani
Chairman |
Salil Parekh
Chief Executive Officer and
Managing Director
|
Bobby Parikh
Director |
| |
|
Nilanjan Roy
Chief Financial Officer |
Jayesh Sanghrajka
Executive Vice President and
Deputy Chief Financial Officer |
A.G.S. Manikantha
Company Secretary |
| |
|
Bengaluru
July 20, 2023 |
Exhibit 99.10
Ind AS Consolidated
INFOSYS LIMITED AND
SUBSIDIARIES
Condensed Consolidated Financial Statements under
Indian Accounting Standards (Ind AS) for the three months June 30, 2023
| Index |
| Condensed Consolidated Balance Sheet |
| Condensed Consolidated Statement of Profit
and Loss |
| Condensed Consolidated Statement of Changes
in Equity |
| Condensed Consolidated Statement of Cash
Flows |
| Overview and Notes to the Interim
Condensed Consolidated Financial Statements |
| 1. Overview |
| 1.1 Company overview
|
| 1.2 Basis of preparation
of financial statements |
| 1.3 Basis of
consolidation |
| 1.4 Use of estimates and
judgments |
| 1.5 Critical accounting
estimates and judgments |
| 2. Notes to the Interim Condensed
Consolidated Financial Statements |
| 2.1 Business Combinations
|
| 2.2 Property, plant and
equipment |
| 2.3 Goodwill and
intangible assets |
| 2.4 Investments |
| 2.5 Loans |
| 2.6 Other financial
assets |
| 2.7 Trade receivables
|
| 2.8 Cash and cash
equivalents |
| 2.9 Earmarked bank
balance for dividend |
| 2.10 Other assets |
| 2.11 Financial
instruments |
| 2.12 Equity |
| 2.13 Other financial
liabilities |
| 2.14 Other liabilities
|
| 2.15 Provisions |
| 2.16 Income taxes |
| 2.17 Revenue from
operations |
| 2.18 Other income, net
|
| 2.19 Expenses |
| 2.20 Leases |
| 2.21 Basic and diluted
shares used in computing earnings per equity share |
| 2.22 Contingent
liabilities and commitments |
| 2.23 Related party
transactions |
| 2.24 Segment reporting
|
| 2.25 Function wise
classification of Condensed Consolidated Statement of Profit and Loss |
INDEPENDENT AUDITOR’S REPORT
TO THE BOARD OF DIRECTORS OF INFOSYS LIMITED
Report on the Audit of the Interim Condensed
Consolidated Financial
Statements
Opinion
We have audited the
accompanying interim condensed
consolidated financial statements of INFOSYS LIMITED (the “Company”), and its subsidiaries (the
Company and its subsidiaries
together referred to as the “Group”), which comprise the Condensed Consolidated Balance Sheet as at June
30, 2023, the Condensed
Consolidated Statement of Profit and Loss (including Other Comprehensive Income), the Condensed Consolidated
Statement of Changes in Equity
and the Condensed Consolidated Statement of Cash Flows for the three months ended on that date, and a summary of the
significant accounting
policies and other explanatory information (hereinafter referred to as the “interim condensed consolidated
financial statements”).
In our opinion and to the best
of our information
and according to the explanations given to us, the aforesaid interim condensed consolidated financial statements
give a true and fair
view in conformity with the Indian Accounting Standard 34 “Interim Financial Reporting” (“Ind AS
34”) prescribed
under section 133 of the Companies Act, 2013 (the “Act”), read with relevant rules issued thereunder and
other accounting
principles generally accepted in India, of the consolidated state of affairs of the Group as at June 30, 2023, and
their consolidated
profit, their consolidated total comprehensive income, their consolidated changes in equity and their consolidated
cash flows for the
three months ended on that date.
Basis for Opinion
We conducted our audit of the
interim condensed
consolidated financial statements in accordance with the Standards on Auditing (“SA”s) specified under
section 143 (10) of
the Act. Our responsibilities under those Standards are further described in the Auditor’s Responsibilities
for the Audit of the
Interim Condensed Consolidated Financial Statements section of our report. We are independent of the Group in
accordance with the Code
of Ethics issued by the Institute of Chartered Accountants of India (“ICAI”) together with the ethical
requirements that are
relevant to our audit of the interim condensed consolidated financial statements under the provisions of the Act and
the Rules made thereunder,
and we have fulfilled our other ethical responsibilities in accordance with these requirements and the ICAI’s
Code of Ethics. We
believe that the audit evidence obtained by us is sufficient and appropriate to provide a basis for our audit
opinion on the interim condensed
consolidated financial statements.
Responsibilities of
Management and Those
Charged with Governance for the Interim Condensed Consolidated Financial Statements
The Company’s Board of
Directors is responsible
for the preparation and presentation of these interim condensed consolidated financial statements that give a true
and fair view of the
consolidated financial position, consolidated financial performance, consolidated total comprehensive income,
consolidated changes in
equity and consolidated cash flows of the Group in accordance with Ind AS 34 and other accounting principles
generally accepted in India.
The respective Boards of Directors of the companies included in the Group are responsible for maintenance of the
adequate accounting records
in accordance with the provisions of the Act for safeguarding the assets of the Group and for preventing and
detecting frauds and other
irregularities; selection and application of appropriate accounting policies; making judgments and estimates that
are reasonable and prudent;
and design, implementation and maintenance of adequate internal financial controls, that were operating effectively
for ensuring the accuracy
and completeness of the accounting records, relevant to the preparation and presentation of the respective interim
financial statements
that give a true and fair view and are free from material misstatement, whether due to fraud or error which have
been used for the purpose
of preparation of the interim condensed consolidated financial statements by the Directors of the Company, as
aforesaid.
In preparing the interim
condensed consolidated
financial statements, the respective Boards of Directors of the companies included in the Group are responsible for
assessing the ability
of the respective entities to continue as a going concern, disclosing, as applicable, matters related to going
concern and using the going
concern basis of accounting unless the respective Boards of Directors either intend to liquidate their own
respective entities or to cease
operations, or have no realistic alternative but to do so.
The respective Boards of
Directors of the companies
included in the Group are also responsible for overseeing the financial reporting process of the Group.
Auditor’s
Responsibilities for the
Audit of the Interim Condensed Consolidated Financial Statements
Our objectives are to obtain
reasonable assurance
about whether the interim condensed consolidated financial statements as a whole are free from material
misstatement, whether due to fraud
or error, and to issue an auditor’s report that includes our opinion. Reasonable assurance is a high level of
assurance, but is
not a guarantee that an audit conducted in accordance with SAs will always detect a material misstatement when it
exists. Misstatements
can arise from fraud or error and are considered material if, individually or in the aggregate, they could
reasonably be expected to influence
the economic decisions of users taken on the basis of these interim condensed consolidated financial statements.
As part of an audit in
accordance with SAs, we
exercise professional judgment and maintain professional scepticism throughout the audit. We also:
|
·
|
Identify and assess the risks of material misstatement of the interim condensed
consolidated financial
statements, whether due to fraud or error, design and perform audit procedures responsive to those risks, and
obtain audit evidence that
is sufficient and appropriate to provide a basis for our opinion. The risk of not detecting a material
misstatement resulting from fraud
is higher than for one resulting from error, as fraud may involve collusion, forgery, intentional omissions,
misrepresentations, or the
override of internal control. |
|
·
|
Obtain an understanding of internal financial controls relevant to the audit in
order to design audit
procedures that are appropriate in the circumstances, but not for the purpose of expressing an opinion on
effectiveness of such controls. |
|
·
|
Evaluate the appropriateness of accounting policies used and the reasonableness of
accounting estimates
and related disclosures made by management. |
|
·
|
Conclude on the appropriateness of management’s use of the going concern
basis of accounting and,
based on the audit evidence obtained, whether a material uncertainty exists related to events or conditions that
may cast significant
doubt on the ability of the Group to continue as a going concern. If we conclude that a material uncertainty
exists, we are required to
draw attention in our auditor’s report to the related disclosures in the interim condensed consolidated
financial statements or,
if such disclosures are inadequate, to modify our opinion. Our conclusions are based on the audit evidence
obtained up to the date of
our auditor’s report. However, future events or conditions may cause the Group to cease to continue as a
going concern. |
|
·
|
Evaluate the overall presentation, structure and content of the interim condensed
consolidated financial
statements, including the disclosures, and whether the interim condensed consolidated financial statements
represent the underlying transactions
and events in a manner that achieves fair presentation. |
|
·
|
Obtain sufficient appropriate audit evidence regarding the financial information
of the entities within
the Group to express an opinion on the interim condensed consolidated financial statements. We are responsible
for the direction, supervision
and performance of the audit of financial statements of such entities included in the interim condensed
consolidated financial statements
of which we are independent auditors. |
Materiality is the magnitude of
misstatements in
the interim condensed consolidated financial statements that, individually or in aggregate, makes it probable that
the economic decisions
of a reasonably knowledgeable user of the interim condensed consolidated financial statements may be influenced. We
consider quantitative
materiality and qualitative factors in (i) planning the scope of our audit work and in evaluating the results of our
work; and (ii) to
evaluate the effect of any identified misstatements in the interim condensed consolidated financial statements.
We communicate with those
charged with governance
of the Company and such other entities included in the interim condensed consolidated financial statements of which
we are the independent
auditors regarding, among other matters, the planned scope and timing of the audit and significant audit findings
including any significant
deficiencies in internal control that we identify during our audit.
We also provide those charged
with governance with
a statement that we have complied with relevant ethical requirements regarding independence, and to communicate with
them all relationships
and other matters that may reasonably be thought to bear on our independence, and where applicable, related
safeguards.
|
Place: Bengaluru
Date: July 20, 2023
|
For DELOITTE HASKINS &
SELLS LLP
Chartered Accountants
(Firm’s Registration No.
117366W/W-100018)
Sanjiv V. Pilgaonkar
Partner
(Membership No.039826)
UDIN:23039826BGXSAM8580
|
INFOSYS LIMITED AND
SUBSIDIARIES
(In crore )
|
Condensed Consolidated Balance Sheets as at |
Note No. |
June 30, 2023 |
March 31, 2023 |
| ASSETS |
|
|
|
| Non-current assets |
|
|
|
| Property, plant and equipment |
2.2 |
12,939 |
13,346 |
| Right-of-use assets |
2.20 |
7,049 |
6,882 |
| Capital work-in-progress |
|
338 |
288 |
| Goodwill |
2.3 |
7,233 |
7,248 |
| Other intangible assets |
|
1,643 |
1,749 |
| Financial assets |
|
|
|
| Investments |
2.4 |
11,991 |
12,569 |
| Loans |
2.5 |
34 |
39 |
| Other financial assets |
2.6 |
2,230 |
2,798 |
| Deferred tax assets (net) |
|
1,025 |
1,245 |
| Income tax assets (net) |
|
6,922 |
6,453 |
| Other non-current assets |
2.10 |
2,444 |
2,318 |
| Total non-current assets |
|
53,848 |
54,935 |
| Current assets |
|
|
|
| Financial assets |
|
|
|
| Investments |
2.4 |
5,536 |
6,909 |
| Trade receivables |
2.7 |
26,183 |
25,424 |
| Cash and cash equivalents |
2.8 |
12,310 |
12,173 |
|
Earmarked bank balance for dividend |
2.9
|
7,262 |
– |
|
Loans |
2.5
|
267 |
289 |
| Other financial assets |
2.6 |
11,773 |
11,604 |
| Income tax assets (net) |
|
11 |
6 |
| Other current assets |
2.10 |
14,132 |
14,476 |
| Total current assets |
|
77,474 |
70,881 |
| Total assets |
|
131,322 |
125,816 |
| EQUITY AND LIABILITIES |
|
|
|
| Equity |
|
|
|
| Equity share capital |
2.12 |
2,070 |
2,069 |
| Other equity |
|
72,373 |
73,338 |
| Total equity attributable to equity holders of the
Company |
|
74,443 |
75,407 |
| Non-controlling interests |
|
385 |
388 |
| Total equity |
|
74,828 |
75,795 |
| Liabilities |
|
|
|
| Non-current liabilities |
|
|
|
| Financial Liabilities |
|
|
|
| Lease liabilities |
2.20 |
6,659 |
7,057 |
| Other financial liabilities |
2.13 |
1,866 |
2,058 |
| Deferred tax liabilities (net) |
|
1,118 |
1,220 |
| Other non-current liabilities |
2.14 |
356 |
500 |
| Total non-current liabilities |
|
9,999 |
10,835 |
| Current liabilities |
|
|
|
| Financial Liabilities |
|
|
|
| Lease liabilities |
2.20 |
1,824 |
1,242 |
| Trade payables |
|
3,759 |
3,865 |
| Other financial liabilities |
2.13 |
23,271 |
18,558 |
| Other current liabilities |
2.14 |
11,322 |
10,830 |
| Provisions |
2.15 |
1,538 |
1,307 |
| Income tax liabilities (net) |
|
4,781 |
3,384 |
| Total current liabilities |
|
46,495 |
39,186 |
| Total equity and liabilities
|
|
131,322 |
125,816 |
The accompanying notes form an
integral part of the
interim condensed consolidated financial statements
As per our report of even date
attached
for Deloitte Haskins
& Sells LLP
|
for and on behalf of the Board of Directors of
Infosys Limited
|
| Chartered
Accountants |
|
|
|
|
Firm’s Registration No :
|
|
|
|
|
117366W/W-100018
|
|
|
|
| |
|
|
|
| |
|
|
|
|
Sanjiv V. Pilgaonkar
Partner
Membership No. 039826
|
Nandan M. Nilekani
|
Salil Parekh
|
Bobby Parikh
|
|
Chairman
|
Chief Executive Officer
|
Director
|
| |
and Managing Director
|
|
| |
|
|
|
Nilanjan Roy
|
Jayesh Sanghrajka
|
A.G.S. Manikantha
|
|
Chief Financial Officer
|
Executive Vice President and
Deputy Chief Financial Officer
|
Company Secretary
|
|
Bengaluru
July 20, 2023
|
|
|
|
INFOSYS LIMITED AND SUBSIDIARIES
(In crore, except equity share and per equity
share data)
| Condensed Consolidated Statement
of Profit and Loss for the |
Note
No. |
Three months ended June 30, |
| |
|
2023
|
2022
|
| Revenue from operations |
2.17 |
37,933 |
34,470 |
| Other income, net |
2.18 |
561 |
676 |
| Total income |
|
38,494 |
35,146 |
| Expenses |
|
|
|
| Employee benefit expenses |
2.19 |
20,781 |
18,337 |
| Cost of technical sub-contractors |
|
3,124 |
3,909 |
| Travel expenses |
|
462 |
376 |
| Cost of software packages and others |
2.19 |
2,720 |
2,420 |
| Communication expenses |
|
182 |
170 |
| Consultancy and professional charges |
|
346 |
456 |
| Depreciation and amortization expenses |
|
1,173 |
950 |
| Finance cost |
|
90 |
56 |
| Other expenses |
2.19 |
1,254 |
938 |
| Total expenses |
|
30,132 |
27,612 |
| Profit before tax |
|
8,362 |
7,534 |
| Tax expense: |
|
|
|
| Current tax |
2.16 |
2,307 |
2,350 |
| Deferred tax |
2.16 |
110 |
(178) |
| Profit for the period |
|
5,945 |
5,362 |
| Other comprehensive income |
|
|
|
| Items that will not be reclassified subsequently to profit or
loss |
|
|
|
| Remeasurement of the net defined benefit liability/asset, net
|
|
87 |
(86) |
| Equity instruments through other comprehensive income, net |
|
1 |
3 |
| |
|
88 |
(83) |
| Items that will be reclassified subsequently to profit or
loss |
|
|
|
| Fair value changes on derivatives designated as cash flow hedge,
net |
|
6 |
26 |
| Exchange differences on translation of foreign operations |
|
15 |
53 |
| Fair value changes on investments, net |
|
75 |
(372) |
| |
|
96 |
(293) |
| Total other comprehensive income /(loss), net of tax
|
|
184 |
(376) |
| Total comprehensive income for the period |
|
6,129 |
4,986 |
| Profit attributable to: |
|
|
|
| Owners of the Company |
|
5,945 |
5,360 |
| Non-controlling interests |
|
– |
2 |
| |
|
5,945 |
5,362 |
| Total comprehensive income attributable to: |
|
|
|
| Owners of the Company |
|
6,132 |
4,986 |
| Non-controlling interests |
|
(3) |
– |
| |
|
6,129 |
4,986 |
| Earnings per equity share |
|
|
|
| Equity shares of par value 5/- each |
|
|
|
| Basic () |
|
14.37 |
12.78 |
| Diluted () |
|
14.35 |
12.76 |
| Weighted average equity shares used in computing earnings per
equity share |
|
|
|
| Basic (in shares) |
2.21 |
4,137,234,750 |
4,193,747,653 |
| Diluted
(in shares) |
2.21
|
4,142,207,951 |
4,199,491,985 |
The accompanying notes form an
integral part of the
interim condensed consolidated financial statements
As per our report of even
date attached
for Deloitte Haskins
& Sells LLP
|
for and on behalf of the Board of Directors of
Infosys Limited
|
| Chartered
Accountants |
|
|
|
|
Firm’s Registration No :
|
|
|
|
|
117366W/W-100018
|
|
|
|
| |
|
|
|
| |
|
|
|
|
Sanjiv V. Pilgaonkar
Partner
Membership No. 039826
|
Nandan M. Nilekani
|
Salil Parekh
|
Bobby Parikh
|
|
Chairman
|
Chief Executive Officer
|
Director
|
| |
and Managing Director
|
|
| |
|
|
|
Nilanjan Roy
|
Jayesh Sanghrajka
|
A.G.S. Manikantha
|
|
Chief Financial Officer
|
Executive Vice President and
Deputy Chief Financial Officer
|
Company Secretary
|
|
Bengaluru
July 20, 2023
|
|
|
|
INFOSYS LIMITED AND SUBSIDIARIES
Condensed Consolidated Statement of
Changes in Equity
(In crore)
| Particulars |
Equity Share capital(1) |
OTHER EQUITY
|
Total equity attributable to equity holders of the Company |
Non-controlling interest |
Total equity |
| |
|
Reserves & Surplus |
Other
comprehensive income |
|
|
|
| |
|
Capital reserve |
Capital redemption reserve |
Securities Premium |
Retained earnings |
General reserve |
Share Options Outstanding Account |
Special Economic Zone Re-investment reserve (2) |
Other reserves (3)
|
Equity instruments through other comprehensive income |
Exchange differences on translating the financial statements of a foreign operation |
Effective portion of Cash Flow Hedges |
Other items of other comprehensive income / (loss) |
|
|
|
| Balance as at April 1,
2022 |
2,098 |
54 |
139 |
200 |
61,313 |
1,061 |
606 |
8,339 |
16 |
254 |
1,560 |
2 |
(292) |
75,350 |
386 |
75,736 |
| Impact on adoption of amendment to Ind AS 37# |
– |
– |
– |
– |
(19) |
– |
– |
– |
– |
– |
– |
– |
– |
(19) |
– |
(19) |
| |
2,098 |
54 |
139 |
200 |
61,294 |
1,061 |
606 |
8,339 |
16 |
254 |
1,560 |
2 |
(292) |
75,331 |
386 |
75,717 |
| Changes in equity for the three months ended June 30,
2022 |
|
|
|
|
|
|
|
|
|
|
|
|
|
|
|
|
| Profit for the period |
– |
– |
– |
– |
5,360 |
– |
– |
– |
– |
– |
– |
– |
– |
5,360 |
2 |
5,362 |
| Remeasurement of the net defined benefit liability/asset, net*
|
– |
– |
– |
– |
– |
– |
– |
– |
– |
– |
– |
– |
(86) |
(86) |
– |
(86) |
| Equity instruments through other comprehensive income, net* |
– |
– |
– |
– |
– |
– |
– |
– |
– |
3 |
– |
– |
– |
3 |
– |
3 |
| Fair value changes on derivatives designated as cash flow hedge,
net* |
– |
– |
– |
– |
– |
– |
– |
– |
– |
– |
– |
26 |
– |
26 |
– |
26 |
| Exchange differences on translation of foreign operations |
– |
– |
– |
– |
– |
– |
– |
– |
– |
– |
55 |
– |
– |
55 |
(2) |
53 |
| Fair value changes on investments, net* |
– |
– |
– |
– |
– |
– |
– |
– |
– |
– |
– |
– |
(372) |
(372) |
– |
(372) |
| Total Comprehensive income for the period |
– |
– |
– |
– |
5,360
|
– |
– |
– |
– |
3 |
55 |
26 |
(458) |
4,986
|
– |
4,986
|
| Shares issued on exercise of employee stock options (Refer to
Note 2.12) |
– |
– |
– |
2 |
– |
– |
– |
– |
– |
– |
– |
– |
– |
2 |
– |
2 |
| Employee stock compensation expense (Refer to Note 2.12)
|
– |
– |
– |
– |
– |
– |
134 |
– |
– |
– |
– |
– |
– |
134 |
– |
134 |
| Transfer on account of options not exercised |
– |
– |
– |
– |
– |
1 |
(1) |
– |
– |
– |
– |
– |
– |
– |
– |
– |
| Transferred on account of exercise of stock options |
– |
– |
– |
135 |
– |
– |
(135) |
– |
– |
– |
– |
– |
– |
– |
– |
– |
| Income tax benefit arising on exercise of stock options |
– |
– |
– |
– |
– |
– |
14 |
– |
– |
– |
– |
– |
– |
14 |
– |
14 |
| Dividends (1) |
– |
– |
– |
– |
(6,711) |
– |
– |
– |
– |
– |
– |
– |
– |
(6,711) |
– |
(6,711) |
| Dividends paid to non controlling interest of subsidiary |
– |
– |
– |
– |
– |
– |
– |
– |
– |
– |
– |
– |
– |
– |
(21) |
(21) |
| Transferred from Special
Economic Zone Re-investment reserve on utilization |
– |
– |
– |
– |
296 |
– |
– |
(296) |
– |
– |
– |
– |
– |
– |
– |
– |
| Balance as at June 30,
2022 |
2,098 |
54 |
139 |
337 |
60,239 |
1,062 |
618 |
8,043 |
16 |
257 |
1,615 |
28 |
(750) |
73,756 |
365 |
74,121 |
(In crore)
| Particulars |
Equity Share capital(1) |
OTHER EQUITY |
Total equity attributable to equity holders of the Company |
Non-controlling interest |
Total equity |
| |
|
Reserves & Surplus |
Other comprehensive income |
|
|
|
| |
|
Capital reserve |
Capital redemption reserve |
Securities Premium |
Retained earnings |
General reserve |
Share Options Outstanding Account
|
Special Economic Zone Re-investment
reserve (2) |
Other reserves (3) |
Equity instruments through other
comprehensive income |
Exchange differences on translating the
financial statements of a foreign operation |
Effective portion of Cash Flow
Hedges |
Other items of other comprehensive
income / (loss) |
|
|
|
| Balance as at April 1,
2023 |
2,069 |
54 |
169 |
166 |
58,957 |
1,054 |
878 |
10,014 |
19 |
247 |
2,325 |
(5) |
(540) |
75,407 |
388 |
75,795 |
| Changes in equity for the three months ended June 30,
2023 |
|
|
|
|
|
|
|
|
|
|
|
|
|
|
|
|
| Profit for the period |
– |
– |
– |
– |
5,945 |
– |
– |
– |
– |
– |
– |
– |
– |
5,945 |
– |
5,945 |
| Remeasurement of the net defined benefit liability/asset, net*
|
– |
– |
– |
– |
– |
– |
– |
– |
– |
– |
– |
– |
87 |
87 |
– |
87 |
| Equity instruments through other comprehensive income, net* |
– |
– |
– |
– |
– |
– |
– |
– |
– |
1 |
– |
– |
– |
1 |
– |
1 |
| Fair value changes on derivatives designated as cash flow hedge,
net* |
– |
– |
– |
– |
– |
– |
– |
– |
– |
– |
– |
6 |
– |
6 |
– |
6 |
| Exchange differences on translation of foreign operations |
– |
– |
– |
– |
– |
– |
– |
– |
– |
– |
18 |
– |
– |
18 |
(3) |
15 |
| Fair value changes on investments, net* |
– |
– |
– |
– |
– |
– |
– |
– |
– |
– |
– |
– |
75 |
75 |
– |
75 |
| Total Comprehensive income for the period |
– |
– |
– |
– |
5,945
|
– |
– |
– |
– |
1 |
18 |
6 |
162 |
6,132
|
(3) |
6,129
|
| Shares issued on exercise of employee stock options (Refer to
Note 2.12) |
1 |
– |
– |
1 |
– |
– |
– |
– |
– |
– |
– |
– |
– |
2 |
– |
2 |
| Employee stock compensation expense (Refer to Note 2.12)
|
– |
– |
– |
– |
– |
– |
144 |
– |
– |
– |
– |
– |
– |
144 |
– |
144 |
| Transferred on account of exercise of stock options |
– |
– |
– |
274 |
– |
– |
(274) |
– |
– |
– |
– |
– |
– |
– |
– |
– |
| Transferred on account of options not exercised |
– |
– |
– |
– |
– |
6 |
(6) |
– |
– |
– |
– |
– |
– |
– |
– |
– |
| Dividends (1) |
– |
– |
– |
– |
(7,242) |
– |
– |
– |
– |
– |
– |
– |
– |
(7,242) |
– |
(7,242) |
| Transferred to Special Economic Zone Re-investment reserve |
– |
– |
– |
– |
(760) |
– |
– |
760 |
– |
– |
– |
– |
– |
– |
– |
– |
| Transferred from Special
Economic Zone Re-investment reserve on utilization |
– |
– |
– |
– |
202 |
– |
– |
(202) |
– |
– |
– |
– |
– |
– |
– |
– |
| Balance as at June 30,
2023 |
2,070 |
54 |
169 |
441 |
57,102 |
1,060 |
742 |
10,572 |
19 |
248 |
2,343 |
1 |
(378) |
74,443 |
385 |
74,828 |
| # |
|
Impact on account of adoption of amendment to Ind AS 37 Provisions, Contingent
Liabilities
and Contingents Assets |
| (1) |
|
Net of treasury shares |
| (2) |
|
The Special Economic Zone Re-investment Reserve has been created out of the
profit of eligible
SEZ units in terms of the provisions of Sec 10AA(1)(ii) of Income Tax Act, 1961. The reserve should be
utilized by the Group for acquiring
new plant and machinery for the purpose of its business in the terms of the Sec 10AA(2) of the Income Tax Act,
1961. |
| (3) |
|
Under the Swiss Code of Obligation, few subsidiaries of Infosys Lodestone are
required to appropriate
a certain percentage of the annual profit to legal reserve which may be used only to cover losses or for
measures designed to sustain
the Company through difficult times, to prevent unemployment or to mitigate its consequences. |
The accompanying notes form an
integral part of
the interim condensed consolidated financial statements
As per our report of even
date attached
|
for Deloitte Haskins
& Sells LLP
|
for and on behalf of the Board of Directors of
Infosys Limited
|
| Chartered
Accountants |
|
|
|
|
Firm’s Registration No :
|
|
|
|
|
117366W/W-100018
|
|
|
|
| |
|
|
|
| |
|
|
|
|
Sanjiv V. Pilgaonkar
Partner
Membership No. 039826
|
Nandan M. Nilekani
|
Salil Parekh
|
Bobby Parikh
|
|
Chairman
|
Chief Executive Officer
|
Director
|
| |
and Managing Director
|
|
| |
|
|
|
Nilanjan Roy
|
Jayesh Sanghrajka
|
A.G.S. Manikantha
|
|
Chief Financial Officer
|
Executive Vice President and
Deputy Chief Financial Officer
|
Company Secretary
|
|
Bengaluru
July 20, 2023
|
|
|
|
INFOSYS LIMITED AND SUBSIDIARIES
Condensed Consolidated Statement of
Cash Flows
Accounting policy
Cash flows are reported using the
indirect method,
whereby profit for the period is adjusted for the effects of transactions of a non-cash nature, any deferrals or
accruals of past or future
operating cash receipts or payments and item of income or expenses associated with investing or financing cash
flows. The cash flows from
operating, investing and financing activities of the Group are segregated. The Group considers all highly liquid
investments that are
readily convertible to known amounts of cash to be cash equivalents.
(In crore)
| Particulars |
Note No. |
Three months ended June 30, |
| |
|
2023 |
2022 |
| Cash flow from operating activities |
|
|
|
| Profit for the period |
|
5,945 |
5,362 |
| Adjustments to reconcile net profit to net cash provided by
operating activities: |
|
|
|
| Income tax expense |
2.16 |
2,417 |
2,172 |
| Depreciation and amortization |
|
1,173 |
950 |
| Interest and dividend income |
|
(517) |
(485) |
| Finance cost |
|
90 |
56 |
| Impairment loss recognized / (reversed) under expected credit
loss model |
|
91 |
44 |
| Exchange differences on translation of assets and liabilities,
net |
|
(20) |
79 |
| Stock compensation expense |
|
146 |
132 |
| Other adjustments |
|
555 |
126 |
| Changes in assets and liabilities |
|
|
|
| Trade receivables and unbilled revenue |
|
(101) |
(2,520) |
| Loans, other financial assets and other assets |
|
(311) |
(1,362) |
| Trade payables |
|
(106) |
(184) |
| Other financial liabilities, other liabilities and provisions
|
|
(1,822) |
2,466 |
| Cash generated from operations |
|
7,540 |
6,836 |
| Income taxes paid |
|
(1,379) |
(1,325) |
| Net cash generated by operating activities |
|
6,161 |
5,511 |
| Cash flows from investing activities |
|
|
|
| Expenditure on property, plant and equipment and intangibles
|
|
(807) |
(692) |
| Deposits placed with corporation |
|
(444) |
(216) |
| Redemption of deposits placed with Corporation |
|
252 |
22 |
| Interest and dividend received |
|
670 |
561 |
| Payment towards acquisition of business, net of cash acquired
|
2.1 |
– |
(230) |
| Payment of contingent consideration pertaining to acquisition of
business |
|
– |
(60) |
| Other receipts |
|
126 |
22 |
| Payments to acquire Investments |
|
|
|
| Liquid mutual fund units |
|
(17,680) |
(20,745) |
| Target maturity fund |
|
– |
– |
| Certificates of deposit |
|
(1,285) |
(2,931) |
| Commercial Paper |
|
(1,558) |
(283) |
| Non-convertible debentures |
|
(104) |
(125) |
| Government securities |
|
– |
(1,420) |
| Others |
|
(3) |
(10) |
| Proceeds on sale of Investments |
|
|
|
| Liquid mutual funds units |
|
17,304 |
21,097 |
| Certificates of deposit |
|
3,974 |
2,188 |
| Commercial Paper |
|
824 |
– |
| Non-convertible debentures |
|
375 |
295 |
| Government securities |
|
226 |
636 |
| Net cash generated / (used in) from investing activities
|
|
1,870 |
(1,891) |
| Cash flows from financing activities |
|
|
|
| Payment of lease liabilities |
|
(439) |
(250) |
| Payment of dividends |
|
(1) |
(6,712) |
| Payment of dividend to non-controlling interest of subsidiary
|
|
– |
(21) |
| Shares issued on exercise of employee stock options |
|
2 |
2 |
| Other receipts |
|
– |
72 |
| Other payments |
|
(209) |
(112) |
| Net cash used in financing activities |
|
(647) |
(7,021) |
| Net increase / (decrease) in cash and cash equivalents |
|
7,384 |
(3,401) |
| Effect of exchange rate changes on cash and cash equivalents
|
|
15 |
(89) |
| Cash and cash equivalents at the beginning of the period
|
2.8 |
12,173 |
17,472 |
| Cash and cash equivalents at the end of the period |
2.8 |
19,572 |
13,982 |
| Supplementary information: |
|
|
|
| Restricted cash balance |
2.8 |
381 |
422 |
| Closing cash and cash equivalents as per consolidated statement
of cash flows |
|
19,572 |
13,982 |
| Less: Earmarked bank balance for dividend |
2.9 |
7,262 |
– |
| Closing cash and cash
equivalents as per Consolidated Balance Sheet |
2.8 |
12,310 |
13,982 |
The accompanying notes form an
integral part of the
interim condensed consolidated financial statements
As per our report of even date
attached
for Deloitte Haskins
& Sells LLP
|
for and on behalf of the Board of Directors of
Infosys Limited
|
| Chartered
Accountants |
|
|
|
|
Firm’s Registration No :
|
|
|
|
|
117366W/W-100018
|
|
|
|
| |
|
|
|
| |
|
|
|
|
Sanjiv V. Pilgaonkar
Partner
Membership No. 039826
|
Nandan M. Nilekani
|
Salil Parekh
|
Bobby Parikh
|
|
Chairman
|
Chief Executive Officer
|
Director
|
| |
and Managing Director
|
|
| |
|
|
|
Nilanjan Roy
|
Jayesh Sanghrajka
|
A.G.S. Manikantha
|
|
Chief Financial Officer
|
Executive Vice President and
Deputy Chief Financial Officer
|
Company Secretary
|
|
Bengaluru
July 20, 2023
|
|
|
|
INFOSYS LIMITED AND SUBSIDIARIES
Overview and notes to the
Interim Condensed Consolidated
Financial Statements
1. Overview
1.1 Company overview
Infosys Limited ('the Company' or
Infosys) provides
consulting, technology, outsourcing and next-generation digital services, to enable clients to execute strategies
for their digital transformation.
Infosys strategic objective is to build a sustainable organization that remains relevant to the agenda of clients,
while creating growth
opportunities for employees and generating profitable returns for investors. Infosys strategy is to be a navigator
for our clients as
they ideate, plan and execute on their journey to a digital future.
Infosys together with its
subsidiaries and controlled
trusts is hereinafter referred to as "the Group".
The Company is a public limited
company incorporated
and domiciled in India and has its registered office at Electronics city, Hosur Road, Bengaluru 560100, Karnataka,
India. The Company
has its primary listings on the BSE Ltd. and National Stock Exchange of India Limited. The Company’s American
Depositary Shares
(ADS) representing equity shares are listed on the New York Stock Exchange (NYSE).
The Group's interim condensed
consolidated financial
statements are approved for issue by the Company's Board of Directors on July 20, 2023.
1.2 Basis of preparation of
financial statements
These interim condensed
consolidated financial statements
are prepared in compliance with Indian Accounting Standard (Ind AS) 34 Interim Financial Reporting, under the
historical cost convention
on accrual basis except for certain financial instruments which are measured at fair values, the provisions of the
Companies Act, 2013
('the Act') and guidelines issued by the Securities and Exchange Board of India (SEBI). Accordingly, these interim
condensed consolidated
financial statements do not include all the information required for a complete set of financial statements. These
interim condensed consolidated
financial statements should be read in conjunction with the consolidated financial statements and related notes
included in the Company’s
Annual Report for the year ended March 31, 2023. The Ind AS are prescribed under Section 133 of the Act read with
Rule 3 of the Companies
(Indian Accounting Standards) Rules, 2015 and relevant amendment rules issued thereafter.
Accounting policies have been
consistently applied
except where a newly issued accounting standard is initially adopted or a revision to an existing accounting
standard requires a change
in the accounting policy hitherto in use. The material accounting policy information used in preparation of the
audited condensed consolidated
interim financial statements have been discussed in the respective notes.
1.3 Basis of consolidation
Infosys consolidates entities which
it owns or controls.
The interim condensed consolidated financial statements comprise the financial statements of the Company, its
controlled trusts and its
subsidiaries. Control exists when the parent has power over the entity, is exposed, or has rights to variable
returns from its involvement
with the entity and has the ability to affect those returns by using its power over the entity. Power is
demonstrated through existing
rights that give the ability to direct relevant activities, those which significantly affect the entity's returns.
Subsidiaries are consolidated
from the date control commences until the date control ceases.
The financial statements of the
Group companies are
consolidated on a line-by-line basis and intra-group balances and transactions including unrealized gain / loss from
such transactions
are eliminated upon consolidation. These financial statements are prepared by applying uniform accounting policies
in use at the Group.
Non-controlling interests which represent part of the net profit or loss and net assets of subsidiaries that are
not, directly or indirectly,
owned or controlled by the Company, are excluded.
1.4 Use of estimates and
judgments
The preparation of the interim
condensed consolidated
financial statements in conformity with Ind AS requires the Management to make estimates, judgments and assumptions.
These estimates,
judgments and assumptions affect the application of accounting policies and the reported amounts of assets and
liabilities, the disclosures
of contingent assets and liabilities at the date of the interim condensed consolidated financial statements and
reported amounts of revenues
and expenses during the period. The application of accounting policies that require critical accounting estimates
involving complex and
subjective judgments and the use of assumptions in these financial statements have been disclosed in Note no.
1.5. Accounting estimates
could change from period to period. Actual results could differ from those estimates. Appropriate changes in
estimates are made as Management
becomes aware of changes in circumstances surrounding the estimates. Changes in estimates and judgements are
reflected in the interim
condensed consolidated financial statements in the period in which changes are made and, if material, their effects
are disclosed in the
notes to the interim condensed consolidated financial statements.
1.5 Critical accounting
estimates and judgments
a. Revenue recognition
The Group’s contracts with
customers include
promises to transfer multiple products and services to a customer. Revenues from customer contracts are considered
for recognition and
measurement when the contract has been approved, in writing, by the parties to the contract, the parties to contract
are committed to
perform their respective obligations under the contract, and the contract is legally enforceable. The Group assesses
the services promised
in a contract and identifies distinct performance obligations in the contract. Identification of distinct
performance obligations to determine
the deliverables and the ability of the customer to benefit independently from such deliverables, and allocation of
transaction price
to these distinct performance obligations involves significant judgment.
Fixed price maintenance revenue is
recognized ratably
on a straight-line basis when services are performed through an indefinite number of repetitive acts over a
specified period. Revenue
from fixed price maintenance contract is recognized ratably using a percentage of completion method when the pattern
of benefits from
the services rendered to the customer and the Group’s costs to fulfil the contract is not even through the
period of the contract
because the services are generally discrete in nature and not repetitive. The use of method to recognize the
maintenance revenues requires
judgment and is based on the promises in the contract and nature of the deliverables.
The Group uses the
percentage-of-completion method
in accounting for other fixed-price contracts. Use of the percentage-of-completion method requires the Group to
determine the actual efforts
or costs expended to date as a proportion of the estimated total efforts or costs to be incurred. Efforts or costs
expended have been
used to measure progress towards completion as there is a direct relationship between input and productivity. The
estimation of total
efforts or costs involves significant judgment and is assessed throughout the period of the contract to reflect any
changes based on the
latest available information.
Contracts with customers includes
subcontractor services
or third-party vendor equipment or software in certain integrated services arrangements. In these types of
arrangements, revenue from
sales of third-party vendor products or services is recorded net of costs when the Group is acting as an agent
between the customer and
the vendor, and gross when the Group is the principal for the transaction. In doing so, the Group first evaluates
whether it controls
the good or service before it is transferred to the customer. The Group considers whether it has the primary
obligation to fulfil the
contract, inventory risk, pricing discretion and other factors to determine whether it controls the goods or service
and therefore, is
acting as a principal or an agent.
Provisions for estimated losses, if
any, on incomplete
contracts are recorded in the period in which such losses become probable based on the estimated efforts or costs to
complete the contract.
b. Income taxes
The Group's two major tax
jurisdictions are India and
the United States, though the Company also files tax returns in other overseas jurisdictions.
Significant judgments are involved
in determining the
provision for income taxes, including amount expected to be paid / recovered for uncertain tax positions.
In assessing the realizability of
deferred income tax
assets, the Management considers whether some portion or all of the deferred income tax assets will not be realized.
The ultimate realization
of deferred income tax assets is dependent upon the generation of future taxable income during the periods in which
the temporary differences
become deductible. Management considers the scheduled reversals of deferred income tax liabilities, projected future
taxable income and
tax planning strategies in making this assessment. Based on the level of historical taxable income and projections
for future taxable
income over the periods in which the deferred income tax assets are deductible, the Management believes that the
Group will realize the
benefits of those deductible differences. The amount of the deferred income tax assets considered realizable,
however, could be reduced
in the near term if estimates of future taxable income during the carry forward period are reduced (Refer to
Note 2.16).
c. Business combinations and
intangible assets
Business combinations are accounted
for using Ind AS
103, Business Combinations. Ind AS 103 requires the identifiable intangible assets and contingent consideration to
be fair valued in order
to ascertain the fair value of identifiable assets, liabilities and contingent liabilities of the acquiree. These
valuations are conducted
by external valuation experts. Estimates are required to be made in determining the value of contingent
consideration, value of option
arrangements and intangible assets. These measurements are based on information available at the acquisition date
and are based on expectations
and assumptions that have been deemed reasonable by the Management (Refer to Note 2.1).
d. Property, plant and equipment
Property, plant and equipment
represent a significant
proportion of the asset base of the Group. The charge in respect of periodic depreciation is derived after
determining an estimate of
an asset’s expected useful life and the expected residual value at the end of its life. The useful lives and
residual values of
Group's assets are determined by the Management at the time the asset is acquired and reviewed periodically,
including at each financial
year end. The lives are based on historical experience with similar assets as well as anticipation of future events,
which may impact
their life, such as changes in technology (Refer to Note 2.2).
e. Impairment of Goodwill
Goodwill is tested for impairment
on an annual basis
and whenever there is an indication that the recoverable amount of a cash generating unit (CGUs) is less than its
carrying amount. For
the impairment test, goodwill is allocated to the CGU or groups of CGUs which benefit from the synergies of the
acquisition and which
represent the lowest level at which goodwill is monitored for internal management purposes.
The recoverable amount of CGUs is
determined based
on higher of value-in-use and fair value less cost to sell. Key assumptions in the cash flow projections are
prepared based on current
economic conditions and comprises estimated long term growth rates, weighted average cost of capital and estimated
operating margins (Refer
to Note 2.3.1).
2.
Notes to the Interim Condensed Consolidated Financial Statements
2.1 BUSINESS COMBINATIONS
Accounting policy
Business combinations have been
accounted for using
the acquisition method under the provisions of Ind AS 103, Business Combinations.
The purchase price in an
acquisition is measured at
the fair value of the assets transferred, equity instruments issued and liabilities incurred or assumed at the date
of acquisition, which
is the date on which control is transferred to the Group. The purchase price also includes the fair value of any
contingent consideration.
Identifiable assets acquired and liabilities and contingent liabilities assumed in a business combination are
measured initially at their
fair value on the date of acquisition. Contingent consideration is remeasured at fair value at each reporting date
and changes in the
fair value of the contingent consideration are recognized in the Consolidated Statement of Profit and Loss.
The interest of non-controlling
shareholders is initially
measured either at fair value or at the non-controlling interests’ proportionate share of the acquiree’s
identifiable net
assets. The choice of measurement basis is made on an acquisition-by-acquisition basis. Subsequent to acquisition,
the carrying amount
of non-controlling interests is the amount of those interests at initial recognition plus the non-controlling
interests’ share of
subsequent changes in equity of subsidiaries.
Business combinations between
entities under common
control is accounted for at carrying value of the assets acquired and liabilities assumed in the Group's
consolidated financial statements.
The payments related to options
issued by the Group
over the non-controlling interests in its subsidiaries are accounted as financial liabilities and initially
recognized at the estimated
present value of gross obligations. Such options are subsequently measured at fair value in order to reflect the
amount payable under
the option at the date at which it becomes exercisable. In the event that the option expires unexercised, the
liability is derecognized.
Transaction costs that the Group
incurs in connection
with a business combination such as finder’s fees, legal fees, due diligence fees, and other professional and
consulting fees are
expensed as incurred.
2.2 PROPERTY, PLANT AND
EQUIPMENT
Accounting policy
Property, plant and equipment are
stated at cost, less
accumulated depreciation and impairment, if any. Costs directly attributable to acquisition are capitalized until
the property, plant
and equipment are ready for use, as intended by the Management. The charge in respect of periodic depreciation is
derived at after determining
an estimate of an asset’s expected useful life and the expected residual value at the end of its life. The
Group depreciates property,
plant and equipment over their estimated useful lives using the straight-line method. The estimated useful lives of
assets are as follows:
| Buildings (1) |
22-25 years |
| Plant and machinery (1)(2) |
5 years |
| Office equipment |
5 years |
| Computer equipment (1) |
3-5 years |
| Furniture and fixtures (1) |
5 years |
| Vehicles(1) |
5 years |
| Leasehold improvements |
Lower of useful life of the
asset or lease term |
| (1) |
|
Based on technical evaluation, the Management believes that the useful lives as
given
above best represent the period over which the Management expects to use these assets. Hence, the useful lives
for these assets is different
from the useful lives as prescribed under Part C of Schedule II of the Companies Act 2013 |
| (2) |
|
Includes Solar plant with a useful life of 25 years |
Depreciation methods, useful lives
and residual values
are reviewed periodically, including at each financial year end. The useful lives are based on historical experience
with similar assets
as well as anticipation of future events, which may impact their life, such as changes in technology.
Advances paid towards the
acquisition of property,
plant and equipment outstanding at each Balance Sheet date is classified as capital advances under other non-current
assets and the cost
of assets not ready to use before such date are disclosed under ‘Capital work-in-progress’. Subsequent
expenditures relating
to property, plant and equipment is capitalized only when it is probable that future economic benefits associated
with these will flow
to the Group and the cost of the item can be measured reliably. The cost and related accumulated depreciation are
eliminated from the
financial statements upon sale or retirement of the asset.
Impairment
Property, plant and equipment are
evaluated for recoverability
whenever events or changes in circumstances indicate that their carrying amounts may not be recoverable. For the
purpose of impairment
testing, the recoverable amount (i.e. the higher of the fair value less cost to sell and the value-in-use) is
determined on an individual
asset basis unless the asset does not generate cash flows that are largely independent of those from other assets.
In such cases, the
recoverable amount is determined for the Cash Generating Unit (CGU) to which the asset belongs.
If such assets are considered to be
impaired, the impairment
to be recognized in the Consolidated Statement of Profit and Loss is measured by the amount by which the carrying
value of the assets
exceeds the estimated recoverable amount of the asset. An impairment loss is reversed in the Consolidated Statement
of Profit and Loss
if there has been a change in the estimates used to determine the recoverable amount. The carrying amount of the
asset is increased to
its revised recoverable amount, provided that this amount does not exceed the carrying amount that would have been
determined (net of
any accumulated depreciation) had no impairment loss been recognized for the asset in prior years.
The changes in the carrying value
of property, plant
and equipment for the three months ended June 30, 2023 are as follows:
(In
crore)
|
Particulars |
Land -
Freehold |
Buildings
(1) |
Plant
and machinery |
Office
Equipment |
Computer
equipment |
Furniture
and fixtures |
Leasehold Improvements |
Vehicles |
Total
|
| Gross carrying value as at April 1, 2023 |
1,431 |
11,562 |
3,302 |
1,482 |
8,519 |
2,303 |
1,445 |
45 |
30,089 |
| Additions |
– |
5 |
22 |
26 |
219 |
28 |
27 |
– |
327 |
| Deletions* |
– |
– |
(27) |
(22) |
(266) |
(24) |
(7) |
– |
(346) |
| Translation difference |
– |
(53) |
(4) |
(2) |
(1) |
– |
(8) |
– |
(68) |
| Gross carrying value as at
June 30, 2023 |
1,431 |
11,514 |
3,293 |
1,484 |
8,471 |
2,307 |
1,457 |
45 |
30,002 |
| Accumulated depreciation as at April 1, 2023 |
– |
(4,535) |
(2,437) |
(1,198) |
(5,826) |
(1,675) |
(1,032) |
(40) |
(16,743) |
| Depreciation |
– |
(109) |
(66) |
(33) |
(362) |
(65) |
(53) |
(1) |
(689) |
| Accumulated depreciation on deletions* |
– |
– |
27 |
22 |
265 |
24 |
5 |
– |
343 |
| Translation difference |
– |
13 |
4 |
1 |
1 |
– |
7 |
– |
26 |
| Accumulated depreciation as
at June 30, 2023 |
– |
(4,631) |
(2,472) |
(1,208) |
(5,922) |
(1,716) |
(1,073) |
(41) |
(17,063) |
| Carrying value as at April 1,
2023 |
1,431 |
7,027 |
865 |
284 |
2,693 |
628 |
413 |
5 |
13,346 |
| Carrying value as at June 30,
2023 |
1,431 |
6,883 |
821 |
276 |
2,549 |
591 |
384 |
4 |
12,939 |
The changes in the carrying value
of property, plant
and equipment for the three months ended June 30, 2022 were as follows:
(In crore)
|
Particulars |
Land -
Freehold |
Buildings
(1) |
Plant
and machinery |
Office
Equipment |
Computer
equipment |
Furniture
and fixtures |
Leasehold Improvements |
Vehicles |
Total
|
| Gross carrying value as at April 1, 2022 |
1,431 |
11,224 |
3,210 |
1,427 |
8,527 |
2,278 |
1,234 |
44 |
29,375 |
| Additions - Business Combination |
– |
– |
– |
5 |
3 |
1 |
2 |
– |
11 |
| Additions |
– |
132 |
47 |
22 |
333 |
51 |
63 |
– |
648 |
| Deletions* |
– |
– |
(3) |
(20) |
(71) |
(17) |
(11) |
– |
(122) |
| Translation difference |
– |
(13) |
(1) |
(1) |
(2) |
– |
(1) |
– |
(18) |
| Gross carrying value as at
June 30, 2022 |
1,431 |
11,343 |
3,253 |
1,433 |
8,790 |
2,313 |
1,287 |
44 |
29,894 |
| Accumulated depreciation as at April 1, 2022 |
– |
(4,100) |
(2,344) |
(1,150) |
(6,034) |
(1,779) |
(856) |
(37) |
(16,300) |
| Depreciation |
– |
(107) |
(69) |
(29) |
(301) |
(57) |
(42) |
(1) |
(606) |
| Accumulated depreciation on deletions* |
– |
– |
3 |
20 |
71 |
17 |
11 |
– |
122 |
| Translation difference |
–
|
2 |
1 |
1 |
– |
(1) |
1 |
– |
4 |
| Accumulated depreciation as
at June 30, 2022 |
–
|
(4,205) |
(2,409) |
(1,158) |
(6,264) |
(1,820) |
(886) |
(38) |
(16,780) |
| Carrying value as at April 1,
2022 |
1,431 |
7,124 |
866 |
277 |
2,493 |
499 |
378 |
7 |
13,075 |
| Carrying value as at June 30,
2022 |
1,431 |
7,138 |
844 |
275 |
2,526 |
493 |
401 |
6 |
13,114 |
| (1) |
|
Buildings include 250/-
being the value of five shares of 50/- each in Mittal
Towers Premises Co-operative Society Limited. |
| * |
|
During the three months ended June 30, 2023 and June 30, 2022, certain assets
which were
not in use having gross book value of 320 crore (net
book value: Nil) and 68 crore
(net book value: Nil) respectively,
were retired. |
The aggregate depreciation has been
included under
depreciation and amortization expense in the interim condensed Consolidated Statement of Profit and Loss.
Repairs and maintenance costs are
recognized in the
Consolidated Statement of Profit and Loss when incurred.
2.3 GOODWILL AND OTHER
INTANGIBLE ASSETS
2.3.1 Goodwill
Accounting policy
Goodwill represents the purchase
consideration in excess
of the Group's interest in the net fair value of identifiable assets, liabilities and contingent liabilities of the
acquired entity. When
the net fair value of the identifiable assets, liabilities and contingent liabilities acquired exceeds purchase
consideration, the fair
value of net assets acquired is reassessed and the bargain purchase gain is recognized in capital reserve. Goodwill
is measured at cost
less accumulated impairment losses.
Impairment
Goodwill is tested for impairment
on an annual basis
and whenever there is an indication that the recoverable amount of a cash generating unit (CGU) is less than its
carrying amount. For
the impairment test, goodwill is allocated to the CGU or groups of CGUs which benefit from the synergies of the
acquisition and which
represents the lowest level at which goodwill is monitored for internal management purposes. A CGU is the smallest
identifiable group
of assets that generates cash inflows that are largely independent of the cash inflows from other assets or group of
assets. Impairment
occurs when the carrying amount of a CGU including the goodwill, exceeds the estimated recoverable amount of the
CGU. The recoverable
amount of a CGU is the higher of its fair value less cost to sell and its value-in-use. Value-in-use is the present
value of future cash
flows expected to be derived from the CGU. Key assumptions in the cash flow projections are prepared based on
current economic conditions
and includes estimated long term growth rates, weighted average cost of capital and estimated operating margins.
Following is a summary of changes
in the carrying amount
of goodwill:
(In crore)
| Particulars |
As
at |
| |
June 30, 2023 |
March 31, 2023 |
| Carrying value at the beginning |
7,248 |
6,195 |
| Goodwill on acquisitions |
– |
630 |
| Translation differences |
(15) |
423 |
| Carrying value at the end
|
7,233 |
7,248 |
For the purpose of impairment
testing, goodwill acquired
in a business combination is allocated to the CGU or groups of CGUs, which benefit from the synergies of the
acquisition.
2.3.2 Intangible Assets
Accounting policy
Intangible assets are stated at
cost less accumulated
amortization and impairment. Intangible assets are amortized over their respective individual estimated useful lives
on a straight-line
basis, from the date that they are available for use. The estimated useful life of an identifiable intangible asset
is based on a number
of factors including the effects of obsolescence, demand, competition, and other economic factors (such as the
stability of the industry,
and known technological advances) and the level of maintenance expenditures required to obtain the expected future
cash flows from the
asset. Amortization methods and useful lives are reviewed periodically including at each financial year end.
Research costs are expensed as
incurred. Software product
development costs are expensed as incurred unless technical and commercial feasibility of the project is
demonstrated, future economic
benefits are probable, the Group has an intention and ability to complete and use or sell the software and the costs
can be measured reliably.
The costs which can be capitalized include the cost of material, direct labor, overhead costs that are directly
attributable to prepare
the asset for its intended use.
Impairment
Intangible assets are evaluated for
recoverability
whenever events or changes in circumstances indicate that their carrying amounts may not be recoverable. For the
purpose of impairment
testing, the recoverable amount (i.e. the higher of the fair value less cost to sell and the value-in-use) is
determined on an individual
asset basis unless the asset does not generate cash flows that are largely independent of those from other assets.
In such cases, the
recoverable amount is determined for the CGU to which the asset belongs.
If such assets are considered to be
impaired, the impairment
to be recognized in the Consolidated Statement of Profit and Loss is measured by the amount by which the carrying
value of the assets
exceeds the estimated recoverable amount of the asset. An impairment loss is reversed in the Consolidated Statement
of Profit and Loss
if there has been a change in the estimates used to determine the recoverable amount. The carrying amount of the
asset is increased to
its revised recoverable amount, provided that this amount does not exceed the carrying amount that would have been
determined (net of
any accumulated amortization) had no impairment loss been recognized for the asset in prior years.
2.4 INVESTMENTS
(In crore)
| Particulars |
As at |
| |
June 30, 2023 |
March 31, 2023 |
| Non-current Investments |
|
|
| Unquoted |
|
|
| Investments carried at fair value
through other comprehensive income |
|
|
| Preference securities |
193 |
193 |
| Equity instruments |
3 |
3 |
| |
196 |
196 |
| Investments carried at fair value
through profit or loss |
|
|
| Target maturity fund units |
409 |
402 |
| Others (1) |
172 |
169 |
| |
581 |
571 |
| Quoted |
|
|
| Investments carried at amortized
cost |
|
|
| Government bonds |
28 |
28 |
| Tax free bonds |
1,739 |
1,742 |
| |
1,767 |
1,770 |
| Investments carried at fair value
through other comprehensive income |
|
|
| Non convertible debentures |
2,336 |
2,713 |
| Government securities |
7,111 |
7,319 |
| |
9,447 |
10,032 |
| Total non-current investments |
11,991 |
12,569 |
| Current Investments |
|
|
| Unquoted |
|
|
| Investments carried at fair value
through profit or loss |
|
|
| Liquid mutual fund units |
1,397 |
975 |
| |
1,397 |
975 |
| Investments carried at fair value
through other comprehensive income |
|
|
| Commercial Paper |
1,496 |
742 |
| Certificates of deposit |
939 |
3,574 |
| |
2,435 |
4,316 |
| Quoted |
|
|
| Investments carried at amortized
cost |
|
|
| Tax free bonds |
150 |
150 |
| |
150 |
150 |
| Investments carried at fair value
through other comprehensive income |
|
|
| Non convertible debentures |
1,272 |
1,155 |
| Government securities |
282 |
313 |
| |
1,554 |
1,468 |
| Total current investments |
5,536 |
6,909 |
| Total investments |
17,527 |
19,478 |
| Aggregate amount of quoted investments |
12,918 |
13,420 |
| Market value of quoted investments (including interest accrued),
current |
1,723 |
1,637 |
| Market value of quoted investments (including interest accrued),
non current |
11,446 |
12,042 |
| Aggregate amount of unquoted investments |
4,609 |
6,058 |
| Investments carried at amortized cost |
1,917 |
1,920 |
| Investments carried at fair value through other comprehensive
income |
13,632 |
16,012 |
| Investments carried at fair
value through profit or loss |
1,978 |
1,546 |
| (1) |
|
Uncalled capital commitments outstanding as at June 30, 2023 and March 31, 2023
was 88
crore and 92 crore,
respectively. |
Refer to Note 2.11 for
Accounting policies on Financial
Instruments.
Method of fair valuation:
(In crore)
| Class of investment |
Method |
Fair
value as at |
| |
|
June 30, 2023 |
March 31, 2023 |
| Liquid mutual fund units - carried at fair value through profit
or loss |
Quoted price |
1,397 |
975 |
| Target maturity fund units - carried at fair value through
profit or loss |
Quoted price |
409 |
402 |
| Tax free bonds and government bonds - carried at amortized cost
|
Quoted price and market observable inputs
|
2,153 |
2,148 |
| Non-convertible debentures - carried at fair value through other
comprehensive income |
Quoted price and market observable inputs
|
3,608 |
3,868 |
| Government securities - carried at fair value through other
comprehensive income |
Quoted price and market observable inputs
|
7,393 |
7,632 |
| Commercial Papers - carried at fair value through other
comprehensive income |
Market observable inputs |
1,496 |
742 |
| Certificates of deposit - carried at fair value through other
comprehensive income |
Market observable inputs |
939 |
3,574 |
| Unquoted equity and preference securities - carried at fair
value through other comprehensive income |
Discounted cash flows method, Market multiples method, Option
pricing model |
196 |
196 |
| Others - carried at fair value through profit or loss |
Discounted cash flows method, Market multiples method, Option
pricing model |
172 |
169 |
| Total |
|
17,763 |
19,706 |
Note: Certain quoted investments are classified
as Level 2 in the absence of active market for such investments.
2.5 LOANS
(In crore)
| Particulars |
As at |
| |
June 30, 2023 |
March 31, 2023 |
| Non Current |
|
|
| Loans considered good - Unsecured |
|
|
| Other loans |
|
|
| Loans to employees |
34 |
39 |
| |
34 |
39 |
| Loans credit impaired - Unsecured |
|
|
| Other loans |
|
|
| Loans to employees |
1 |
2 |
| Less: Allowance for credit impairment |
(1) |
(2) |
| |
–
|
–
|
| Total non-current loans |
34 |
39 |
| Current |
|
|
| Loans considered good - Unsecured |
|
|
| Other loans |
|
|
| Loans to employees |
267 |
289 |
| Total current loans |
267 |
289 |
| Total loans |
301 |
328 |
2.6 OTHER FINANCIAL ASSETS
(In crore)
| Particulars |
As at |
| |
June 30,
2023 |
March 31,
2023 |
| Non Current |
|
|
| Security deposits (1) |
46 |
47 |
| Rental deposits (1) |
240 |
240 |
| Unbilled revenues (1)# |
1,128 |
1,185 |
| Net investment in sublease of right-of-use
asset (1) |
6 |
305 |
| Restricted deposits (1)* |
104 |
96 |
| Others (1) |
706 |
925 |
| Total non-current other financial assets |
2,230 |
2,798 |
| Current |
|
|
| Security deposits (1) |
11 |
10 |
| Rental deposits (1) |
30 |
32 |
| Restricted deposits (1)* |
2,532 |
2,348 |
| Unbilled revenues (1)# |
7,899 |
8,317 |
| Interest accrued but not due
(1) |
335 |
488 |
| Foreign currency forward and options
contracts (2)(3) |
171 |
101 |
| Net investment in sublease of right
of-use-asset (1) |
5 |
53 |
| Others (1) |
790 |
255 |
| Total current other financial assets |
11,773 |
11,604 |
| Total other financial assets |
14,003 |
14,402 |
| (1) Financial assets carried at amortized cost |
13,832 |
14,301 |
| (2) Financial assets carried at fair value through
other comprehensive income |
22 |
32 |
| (3) Financial assets
carried at fair value through profit or loss |
149 |
69 |
| * |
|
Restricted deposits represent deposits with financial institutions to settle
employee related
obligations as and when they arise during the normal course of business. |
| # |
|
Classified as financial asset as right to consideration is unconditional and is
due only
after a passage of time. |
2.7 TRADE RECEIVABLES
(In crore)
| Particulars |
As at |
|
|
June 30, 2023 |
March 31, 2023 |
| Current |
|
|
| Trade Receivable considered good -
Unsecured |
26,765 |
25,965 |
| Less: Allowance for expected credit loss
|
582 |
541 |
| Trade Receivable considered good -
Unsecured |
26,183 |
25,424 |
| Trade Receivable - credit impaired -
Unsecured |
160 |
142 |
| Less: Allowance for credit impairment |
160 |
142 |
| Trade Receivable - credit impaired -
Unsecured |
– |
– |
| Total trade receivables
|
26,183 |
25,424 |
2.8 CASH AND CASH EQUIVALENTS
(In
crore)
| Particulars |
As at |
| |
June 30, 2023 |
March 31, 2023 |
| Balances with banks |
|
|
| In current and deposit accounts |
10,363 |
10,026 |
| Cash on hand |
– |
– |
| Others |
|
|
| Deposits with financial institutions |
1,947 |
2,147 |
| Total cash and cash equivalents |
12,310 |
12,173 |
| Balances with banks in unpaid dividend accounts |
36 |
37 |
| Deposit with more than 12
months maturity |
125 |
833 |
Cash and cash equivalents as at
June 30, 2023 and March
31, 2023 include restricted cash and bank balances of 381 crore and 362 crore respectively. The restrictions are primarily
on account of bank balances held by irrevocable trusts controlled by the company.
The deposits maintained by the
Group with banks and
financial institutions comprise of time deposits, which can be withdrawn by the Group at any point without prior
notice or penalty on
the principal.
2.9 EARMARKED BANK BALANCE FOR
DIVIDEND
(In crore)
| Particulars |
As at |
| |
June 30, 2023 |
March 31, 2023 |
| Current |
|
|
| Earmarked bank balance for dividend |
7,262 |
– |
| Total |
7,262 |
– |
The Board of Directors in their
meeting held on April
13, 2023 recommended a final dividend of 17.50/- per equity share for the financial year ended March 31, 2023. The same
was approved
by the shareholders at the Annual General Meeting (AGM) of the Company held on June 28, 2023. Payment date for the
dividend is July 3,
2023. Earmarked bank balance for dividend represents cash which is deposited in a designated bank account only for
payment of final dividend
for financial year ended March 31, 2023.
2.10 OTHER ASSETS
(In crore)
| Particulars |
As at |
| |
June 30, 2023 |
March 31, 2023 |
| Non-current |
|
|
| Capital advances |
161 |
159 |
| Advances other than capital advances |
|
|
| Others |
|
|
| Withholding taxes and others |
685 |
684 |
| Unbilled revenues # |
251 |
264 |
| Defined benefit plan assets |
34 |
36 |
| Prepaid expenses |
395 |
332 |
| Deferred Contract Cost |
|
|
| Cost of obtaining a contract * |
189 |
191 |
| Cost of fulfillment |
729 |
652 |
| Total non-current other assets |
2,444 |
2,318 |
| Current |
|
|
| Advances other than capital advances |
|
|
| Payment to vendors for supply of goods
|
222 |
202 |
| Others |
|
|
| Unbilled revenues # |
6,729 |
6,972 |
| Withholding taxes and others |
2,978 |
3,268 |
| Prepaid expenses |
3,097 |
2,745 |
| Deferred Contract Cost |
|
|
| Cost of obtaining a contract * |
657 |
853 |
| Cost of fulfillment |
200 |
175 |
| Other receivables |
249 |
261 |
| Total current other assets |
14,132 |
14,476 |
| Total other assets |
16,576 |
16,794 |
| # |
|
Classified as non financial asset as the contractual right to consideration is
dependent
on completion of contractual milestones. |
| * |
|
Includes technology assets taken over by the Group from a customer as a part of transformation
project which is not considered as distinct goods or services and the control related to the assets is not transferred to the Group
in accordance with Ind AS 115 - Revenue from contract with customers. Accordingly, the same has been considered as a reduction
to the total contract value and accounted as Deferred contract cost. The Group has entered into financing arrangements with a third
party for these assets. As at June 30, 2023, the financial liability pertaining to such arrangements amounts to 582
crore. This includes, 20 crore was settled directly
by the third party to the customer on behalf of the Group and accordingly considered as non-cash transaction (Refer to Note
2.13). |
Withholding taxes and others
primarily consist of input
tax credits and Cenvat/VAT recoverable from Government of India.
2.11 FINANCIAL INSTRUMENTS
Accounting policy
2.11.1 Initial recognition
The Group recognizes financial
assets and financial
liabilities when it becomes a party to the contractual provisions of the instrument. All financial assets and
liabilities are recognized
at fair value on initial recognition, except for trade receivables which are initially measured at transaction
price. Transaction costs
that are directly attributable to the acquisition or issue of financial assets and financial liabilities, which are
not at fair value
through profit or loss, are added to the fair value on initial recognition. Regular way purchase and sale of
financial assets are accounted
for at trade date.
2.11.2 Subsequent
measurement
a. Non-derivative financial
instruments
(i) Financial assets carried at amortized
cost
A financial asset is subsequently
measured at amortized
cost if it is held within a business model whose objective is to hold the asset in order to collect contractual cash
flows and the contractual
terms of the financial asset give rise on specified dates to cash flows that are solely payments of principal and
interest on the principal
amount outstanding.
(ii) Financial assets carried
at fair value through
other comprehensive income (FVOCI)
A financial asset is subsequently
measured at fair
value through other comprehensive income if it is held within a business model whose objective is achieved by both
collecting contractual
cash flows and selling financial assets and the contractual terms of the financial asset give rise on specified
dates to cash flows that
are solely payments of principal and interest on the principal amount outstanding. The Group has made an irrevocable
election for its
investments which are classified as equity instruments to present the subsequent changes in fair value in other
comprehensive income based
on its business model.
(iii) Financial assets
carried at fair value
through profit or loss
A financial asset which is not
classified in any of
the above categories is subsequently fair valued through profit or loss.
(iv) Financial
liabilities
Financial liabilities are
subsequently carried at amortized
cost using the effective interest method, except for contingent consideration and financial liability under option
arrangements recognized
in a business combination which is subsequently measured at fair value through profit or loss.
b. Derivative financial
instruments
The Group holds derivative
financial instruments such
as foreign exchange forward and option contracts to mitigate the risk of changes in exchange rates on foreign
currency exposures. The
counterparty for such contracts is generally a bank.
(i) Financial assets or
financial liabilities,
carried at fair value through profit or loss.
This category includes derivative
financial assets
or liabilities which are not designated as hedges.
Although the Group believes that
these derivatives
constitute hedges from an economic perspective, they may not qualify for hedge accounting under Ind AS 109,
Financial Instruments. Any
derivative that is either not designated as hedge, or is so designated but is ineffective as per Ind AS 109, is
categorized as a financial
asset or financial liability, at fair value through profit or loss.
Derivatives not designated as
hedges are recognized
initially at fair value and attributable transaction costs are recognized in net profit in the Consolidated
Statement of Profit and Loss
when incurred. Subsequent to initial recognition, these derivatives are measured at fair value through profit or
loss and the resulting
exchange gains or losses are included in other income. Assets/liabilities in this category are presented as current
assets/current liabilities
if they are either held for trading or are expected to be realized within 12 months after the Balance Sheet date.
(ii) Cash flow hedge
The Group designates certain
foreign exchange forward
and options contracts as cash flow hedges to mitigate the risk of foreign exchange exposure on highly probable
forecast cash transactions.
When a derivative is designated as
a cash flow hedging
instrument, the effective portion of changes in the fair value of the derivative is recognized in other
comprehensive income and accumulated
in the cash flow hedging reserve. Any ineffective portion of changes in the fair value of the derivative is
recognized immediately in
the net profit in the Consolidated Statement of Profit and Loss. If the hedging instrument no longer meets the
criteria for hedge accounting,
then hedge accounting is discontinued prospectively. If the hedging instrument expires or is sold, terminated or
exercised, the cumulative
gain or loss on the hedging instrument recognized in cash flow hedging reserve till the period the hedge was
effective remains in cash
flow hedging reserve until the forecasted transaction occurs. The cumulative gain or loss previously recognized in
the cash flow hedging
reserve is transferred to the net profit in the Consolidated Statement of Profit and Loss upon the occurrence of the
related forecasted
transaction. If the forecasted transaction is no longer expected to occur, then the amount accumulated in cash flow
hedging reserve is
reclassified to net profit in the Consolidated Statement of Profit and Loss.
2.11.3 Derecognition of
financial instruments
The Group derecognizes a financial
asset when the contractual
rights to the cash flows from the financial asset expire or it transfers the financial asset and the transfer
qualifies for derecognition
under Ind AS 109. A financial liability (or a part of a financial liability) is derecognized from the Group's
Balance Sheet when the obligation
specified in the contract is discharged or cancelled or expires.
2.11.4 Fair value of financial
instruments
In determining the fair value of
its financial instruments,
the Group uses a variety of methods and assumptions that are based on market conditions and risks existing at each
reporting date. The
methods used to determine fair value include discounted cash flow analysis, option pricing model, market multiples,
available quoted market
prices and dealer quotes. All methods of assessing fair value result in general approximation of value, and such
value may never actually
be realized.
Refer to table 'Financial
instruments by category'
below for the disclosure on carrying value and fair value of financial assets and liabilities. For financial assets
and liabilities maturing
within one year from the Balance Sheet date and which are not carried at fair value, the carrying amounts
approximates fair value due
to the short maturity of these instruments.
2.11.5 Impairment
The Group recognizes loss
allowances using the expected
credit loss (ECL) model for the financial assets and unbilled revenue which are not fair valued through profit or
loss. Loss allowance
for trade receivables and unbilled revenues with no significant financing component is measured at an amount equal
to lifetime ECL. For
all other financial assets, ECLs are measured at an amount equal to the 12-month ECL, unless there has been a
significant increase in
credit risk from initial recognition in which case those are measured at lifetime ECL.
The Group determines the allowance
for credit losses
based on historical loss experience adjusted to reflect current and estimated future economic conditions. The Group
considers current
and anticipated future economic conditions relating to industries the Group deals with and the countries where it
operates.
The amount of ECL (or reversal)
that is required to
adjust the loss allowance at the reporting date to the amount that is required to be recorded is recognized as an
impairment loss or gain
in Consolidated Statement of Profit and Loss.
Financial instruments by
category
The carrying value and fair value
of financial instruments
by categories as at June 30, 2023 are as follows:
(In  crore)
| Particulars |
Amortized cost |
Financial assets/ liabilities
at fair value through
profit or loss
|
Financial assets/liabilities
at fair value through
OCI
|
Total carrying value |
Total fair value |
| |
|
Designated upon initial
recognition |
Mandatory |
Equity instruments designated upon
initial recognition |
Mandatory |
|
|
| Assets: |
|
|
|
|
|
|
|
| Cash and cash equivalents (Refer to Note
2.8) |
12,310 |
– |
– |
– |
– |
12,310 |
12,310 |
| Earmarked bank balance for dividend (Refer Note no. 2.9) |
7,262 |
– |
– |
– |
– |
7,262 |
7,262 |
| Investments (Refer to Note 2.4) |
|
|
|
|
|
|
|
| Equity and preference
securities |
– |
– |
– |
196 |
– |
196 |
196 |
| Tax free bonds and
government bonds |
1,917 |
– |
– |
– |
– |
1,917 |
2,153(1) |
| Liquid mutual fund
units |
– |
– |
1,397 |
– |
– |
1,397 |
1,397 |
| Target maturity fund
units |
– |
– |
409 |
– |
– |
409 |
409 |
| Non convertible
debentures |
– |
– |
– |
– |
3,608 |
3,608 |
3,608 |
| Government securities
|
– |
– |
– |
– |
7,393 |
7,393 |
7,393 |
| Commercial paper |
– |
– |
– |
– |
1,496 |
1,496 |
1,496 |
| Certificates of
deposit |
– |
– |
– |
– |
939 |
939 |
939 |
| Other investments
|
– |
– |
172 |
– |
– |
172 |
172 |
| Trade receivables (Refer to Note
2.7) |
26,183 |
– |
– |
– |
– |
26,183 |
26,183 |
| Loans (Refer to Note 2.5) |
301 |
– |
– |
– |
– |
301 |
301 |
| Other financials assets (Refer to Note
2.6)(3) |
13,832 |
– |
149 |
– |
22 |
14,003 |
13,911(2) |
| Total |
61,805
|
– |
2,127
|
196 |
13,458
|
77,586
|
77,730
|
| Liabilities: |
|
|
|
|
|
|
|
| Trade payables |
3,759 |
– |
– |
– |
– |
3,759 |
3,759 |
| Lease liabilities (Refer to Note 2.20) |
8,483 |
– |
– |
– |
– |
8,483 |
8,483 |
| Financial Liability under option arrangements (Refer to
Note 2.13) |
– |
– |
627 |
– |
– |
627 |
627 |
| Other financial liabilities (Refer to
Note 2.13) |
21,735 |
– |
145 |
– |
6 |
21,886 |
21,886 |
| Total
|
33,977
|
– |
772 |
– |
6 |
34,755
|
34,755
|
| (1) |
|
On account of fair value changes including interest accrued |
| (2) |
|
Excludes interest accrued on tax free bonds and government bonds carried at
amortized
cost of 92 crore |
| (3) |
|
Excludes unbilled revenue on contracts where the right to consideration is
dependent on
completion of contractual milestones |
The carrying value and fair value
of financial instruments
by categories as at March 31, 2023 were as follows:
(In crore)
| Particulars |
Amortized cost |
Financial assets/ liabilities
at fair value through
profit or loss
|
Financial assets/liabilities
at fair value through
OCI
|
Total carrying value |
Total fair value |
| |
|
Designated upon initial
recognition |
Mandatory |
Equity instruments designated upon
initial recognition |
Mandatory |
|
|
| Assets: |
|
|
|
|
|
|
|
| Cash and cash equivalents (Refer to Note 2.8) |
12,173 |
– |
– |
– |
– |
12,173 |
12,173 |
| Investments (Refer to Note 2.4) |
|
|
|
|
|
|
|
| Equity and preference
securities |
– |
– |
– |
196 |
– |
196 |
196 |
| Tax free bonds and
government bonds |
1,920 |
– |
– |
– |
– |
1,920 |
2,148(1) |
| Liquid mutual fund
units |
– |
– |
975 |
– |
– |
975 |
975 |
| Target maturity fund
units |
– |
– |
402 |
– |
– |
402 |
402 |
| Non convertible
debentures |
– |
– |
– |
– |
3,868 |
3,868 |
3,868 |
| Government securities
|
– |
– |
– |
– |
7,632 |
7,632 |
7,632 |
| Commercial paper |
– |
– |
– |
– |
742 |
742 |
742 |
| Certificates of
deposit |
– |
– |
– |
– |
3,574 |
3,574 |
3,574 |
| Other investments
|
– |
– |
169 |
– |
– |
169 |
169 |
| Trade receivables (Refer to Note
2.7) |
25,424 |
– |
– |
– |
– |
25,424 |
25,424 |
| Loans (Refer to Note 2.5) |
328 |
– |
– |
– |
– |
328 |
328 |
| Other financials assets (Refer to Note
2.6)(3) |
14,301 |
– |
69 |
– |
32 |
14,402 |
14,318(2) |
| Total |
54,146
|
– |
1,615
|
196 |
15,848
|
71,805
|
71,949
|
| Liabilities: |
|
|
|
|
|
|
|
| Trade payables |
3,865 |
– |
– |
– |
– |
3,865 |
3,865 |
| Lease liabilities (Refer to Note 2.20) |
8,299 |
– |
– |
– |
– |
8,299 |
8,299 |
| Financial Liability under option arrangements (Refer to Note
2.13) |
– |
– |
600 |
– |
– |
600 |
600 |
| Other financial liabilities (Refer to
Note 2.13) |
17,359 |
– |
161 |
– |
14 |
17,534 |
17,534 |
| Total
|
29,523
|
– |
761 |
– |
14 |
30,298
|
30,298
|
| (1) |
|
On account of fair value changes including interest accrued |
| (2) |
|
Excludes interest accrued on tax free bonds and government bonds carried at
amortized
cost of 84 crore |
| (3) |
|
Excludes unbilled revenue on contracts where the right to consideration is
dependent on
completion of contractual milestones |
For trade receivables, trade
payables, other assets
and payables maturing within one year from the Balance Sheet date, the carrying amounts approximate the fair value
due to the short maturity
of these instruments.
Fair value hierarchy
Level 1 - Quoted prices
(unadjusted) in active
markets for identical assets or liabilities.
Level 2 - Inputs other than quoted prices
included within Level 1 that are observable for the asset or liability, either directly (i.e. as prices) or indirectly (i.e. derived
from prices).
Level 3 - Inputs for the assets or liabilities
that are not based on observable market data (unobservable inputs).
The fair value hierarchy of assets
and liabilities
measured at fair value on a recurring basis as at June 30, 2023 is as follows:
(In crore)
|
Particulars |
As at June 30, 2023 |
Fair value measurement at end of the reporting period using |
|
|
|
Level
1 |
Level 2
|
Level 3
|
| Assets |
|
|
|
|
| Investments (Refer to note 2.4) |
|
|
|
|
| Investments in liquid mutual funds |
1,397 |
1,397 |
– |
– |
| Investments in target maturity fund units
|
409 |
409 |
– |
– |
| Investments in tax free bonds |
2,125 |
1,969 |
156 |
– |
| Investments in government bonds |
28 |
28 |
– |
– |
| Investments in non convertible debentures
|
3,608 |
2,244 |
1,364 |
– |
| Investment in government securities |
7,393 |
7,393 |
– |
– |
| Investments in equity instruments |
3 |
– |
– |
3 |
| Investments in preference securities |
193 |
– |
– |
193 |
| Investments in commercial paper |
1,496 |
– |
1,496 |
– |
| Investments in certificates of deposit |
939 |
– |
939 |
– |
| Other investments |
172 |
– |
– |
172 |
| Others |
|
|
|
|
| Derivative financial instruments - gain on outstanding foreign
exchange forward and option contracts (Refer to Note 2.6) |
171 |
– |
171 |
– |
| Liabilities |
|
|
|
|
| Derivative financial instruments - loss on outstanding foreign
exchange forward and option contracts (Refer to Note 2.13) |
52 |
– |
52 |
– |
| Financial liability under option arrangements (Refer to Note
2.13) (1) |
627 |
– |
– |
627 |
| Liability
towards contingent consideration (Refer to Note 2.13)(1) |
99 |
– |
– |
99 |
| (1) |
|
Discount rate ranges from 10% to 17% |
During the three months ended June
30, 2023, non-convertible
debentures, government securities and tax free bonds of 1,449 crore was transferred from Level 2 to Level 1 of fair value hierarchy,
since these were valued based on quoted price.
The fair value hierarchy of assets
and liabilities
measured at fair value on a recurring basis as at March 31, 2023 was as follows:
(In crore)
|
Particulars |
As at March 31, 2023
|
Fair value measurement at end of the reporting period using |
|
|
|
Level
1 |
Level 2
|
Level 3
|
| Assets |
|
|
|
|
| Investments (Refer to note 2.4) |
|
|
|
|
| Investments in liquid mutual funds |
975 |
975 |
– |
– |
| Investments in target maturity fund units
|
402 |
402 |
– |
– |
| Investments in tax free bonds |
2,120 |
1,331 |
789 |
– |
| Investments in government bonds |
28 |
28 |
– |
– |
| Investments in non convertible debentures
|
3,868 |
1,793 |
2,075 |
– |
| Investment in government securities |
7,632 |
7,549 |
83 |
– |
| Investments in equity instruments |
3 |
– |
– |
3 |
| Investments in preference securities |
193 |
– |
– |
193 |
| Investments in commercial paper |
742 |
– |
742 |
– |
| Investments in certificates of deposit |
3,574 |
– |
3,574 |
– |
| Other investments |
169 |
– |
– |
169 |
| Others |
|
|
|
|
| Derivative financial instruments - gain on outstanding foreign
exchange forward and option contracts (Refer to Note 2.6) |
101 |
– |
101 |
– |
| Liabilities |
|
|
|
|
| Derivative financial instruments - loss on outstanding foreign
exchange forward and option contracts (Refer to Note 2.13) |
78 |
– |
78 |
– |
| Financial liability under option arrangements (Refer to Note
2.13) (1) |
600 |
– |
– |
600 |
| Liability
towards contingent consideration (Refer to Note 2.13)(1) |
97 |
– |
– |
97 |
| (1) |
|
Discount rate ranges from 10% to 15% |
During the year ended March 31,
2023, government securities
and tax free bonds of 383 crore was
transferred from Level 2 to Level 1 of fair value hierarchy, since these were valued based
on quoted price. Further, non-convertible debentures of 1,611 crore were transferred from Level 1 to Level 2 of fair value hierarchy,
since these were valued based on market observable inputs.
A one percentage point change in
the unobservable inputs
used in fair valuation of Level 3 assets and liabilities does not have a significant impact in its value.
Majority of investments of the
Group are fair valued
based on Level 1 or Level 2 inputs. These investments primarily include investment in liquid mutual fund units,
target maturity fund units,
tax free bonds, certificates of deposit, commercial paper, treasury bills, government securities, quoted bonds
issued by government and
quasi-government organizations and non-convertible debentures. The Group invests after considering counterparty
risks based on multiple
criteria including Tier I capital, Capital Adequacy Ratio, Credit Rating, Profitability, NPA levels and Deposit base
of banks and financial
institutions. These risks are monitored regularly as per Group's risk management program.
2.12 EQUITY
Accounting policy
Ordinary Shares
Ordinary shares are classified as equity share capital. Incremental
costs directly attributable to the issuance of new ordinary shares, share options and buyback are recognized as a deduction from equity,
net of any tax effects.
Treasury Shares
When any entity within the Group purchases the company's ordinary
shares, the consideration paid including any directly attributable incremental cost is presented as a deduction from total equity, until
they are cancelled, sold or reissued. When treasury shares are sold or reissued subsequently, the amount received is recognized as an
increase in equity, and the resulting surplus or deficit on the transaction is transferred to / from securities premium.
Description of reserves
Capital Redemption Reserve
In accordance with section 69 of the Indian Companies Act, 2013,
the Company creates capital redemption reserve equal to the nominal value of the shares bought back as an appropriation from general
reserve / retained earnings.
Retained earnings
Retained earnings represent the amount of accumulated earnings
of the Group.
Securities premium
The amount received in excess of the par value of equity shares
has been classified as securities premium. Amounts have been utilized for bonus issue and share buyback from share premium account.
Share options outstanding account
The share options outstanding account is used to record the
fair value of equity-settled share based payment transactions with employees. The amounts recorded in share options outstanding account
are transferred to securities premium upon exercise of stock options and transferred to general reserve on account of stock options not
exercised by employees.
Special Economic Zone Re-investment reserve
The Special Economic Zone Re-investment reserve has been created
out of the profit of the eligible SEZ unit in terms of the provisions of Sec 10AA (1)(ii) of Income Tax Act, 1961. The reserve should
be utilized by the Company for acquiring new plant and machinery for the purpose of its business in terms of the provisions of the Sec
10AA (2) of the Income Tax Act, 1961.
Other components of equity
Other components of equity include currency translation, remeasurement
of net defined benefit liability / asset, equity instruments fair valued through other comprehensive income, changes on fair valuation
of investments and changes in fair value of derivatives designated as cash flow hedges, net of taxes.
Currency translation reserve
The exchange differences arising
from the translation
of financial statements of foreign subsidiaries with functional currency other than Indian rupees is recognized in
other comprehensive
income and is presented within equity.
Cash flow hedge reserve
When a derivative is designated as
a cash flow hedging
instrument, the effective portion of changes in the fair value of the derivative is recognized in other
comprehensive income and accumulated
in the cash flow hedging reserve. The cumulative gain or loss previously recognized in the cash flow hedging reserve
is transferred to
the interim condensed Consolidated Statement of Profit and Loss upon the occurrence of the related forecasted
transaction.
EQUITY SHARE CAPITAL
(In crore, except as otherwise stated)
| Particulars |
As at |
| |
June 30, 2023 |
March 31, 2023 |
| Authorized |
|
|
| Equity shares, 5 par value |
|
|
| 480,00,00,000 (480,00,00,000) equity shares |
2,400 |
2,400 |
| Issued, Subscribed and Paid-Up |
|
|
| Equity shares, 5 par value(1) |
2,070 |
2,069 |
| 4,13,84,54,008 (4,13,63,87,925) equity
shares fully paid-up(2) |
|
|
| |
2,070 |
2,069 |
Note: Forfeited shares amounted to
1,500 (1,500)
| (1) |
|
Refer to Note 2.21 for details of basic and diluted shares |
| (2) |
|
Net of treasury shares 1,17,38 357 (1,21,72,119) |
The Company has only one class of
shares referred to
as equity shares having a par value of 5/-. Each holder of equity shares is entitled to one vote per share. The equity
shares represented
by American Depositary Shares (ADS) carry similar rights to voting and dividends as the other equity shares. Each
ADS represents one underlying
equity share.
In the event of liquidation of the
Company, the holders
of equity shares will be entitled to receive any of the remaining assets of the Company in proportion to the number
of equity shares held
by the shareholders, after distribution of all preferential amounts. However, no such preferential amounts exist
currently, other than
the amounts held by irrevocable controlled trusts. For irrevocable controlled trusts, the corpus would be settled in
favor of the beneficiaries.
For details of shares reserved for
issue under the
employee stock option plan of the Company refer to the note below.
The reconciliation of the number of
shares outstanding
and the amount of share capital as at June 30, 2023 and March 31, 2023 are as follows:
(In crore, except as stated otherwise)
| Particulars |
As at
June 30, 2023 |
As at
March 31, 2023 |
| |
Number of shares |
Amount |
Number of shares |
Amount |
| As at the beginning of the period |
413,63,87,925 |
2,069 |
419,30,12,929 |
2,098 |
| Add: Shares issued on exercise of employee stock options |
20,66,083 |
1 |
38,01,344 |
1 |
| Less: Shares bought back |
– |
– |
6,04,26,348 |
30 |
| As at the end of the
period |
413,84,54,008 |
2,070 |
413,63,87,925 |
2,069 |
Capital allocation policy
Effective fiscal 2020, the Company
expects to return
approximately 85% of the free cash flow cumulatively over a 5-year period through a combination of semi-annual
dividends and/or share
buyback and/or special dividends, subject to applicable laws and requisite approvals, if any. Free cash flow is
defined as net cash provided
by operating activities less capital expenditure as per the Consolidated Statement of Cash Flows prepared under
IFRS. Dividend and buyback
include applicable taxes.
The Company’s objective when
managing capital
is to safeguard its ability to continue as a going concern and to maintain an optimal capital structure so as to
maximize shareholder
value. In order to maintain or achieve an optimal capital structure, the Company may adjust the amount of dividend
payment, return capital
to shareholders, issue new shares or buy back issued shares. As of June 30, 2023, the Company has only one class of
equity shares and
has no debt. Consequent to the above capital structure there are no externally imposed capital requirements.
Dividend
The final dividend on shares is
recorded as a liability
on the date of approval by the shareholders and interim dividends are recorded as a liability on the date of
declaration by the Company's
Board of Directors. Income tax consequences of dividends on financial instruments classified as equity will be
recognized according to
where the entity originally recognized those past transactions or events that generated distributable profits.
The Company declares and pays
dividends in Indian rupees.
Companies are required to pay/distribute dividend after deducting applicable taxes. The remittance of dividends
outside India is governed
by Indian law on foreign exchange and is also subject to withholding tax at applicable rates.
The amount of per share dividend
recognized as distribution
to equity shareholders in accordance with Companies Act 2013 is as follows:
(in )
| Particulars |
Three months ended June 30, |
| |
2023 |
2022 |
| Final dividend for fiscal 2022 |
– |
16.00 |
| Final dividend for fiscal 2023
|
17.50 |
– |
The Board of Directors in their
meeting held on April
13, 2023 recommended a final dividend of 17.50/- per equity share for the financial year ended March 31, 2023. The same
was approved
by the shareholders at the Annual General Meeting (AGM) of the Company held on June 28, 2023 which will result in a
net cash outflow of
7,242 crore, excluding dividend paid
on treasury shares. Payment date for the dividend is July 3, 2023.
Employee Stock Option Plan
(ESOP):
Accounting policy
The Group recognizes compensation
expense relating
to share-based payments in net profit based on estimated fair values of the awards on the grant date. The estimated
fair value of awards
is recognized as an expense in the statement of profit and loss on a straight-line basis over the requisite service
period for each separately
vesting portion of the award as if the award was in-substance, multiple awards with a corresponding increase to
share options outstanding
account.
Infosys Expanded Stock Ownership
Program 2019 (the
2019 Plan) :
On June 22, 2019 pursuant to
approval by the shareholders
in the Annual General Meeting, the Board has been authorized to introduce, offer, issue and provide share-based
incentives to eligible
employees of the Company and its subsidiaries under the 2019 Plan. The maximum number of shares under the 2019 Plan
shall not exceed 5,00,00,000
equity shares. To implement the 2019 Plan, up to 4,50,00,000 equity shares may be issued by way of secondary
acquisition of shares by
Infosys Expanded Stock Ownership Trust. The Restricted Stock Units (RSUs) granted under the 2019 Plan shall vest
based on the achievement
of defined annual performance parameters as determined by the administrator (Nomination and Remuneration Committee).
The performance parameters
will be based on a combination of relative Total Shareholder Return (TSR) against selected industry peers and
certain broader market domestic
and global indices and operating performance metrics of the Company as decided by administrator. Each of the above
performance parameters
will be distinct for the purposes of calculation of quantity of shares to vest based on performance. These
instruments will generally
vest between a minimum of 1 to maximum of 3 years from the grant date.
2015 Stock Incentive
Compensation Plan (the 2015
Plan) :
On March 31, 2016, pursuant to the
approval by the
shareholders through postal ballot, the Board was authorized to introduce, offer, issue and allot share-based
incentives to eligible employees
of the Company and its subsidiaries under the 2015 Stock Incentive Compensation Plan. The maximum number of shares
under the 2015 Plan
shall not exceed 2,40,38,883 equity shares (this includes 1,12,23,576 equity shares which are held by the trust
towards the 2011 Plan
as at March 31, 2016). These instruments will generally vest over a period of 4 years. The plan numbers mentioned
above are further adjusted
with the September 2018 bonus issue.
The equity settled and cash settled
RSUs and stock
options would vest generally over a period of 4 years and shall be exercisable within the period as approved by the
Nomination and Remuneration
Committee (NARC). The exercise price of the RSUs will be equal to the par value of the shares and the exercise price
of the stock options
would be the market price as on the date of grant.
Controlled trust holds 1,17,38,357
and 1,21,72,119
shares as at June 30, 2023 and March 31, 2023, respectively, under the 2015 Plan. Out of these shares, 200,000
equity shares each have
been earmarked for welfare activities of the employees as at June 30, 2023 and March 31, 2023.
The following is the summary of
grants made during
the three months ended June 30, 2023 and June 30, 2022:
| Particulars |
2019 Plan |
2015 Plan |
| |
Three months
ended June 30, |
Three months
ended June 30, |
| |
2023 |
2022 |
2023 |
2022 |
| Equity Settled RSUs |
|
|
|
|
| Key Management Personnel (KMP) |
78,281 |
176,893 |
333,596 |
101,967 |
| Employees other than KMP |
– |
370,960 |
4,500 |
– |
| Total Grants |
78,281 |
547,853 |
338,096 |
101,967 |
Notes on grants to
KMP:
CEO & MD
Under the 2015 Plan:
The Board, on April 13, 2023, based
on the recommendations
of the Nomination and Remuneration Committee, approved the grant of performance-based RSUs (Annual performance
equity grant) of fair value
of 34.75 crore for fiscal 2024 under
the 2015 Plan. These RSUs will vest in line with the employment agreement based on achievement
of certain performance targets. Accordingly, 2,72,026 performance based RSU’s were granted effective May 2,
2023.
The Board, on April 13, 2023, based
on the recommendations
of the Nomination and Remuneration Committee, approved the performance-based grant of RSUs (Annual performance
equity ESG grant) of fair
value of 2 crore for fiscal 2024
under the 2015 Plan. These RSUs will vest in line with the employment agreement based on achievement
of certain environment, social and governance milestones as determined by the Board. Accordingly, 15,656 performance
based RSU’s
were granted effective May 2, 2023.
The Board, on April 13, 2023, based
on the recommendations
of the Nomination and Remuneration Committee, approved the performance-based grant of RSUs (Annual performance
Equity TSR grant) of fair
value of 5 crore for fiscal 2024
under the 2015 Plan. These RSUs will vest in line with the employment agreement based on Company’s
performance on cumulative relative TSR over the years and as determined by the Board. Accordingly, 39,140
performance based RSU’s
were granted effective May 2, 2023.
Though the annual time based grants
and annual performance
equity TSR grant for the remaining employment term ending on March 31, 2027 have not been granted as of June 30,
2023, since the service
commencement date precedes the grant date, the company has recorded employment stock compensation expense in
accordance with Ind AS 102,
Share based payment. The grant date for this purpose in accordance with Ind AS 102, Share based payment is July 1,
2022.
Under the 2019 Plan:
The Board, on April 13, 2023, based
on the recommendations
of the Nomination and Remuneration Committee, approved performance-based grant of RSUs amounting to 10 crore for fiscal 2024 under
the 2019 Plan. These RSUs will vest based on achievement of certain performance targets. Accordingly, 78,281
performance based RSU’s
were granted effective May 2, 2023.
Other KMP
Under the 2015 Plan:
During the three months ended June
30, 2023, based
on recommendations of Nomination and Remuneration Committee, the Board approved 6,774 performance based RSUs to a
KMP under the 2015 plan.
The performance based RSUs will vest over three years based on certain performance targets.
The break-up of employee stock
compensation expense
is as follows:
(in crore)
| Particulars |
Three months ended June 30, |
| |
2023 |
2022 |
| Granted to: |
|
|
| KMP |
20 |
17 |
| Employees other than KMP |
126 |
115 |
| Total
(1) |
146 |
132 |
| (1) Cash-settled stock compensation expense
included in the above |
2 |
(2) |
The fair value of the awards are
estimated using the
Black-Scholes Model for time and non-market performance based options and Monte Carlo simulation model is used for
TSR based options.
The inputs to the model include the
share price at
date of grant, exercise price, expected volatility, expected dividends, expected term and the risk free rate of
interest. Expected volatility
during the expected term of the options is based on historical volatility of the observed market prices of the
Company's publicly traded
equity shares during a period equivalent to the expected term of the options. Expected volatility of the comparative
company have been
modelled based on historical movements in the market prices of their publicly traded equity shares during a period
equivalent to the expected
term of the options. Correlation coefficient is calculated between each peer entity and the indices as a whole or
between each entity
in the peer group.
The fair value of each equity
settled award is estimated
on the date of grant using the following assumptions:
| Particulars |
For options granted in |
| |
Fiscal 2024-
Equity Shares-RSU |
Fiscal 2023-
Equity Shares-RSU |
Fiscal 2023-
ADS-RSU |
| Weighted average share price () / ($ ADS) |
1,277 |
1,525 |
18.08 |
| Exercise price () / ($ ADS) |
5.00 |
5.00 |
0.07 |
| Expected volatility (%) |
25-31 |
23-32 |
27-34 |
| Expected life of the option (years) |
1-4 |
1-4 |
1-4 |
| Expected dividends (%) |
2-3 |
2-3 |
2-3 |
| Risk-free interest rate (%) |
7 |
5-7 |
2-5 |
| Weighted average fair value as
on grant date () / ($ ADS) |
1,113 |
1,210 |
13.69 |
The expected life of the RSU/ESOP is
estimated based on
the vesting term and contractual term of the RSU/ESOP, as well as expected exercise behavior of the employee who
receives the RSU/ESOP.
2.13 OTHER FINANCIAL
LIABILITIES
(In crore)
| Particulars |
As at |
| |
June 30, 2023 |
March 31, 2023 |
| Non-current |
|
|
| Others |
|
|
| Accrued compensation to employees
(1) |
7 |
5 |
| Accrued expenses (1) |
1,535 |
1,628 |
| Compensated absences |
81 |
83 |
| Other Payables (1)(4) |
243 |
342 |
| Total non-current other financial liabilities |
1,866 |
2,058 |
| Current |
|
|
| Unpaid dividends (1) |
36 |
37 |
| Others |
|
|
| Accrued compensation to employees
(1) |
3,794 |
4,174 |
| Accrued expenses (1) |
7,384 |
7,802 |
| Retention monies (1) |
15 |
20 |
| Payable for acquisition of business -
Contingent consideration (2) |
99 |
97 |
| Payable by controlled trusts
(1) |
211 |
211 |
| Compensated absences |
2,543 |
2,399 |
| Financial liability under option
arrangements (2) # |
627 |
600 |
| Foreign currency forward and options
contracts (2)(3) |
52 |
78 |
| Capital creditors (1) |
263 |
674 |
| Final dividend payable to shareholders
(1)* |
6,523 |
– |
| Other payables (1)(4) |
1,724 |
2,466 |
| Total current other financial liabilities |
23,271 |
18,558 |
| Total other financial liabilities |
25,137 |
20,616 |
| (1) Financial liability carried at amortized cost
|
21,735 |
17,359 |
| (2) Financial liability carried at fair value through
profit or loss |
772 |
761 |
| (3) Financial
liability carried at fair value through other comprehensive income |
6 |
14 |
| (4) |
|
Deferred contract cost (Refer to Note 2.10) includes technology assets taken over by the
Group from a customer as a part of transformation project which is not considered as distinct goods or services and the control
related to the assets is not transferred to the Group in accordance with Ind AS 115 - Revenue from contract with customers. Accordingly,
the same has been considered as a reduction to the total contract value and accounted as Deferred contract cost. The Group has
entered into financing arrangements with a third party for these assets. As at June 30, 2023, the financial liability pertaining
to such arrangements amounts to 582 crore. During
the three months ended June 30, 2023, 20 crore
was settled directly by the third party to the customer on behalf of the Group and accordingly considered as non-cash transaction. |
| # |
|
Represents liability related to options issued by the Group over the
non-controlling interests
in its subsidiaries |
| * |
|
Pertains to final dividend declared by the Company for fiscal 2023 and approved by the shareholders
on June 28, 2023. Payment date for dividend is July 3, 2023 (Refer to Note 2.12) |
Accrued expenses primarily relate
to cost of technical
sub-contractors, telecommunication charges, legal and professional charges, brand building expenses, overseas travel
expenses, office
maintenance and cost of third party software and hardware.
2.14 OTHER LIABILITIES
(In crore)
| Particulars |
As at |
| |
June 30, 2023 |
March 31, 2023 |
| Non-current |
|
|
| Others |
|
|
| Deferred income - government grants |
63 |
43 |
| Accrued defined benefit liability |
280 |
445 |
| Deferred income |
6 |
6 |
| Others |
7 |
6 |
| Total non-current other liabilities |
356 |
500 |
| Current |
|
|
| Unearned revenue |
7,330 |
7,163 |
| Others |
|
|
| Withholding taxes and others |
3,975 |
3,632 |
| Accrued defined benefit liability |
4 |
4 |
| Deferred income - government grants |
11 |
29 |
| Others |
2 |
2 |
| Total current other liabilities |
11,322 |
10,830 |
| Total other liabilities
|
11,678 |
11,330 |
2.15 PROVISIONS
Accounting policy
A provision is recognized if, as a
result of a past
event, the Group has a present legal or constructive obligation that is reasonably estimable, and it is probable
that an outflow of economic
benefits will be required to settle the obligation. Provisions are determined by discounting the expected future
cash flows at a pre-tax
rate that reflects current market assessments of the time value of money and the risks specific to the liability.
a. Post sales client support
The Group provides its clients with
a fixed-period
post sales support on its fixed-price, fixed-timeframe contracts. Costs associated with such support services are
accrued at the time
related revenues are recorded and included in Consolidated Statement of Profit and Loss. The Group estimates such
costs based on historical
experience and estimates are reviewed on a periodic basis for any material changes in assumptions and likelihood of
occurrence.
b. Onerous
contracts
Provisions for onerous contracts
are recognized when
the expected benefits to be derived by the Group from a contract are lower than the unavoidable costs of meeting the
future obligations
under the contract. Provisions for estimated losses, if any, on incomplete contracts are recorded in the period in
which such losses become
probable based on the estimated efforts or costs to complete the contract. The provision is measured at the present
value of the lower
of the expected cost of terminating the contract and the expected net cost of continuing with the contract. Before a
provision is established
the Group recognizes any impairment loss on the assets associated with that contract.
Provision for post-sales client
support and other
provisions:
(In crore)
| Particulars |
As at |
| |
June 30, 2023 |
March 31, 2023 |
| Current |
|
|
| Others |
|
|
| Post-sales client support and other provisions |
1,538 |
1,307 |
| Total provisions |
1,538 |
1,307 |
Provision for post sales client
support and other provisions
majorly represents costs associated with providing sales support services which are accrued at the time of
recognition of revenues and
are expected to be utilized over a period of 1 year.
Provision for post sales client
support and other provisions
is included in cost of sales in the condensed consolidated statement of profit and loss.
2.16 INCOME TAXES
Accounting policy
Income tax expense comprises
current and deferred income
tax. Income tax expense is recognized in net profit in the Consolidated Statement of Profit and Loss except to the
extent that it relates
to items recognized directly in equity, in which case it is recognized in equity or other comprehensive income.
Current income tax for
current and prior periods is recognized at the amount expected to be paid to or recovered from the tax authorities,
using the tax rates
and tax laws that have been enacted or substantively enacted by the Balance Sheet date. Deferred income tax assets
and liabilities are
recognized for all temporary differences arising between the tax bases of assets and liabilities and their carrying
amounts in the financial
statements except when the deferred income tax arises from the initial recognition of goodwill or an asset or
liability in a transaction
that is not a business combination and affects neither accounting nor taxable profit or loss at the time of the
transaction. Deferred
tax assets are reviewed at each reporting date and are reduced to the extent that it is no longer probable that the
related tax benefit
will be realized.
Deferred income tax assets and
liabilities are measured
using tax rates and tax laws that have been enacted or substantively enacted by the Balance Sheet date and are
expected to apply to taxable
income in the years in which those temporary differences are expected to be recovered or settled. The effect of
changes in tax rates on
deferred income tax assets and liabilities is recognized as income or expense in the period that includes the
enactment or the substantive
enactment date. A deferred income tax asset is recognized to the extent that it is probable that future taxable
profit will be available
against which the deductible temporary differences and tax losses can be utilized. Deferred income taxes are not
provided on the undistributed
earnings of subsidiaries and branches where it is expected that the earnings of the subsidiary or branch will not be
distributed in the
foreseeable future.
The Group offsets current tax
assets and current tax
liabilities; deferred tax assets and deferred tax liabilities, where it has a legally enforceable right to set off
the recognized amounts
and where it intends either to settle on a net basis, or to realize the asset and settle the liability
simultaneously. The income tax
provision for the interim period is made based on the best estimate of the annual average tax rate expected to be
applicable for the full
financial year. Tax benefits of deductions earned on exercise of employee share options in excess of compensation
charged to income are
credited to equity.
Income tax expense in the
Consolidated Statement of
Profit and Loss comprises:
(In crore)
| Particulars |
Three months ended June 30, |
| |
2023 |
2022 |
| Current taxes |
2,307 |
2,350 |
| Deferred taxes |
110 |
(178) |
| Income tax expense |
2,417 |
2,172 |
Income tax expense for the three
months ended June
30, 2023 and June 30, 2022 includes reversals (net of provisions) of 15 crore and provisions (net of reversals) of 35 crore,
respectively. These provisions and reversals pertaining to prior periods are primarily on account of adjudication of
certain disputed
matters, upon filing of tax return and completion of assessments, across various jurisdictions.
Deferred income tax for the three
months ended June
30, 2023 and June 30, 2022 substantially relates to origination and reversal of temporary differences.
The Company’s Advanced
Pricing Arrangement (APA)
with the Internal Revenue Service (IRS) for US branch income tax expired in March 2021. The Company has applied for
renewal of APA and
currently the US taxable income is based on the Company’s best estimate determined based on the expected value
method.
2.17 REVENUE FROM OPERATIONS
Accounting policy
The Group derives revenues
primarily from IT services
comprising software development and related services, cloud and infrastructure services, maintenance, consulting and
package implementation,
licensing of software products and platforms across the Group’s core and digital offerings (together called as
“software related
services”) and business process management services. Contracts with customers are either on a
time-and-material, unit of work, fixed-price
or on a fixed-timeframe basis.
Revenues from customer contracts
are considered for
recognition and measurement when the contract has been approved in writing by the parties, to the contract, the
parties to contract are
committed to perform their respective obligations under the contract, and the contract is legally enforceable.
Revenue is recognized upon
transfer of control of promised products or services (“performance obligations”) to customers in an
amount that reflects the
consideration the Group has received or expects to receive in exchange for these products or services
(“transaction price”).
When there is uncertainty as to collectability, revenue recognition is postponed until such uncertainty is resolved.
The Group assesses the services
promised in a contract
and identifies distinct performance obligations in the contract. The Group allocates the transaction price to each
distinct performance
obligation based on the relative standalone selling price. The price that is regularly charged for an item when sold
separately is the
best evidence of its standalone selling price. In the absence of such evidence, the primary method used to estimate
standalone selling
price is the expected cost plus a margin, under which the Group estimates the cost of satisfying the performance
obligation and then adds
an appropriate margin based on similar services.
The Group’s contracts may
include variable consideration
including rebates, volume discounts and penalties. The Group includes variable consideration as part of transaction
price when there is
a basis to reasonably estimate the amount of the variable consideration and when it is probable that a significant
reversal of cumulative
revenue recognized will not occur when the uncertainty associated with the variable consideration is resolved.
Revenue on time-and-material and
unit of work based
contracts, are recognized as the related services are performed. Fixed price maintenance revenue is recognized
ratably either on a straight-line
basis when services are performed through an indefinite number of repetitive acts over a specified period or ratably
using a percentage
of completion method when the pattern of benefits from the services rendered to the customer and the Group’s
costs to fulfil the
contract is not even through the period of contract because the services are generally discrete in nature and not
repetitive. Revenue
from other fixed-price, fixed-timeframe contracts, where the performance obligations are satisfied over time is
recognized using the percentage-of-completion
method. Efforts or costs expended are used to determine progress towards completion as there is a direct
relationship between input and
productivity. Progress towards completion is measured as the ratio of costs or efforts incurred to date
(representing work performed)
to the estimated total costs or efforts. Estimates of transaction price and total costs or efforts are continuously
monitored over the
term of the contracts and are recognized in net profit in the period when these estimates change or when the
estimates are revised. Revenues
and the estimated total costs or efforts are subject to revision as the contract progresses. Provisions for
estimated losses, if any,
on incomplete contracts are recorded in the period in which such losses become probable based on the estimated
efforts or costs to complete
the contract.
The billing schedules agreed with
customers include
periodic performance based billing and / or milestone based progress billings. Revenues in excess of billing are
classified as unbilled
revenue while billing in excess of revenues are classified as contract liabilities (which we refer to as unearned
revenues).
In arrangements for software
development and related
services and maintenance services, by applying the revenue recognition criteria for each distinct performance
obligation, the arrangements
with customers generally meet the criteria for considering software development and related services as distinct
performance obligations.
For allocating the transaction price, the Group measures the revenue in respect of each performance obligation of a
contract at its relative
standalone selling price. The price that is regularly charged for an item when sold separately is the best evidence
of its standalone
selling price. In cases where the Group is unable to determine the standalone selling price, the Group uses the
expected cost plus margin
approach in estimating the standalone selling price. For software development and related services, the performance
obligations are satisfied
as and when the services are rendered since the customer generally obtains control of the work as it progresses.
Certain cloud and infrastructure
services contracts
include multiple elements which may be subject to other specific accounting guidance, such as leasing guidance.
These contracts are accounted
in accordance with such specific accounting guidance. In such arrangements where the Group is able to determine that
hardware and services
are distinct performance obligations, it allocates the consideration to these performance obligations on a relative
standalone selling
price basis. In the absence of standalone selling price, the Group uses the expected cost-plus margin approach in
estimating the standalone
selling price. When such arrangements are considered as a single performance obligation, revenue is recognized over
the period and measure
of progress is determined based on promise in the contract.
Revenue from licenses where the
customer obtains a
“right to use” the licenses is recognized at the time the license are made available to the customer.
Revenue from licenses
where the customer obtains a “right to access” is recognized over the access period.
Arrangements to deliver software
products generally
have three elements: license, implementation and Annual Technical Services (ATS).When implementation services are
provided in conjunction
with the licensing arrangement and the license and implementation have been identified as two distinct separate
performance obligations,
the transaction price for such contracts are allocated to each performance obligation of the contract based on their
relative standalone
selling prices. In the absence of standalone selling price for implementation, the Group uses the expected cost plus
margin approach in
estimating the standalone selling price. Where the license is required to be substantially customized as part of the
implementation service
the entire arrangement fee for license and implementation is considered to be a single performance obligation and
the revenue is recognized
using the percentage-of-completion method as the implementation is performed. Revenue from client training, support
and other services
arising due to the sale of software products is recognized as the performance obligations are satisfied. ATS revenue
is recognized ratably
on a straight line basis over the period in which the services are rendered.
Contracts with customers includes
subcontractor services
or third-party vendor equipment or software in certain integrated services arrangements. In these types of
arrangements, revenue from
sales of third-party vendor products or services is recorded net of costs when the Group is acting as an agent
between the customer and
the vendor, and gross when the Group is the principal for the transaction. In doing so, the group first evaluates
whether it controls
the good or service before it is transferred to the customer. The Group considers whether it has the primary
obligation to fulfil the
contract, inventory risk, pricing discretion and other factors to determine whether it controls the goods or service
and therefore is
acting as a principal or an agent.
The incremental costs of obtaining
a contract (i.e.,
costs that would not have been incurred if the contract had not been obtained) are recognized as an asset if the
Group expects to recover
them.
Certain eligible, nonrecurring
costs (e.g. set-up or
transition or transformation costs) that do not represent a separate performance obligation are recognized as an
asset when such costs
(a) relate directly to the contract; (b) generate or enhance resources of the Group that will be used in satisfying
the performance obligation
in the future; and (c) are expected to be recovered.
Capitalized contract costs relating
to upfront payments
to customers are amortized to revenue and other capitalized costs are amortized to expenses over the respective
contract life on a systematic
basis consistent with the transfer of goods or services to customer to which the asset relates. Capitalized costs
are monitored regularly
for impairment. Impairment losses are recorded when present value of projected remaining operating cash flows is not
sufficient to recover
the carrying amount of the capitalized costs.
The Group presents revenues net of
indirect taxes in
its Consolidated Statement of Profit and Loss.
Revenue from operation for the
three months ended June
30, 2023 and June 30, 2022 are as follows:
(In crore)
| Particulars |
Three
months ended June 30, |
| |
2023
|
2022
|
| Revenue from software services |
35,735 |
32,278 |
| Revenue from products and platforms |
2,198 |
2,192 |
| Total
revenue from operations |
37,933 |
34,470 |
Products & platforms
The Group also derives revenues
from the sale of products
and platforms including Finacle – core banking solution, Edge Suite of products, Panaya platform, Infosys
Equinox, Infosys Helix,
Infosys Applied AI, Infosys Cortex, Stater digital platform and Infosys McCamish – insurance platform.
Disaggregated revenue
information
Revenue disaggregation by business
segments has been
included in segment information (Refer to Note 2.24). The table below presents disaggregated revenues from
contracts with customers
by geography and contract type. The Group believes that this disaggregation best depicts how the nature, amount,
timing and uncertainty
of revenues and cash flows are affected by industry, market and other economic factors.
For the three months ended June 30,
2023 and June 30,
2022:
(In crore)
| Particulars |
Three
months ended June 30, |
|
|
2023
|
2022 |
| Revenues by Geography* |
|
|
| North America |
23,084 |
21,301 |
| Europe |
10,148 |
8,647 |
| India |
1,020 |
881 |
| Rest of the world |
3,681 |
3,641 |
|
Total |
37,933 |
34,470 |
| * |
|
Geographical revenue is based on the domicile of customer |
The percentage of revenue from
fixed-price contracts
for each of the quarter ended June 30, 2023 and June 30, 2022 is 52%.
Trade Receivables and Contract
Balances
The timing of revenue recognition,
billings and cash
collections results in receivables, unbilled revenue, and unearned revenue on the Group’s Consolidated Balance
Sheet. Amounts are
billed as work progresses in accordance with agreed-upon contractual terms, either at periodic intervals (e.g.,
monthly or quarterly)
or upon achievement of contractual milestones.
The Group’s receivables are
rights to consideration
that are unconditional. Unbilled revenues comprising revenues in excess of billings from time and material contracts
and fixed price maintenance
contracts are classified as financial asset when the right to consideration is unconditional and is due only after a
passage of time.
Invoicing to the clients for other
fixed price contracts
is based on milestones as defined in the contract and therefore the timing of revenue recognition is different from
the timing of invoicing
to the customers. Therefore unbilled revenues for other fixed price contracts (contract asset) are classified as
non-financial asset because
the right to consideration is dependent on completion of contractual milestones.
Invoicing in excess of earnings are
classified as unearned
revenue.
Trade receivables and unbilled
revenues are presented
net of impairment in the consolidated Balance Sheet.
2.18 OTHER INCOME, NET
Accounting policy
Other income is comprised primarily
of interest income,
dividend income, gain/loss on investment and exchange gain/loss on forward and options contracts and on translation
of foreign currency
assets and liabilities. Interest income is recognized using the effective interest method. Dividend income is
recognized when the right
to receive payment is established.
Foreign currency
Accounting policy
Functional currency
The functional currency of Infosys,
Infosys BPM, EdgeVerve,
Skava and controlled trusts is the Indian rupee. The functional currencies for foreign subsidiaries are their
respective local currencies.
These financial statements are presented in Indian rupees (rounded off to crore; one crore equals ten million).
Transactions and
translations
Foreign-currency denominated
monetary assets and liabilities
are translated into the relevant functional currency at exchange rates in effect at the Balance Sheet date. The
gains or losses resulting
from such translations are recognized in the Consolidated Statement of Profit and Loss and reported within exchange
gains/ (losses) on
translation of assets and liabilities, net, except when deferred in Other Comprehensive Income as qualifying cash
flow hedges. Non-monetary
assets and non-monetary liabilities denominated in a foreign currency and measured at fair value are translated at
the exchange rate prevalent
at the date when the fair value was determined. Non-monetary assets and non-monetary liabilities denominated in a
foreign currency and
measured at historical cost are translated at the exchange rate prevalent at the date of transaction. The related
revenue and expense
are recognized using the same exchange rate.
Transaction gains or losses
realized upon settlement
of foreign currency transactions are included in determining net profit for the period in which the transaction is
settled. Revenue, expense
and cash-flow items denominated in foreign currencies are translated into the relevant functional currencies using
the exchange rate in
effect on the date of the transaction.
The translation of financial
statements of the foreign
subsidiaries to the presentation currency is performed for assets and liabilities using the exchange rate in effect
at the Balance Sheet
date and for revenue, expense and cash-flow items using the average exchange rate for the respective periods. The
gains or losses resulting
from such translation are included in currency translation reserves under other components of equity. When a
subsidiary is disposed off,
in full, the relevant amount is transferred to net profit in the Consolidated Statement of Profit and Loss. However
when a change in the
parent's ownership does not result in loss of control of a subsidiary, such changes are recorded through equity.
Other Comprehensive Income, net of
taxes includes translation
differences on non-monetary financial assets measured at fair value at the reporting date, such as equities
classified as financial instruments
and measured at fair value through other comprehensive income (FVOCI).
Goodwill and fair value adjustments
arising on the
acquisition of a foreign entity are treated as assets and liabilities of the foreign entity and translated at the
exchange rate in effect
at the Balance Sheet date.
Government grant
The Group recognizes government
grants only when there
is reasonable assurance that the conditions attached to them shall be complied with, and the grants will be
received. Government grants
related to assets are treated as deferred income and are recognized in net profit in the Consolidated Statement of
Profit and Loss on
a systematic and rational basis over the useful life of the asset. Government grants related to revenue are
recognized on a systematic
basis in net profit in the Consolidated Statement of Profit and Loss over the periods necessary to match them with
the related costs which
they are intended to compensate.
Other income for the three months
ended June 30, 2023
and June 30, 2022 is as follows:
(In crore)
| Particulars |
Three months ended June 30, |
| |
2023
|
2022 |
| Interest income on financial assets carried at amortized cost
|
|
|
| Tax free bonds and Government bonds |
34 |
37 |
| Deposit with Bank and others |
240 |
202 |
| Interest income on financial assets carried at fair value
through other comprehensive income |
|
|
Non-convertible debentures, commercial paper, certificates of
deposit and government securities |
243 |
240 |
| Income on investments carried at fair value
through profit or loss |
|
|
| Gain / (loss) on liquid mutual funds and other investments |
52 |
8 |
| Income on investments carried at fair value through other
comprehensive income |
– |
1 |
| Exchange gains / (losses) on forward and options contracts |
134 |
(290) |
| Exchange gains / (losses) on translation of other assets and
liabilities |
(137) |
417 |
| Miscellaneous income, net |
(5) |
61 |
| Total other income |
561 |
676 |
2.19 EXPENSES
Accounting policy
Gratuity and Pensions
The Group provides for gratuity, a
defined benefit
retirement plan ('the Gratuity Plan') covering eligible employees majorly of Infosys and its Indian subsidiaries.
The Gratuity Plan provides
a lump-sum payment to vested employees at retirement, death, incapacitation or termination of employment, of an
amount based on the respective
employee's salary and the tenure of employment with the Group. The Company contributes Gratuity liabilities to the
Infosys Limited Employees'
Gratuity Fund Trust (the Trust). In case of Infosys BPM and EdgeVerve, contributions are made to the Infosys BPM
Employees' Gratuity Fund
Trust and EdgeVerve Systems Limited Employees' Gratuity Fund Trust, respectively. Trustees administer contributions
made to the Trusts
and contributions are invested in a scheme with the Life Insurance Corporation of India as permitted by Indian law.
The Group operates defined benefit
pension plan in
certain overseas jurisdictions, in accordance with the local laws. These plans are managed by third party fund
managers. The plans provide
for periodic payouts after retirement and/or for a lumpsum payment as set out in rules of each fund and includes
death and disability
benefits. The defined benefit plans require contributions which are based on a percentage of salary that varies
depending on the age of
the respective employees.
Liabilities with regard to these
defined benefit plans
are determined by actuarial valuation, performed by an independent actuary, at each Balance Sheet date using the
projected unit credit
method. These defined benefit plans expose the Group to actuarial risks, such as longevity risk, interest rate risk
and market risk.
The Group recognizes the net
obligation of a defined
benefit plan in its Balance Sheet as an asset or liability. Gains and losses through re-measurements of the net
defined benefit liability
/ (asset) are recognized in other comprehensive income and are not reclassified to profit or loss in subsequent
periods. The actual return
of the portfolio of plan assets, in excess of the yields computed by applying the discount rate used to measure the
defined benefit obligation
is recognized in other comprehensive income. The effect of any plan amendments is recognized in net profit in the
Consolidated Statement
of Profit and Loss.
Provident fund
Eligible employees of Infosys
receive benefits from
a provident fund, which is a defined benefit plan. Both the eligible employee and the Company make monthly
contributions to the provident
fund plan equal to a specified percentage of the covered employee's salary. The Company contributes a portion to the
Infosys Limited Employees'
Provident Fund Trust. The trust invests in specific designated instruments as permitted by Indian law. The remaining
portion is contributed
to the government administered pension fund. The rate at which the annual interest is payable to the beneficiaries
by the trust is being
administered by the Government of India. The Company has an obligation to make good the shortfall, if any, between
the return from the
investments of the trust and the notified interest rate.
In respect of Indian subsidiaries,
eligible employees
receive benefits from a provident fund, which is a defined contribution plan. Both the eligible employee and the
respective companies
make monthly contributions to this provident fund plan equal to a specified percentage of the covered employee's
salary. Amounts collected
under the provident fund plan are deposited in a government administered provident fund. The Companies have no
further obligation to the
plan beyond its monthly contributions.
Superannuation
Certain employees of Infosys,
Infosys BPM and EdgeVerve
are participants in a defined contribution plan. The Group has no further obligations to the plan beyond its monthly
contributions which
are periodically contributed to a trust fund, the corpus of which is invested with the Life Insurance Corporation of
India.
Compensated absences
The Group has a policy on
compensated absences which
are both accumulating and non-accumulating in nature. The expected cost of accumulating compensated absences is
determined by actuarial
valuation performed by an independent actuary at each Balance Sheet date using projected unit credit method on the
additional amount expected
to be paid/availed as a result of the unused entitlement that has accumulated at the Balance Sheet date. Expense on
non-accumulating compensated
absences is recognized in the period in which the absences occur.
(In crore)
| Particulars |
Three months ended June 30, |
| |
2023
|
2022
|
| Employee benefit expenses |
|
|
| Salaries including bonus |
19,985 |
17,589 |
| Contribution to provident and other funds |
560 |
497 |
| Share based payments to employees (Refer to Note 2.12)
|
146 |
132 |
| Staff welfare |
90 |
119 |
| |
20,781 |
18,337 |
| Cost of software packages and others |
|
|
| For own use |
489 |
444 |
| Third party items bought for service delivery to clients |
2,231 |
1,976 |
| |
2,720 |
2,420 |
| Other expenses |
|
|
| Repairs and maintenance |
324 |
286 |
| Power and fuel |
50 |
39 |
| Brand and marketing |
265 |
224 |
| Short-term leases |
21 |
18 |
| Rates and taxes |
94 |
74 |
| Consumables |
44 |
42 |
| Insurance |
53 |
42 |
| Provision for post-sales client support and others |
50 |
12 |
| Commission to non-whole time directors |
3 |
4 |
| Impairment loss recognized / (reversed) under expected credit
loss model |
91 |
44 |
| Contributions towards Corporate Social Responsibility |
70 |
60 |
| Others |
189 |
93 |
| |
1,254 |
938 |
2.20 Leases
Accounting
Policy
The Group as a lessee
The Group’s lease asset
classes consist of leases
for land, buildings and computers. The Group assesses whether a contract contains a lease, at inception of a
contract. A contract is,
or contains, a lease if the contract conveys the right to control the use of an identified asset for a period of
time in exchange for
consideration. To assess whether a contract conveys the right to control the use of an identified asset, the group
assesses whether: (1)
the contract involves the use of an identified asset (2) the Group has substantially all of the economic benefits
from use of the asset
through the period of the lease and (3) the Group has the right to direct the use of the asset.
At the date of commencement of the
lease, the Group
recognizes a right-of-use asset (“ROU”) and a corresponding lease liability for all lease arrangements
in which it is a lessee,
except for leases with a term of twelve months or less (short-term leases) and low value leases. For these
short-term and low value leases,
the Group recognizes the lease payments as an operating expense on a straight-line basis over the term of the lease.
As a lessee, the Group determines
the lease term as
the non-cancellable period of a lease adjusted with any option to extend or terminate the lease, if the use of such
option is reasonably
certain. The Group makes an assessment on the expected lease term on a lease-by-lease basis and thereby assesses
whether it is reasonably
certain that any options to extend or terminate the contract will be exercised. In evaluating the lease term, the
Group considers factors
such as any significant leasehold improvements undertaken over the lease term, costs relating to the termination of
the lease and the
importance of the underlying asset to Group’s operations taking into account the location of the underlying
asset and the availability
of suitable alternatives. The lease term in future periods is reassessed to ensure that the lease term reflects the
current economic circumstances.
Certain lease arrangements includes
the options to
extend or terminate the lease before the end of the lease term. ROU assets and lease liabilities includes these
options when it is reasonably
certain that they will be exercised.
The right-of-use assets are
initially recognized at
cost, which comprises the initial amount of the lease liability adjusted for any lease payments made at or prior to
the commencement date
of the lease plus any initial direct costs less any lease incentives. They are subsequently measured at cost less
accumulated depreciation
and impairment losses.
Right-of-use assets are depreciated
from the commencement
date on a straight-line basis over the shorter of the lease term and useful life of the underlying asset.
Right-of-use assets are evaluated
for recoverability
whenever events or changes in circumstances indicate that their carrying amounts may not be recoverable. For the
purpose of impairment
testing, the recoverable amount (i.e. the higher of the fair value less cost to sell and the value-in-use) is
determined on an individual
asset basis unless the asset does not generate cash flows that are largely independent of those from other assets.
In such cases, the
recoverable amount is determined for the Cash Generating Unit (CGU) to which the asset belongs.
The lease liability is initially
measured at amortized
cost at the present value of the future lease payments. The lease payments are discounted using the interest rate
implicit in the lease
or, if not readily determinable, using the incremental borrowing rates in the country of domicile of these leases.
Lease liabilities are
remeasured with a corresponding adjustment to the related right-of-use asset if the Group changes its assessment if
whether it will exercise
an extension or a termination option.
Lease liability and ROU asset have
been separately
presented in the Balance Sheet and lease payments have been classified as financing cash flows.
The Group as a lessor
Leases for which the Group is a
lessor is classified
as a finance or operating lease. Whenever the terms of the lease transfer substantially all the risks and rewards of
ownership to the
lessee, the contract is classified as a finance lease. All other leases are classified as operating leases.
When the Group is an intermediate
lessor, it accounts
for its interests in the head lease and the sublease separately. The sublease is classified as a finance or
operating lease by reference
to the right-of-use asset arising from the head lease.
For operating leases, rental income
is recognized on
a straight line basis over the term of the relevant lease.
Following are the changes in the
carrying value of
right-of-use assets for the three months ended June 30, 2023:
(In crore)
| Particulars |
Category of ROU asset |
|
| |
Land |
Buildings |
Vehicles |
Computers |
Total |
| Balance as of April 1, 2023 |
623 |
3,896 |
15 |
2,348 |
6,882 |
| Additions* |
– |
244 |
2 |
557 |
803 |
| Deletions |
– |
(8) |
– |
(233) |
(241) |
| Depreciation |
(2) |
(184) |
(2) |
(192) |
(380) |
| Translation difference |
(4) |
(1) |
– |
(10) |
(15) |
| Balance as of June 30,
2023 |
617 |
3,947 |
15 |
2,470 |
7,049 |
| * |
|
Net of adjustments on account of modifications and lease incentives |
Following are the changes in the
carrying value of
right-of-use assets for the three months ended June 30, 2022:
(In crore)
| Particulars |
Category of ROU asset |
|
| |
Land |
Buildings |
Vehicles |
Computers |
Total |
| Balance as of April 1, 2022 |
628 |
3,711 |
16 |
468 |
4,823 |
| Additions* |
– |
419 |
1 |
352 |
772 |
| Deletions |
– |
(1) |
– |
(76) |
(77) |
| Depreciation |
(1) |
(162) |
(3) |
(59) |
(225) |
| Translation difference |
(1) |
(10) |
– |
1 |
(10) |
| Balance as of June 30,
2022 |
626 |
3,957 |
14 |
686 |
5,283 |
| * |
|
Net of adjustments on account of modifications and lease incentives |
The aggregate depreciation expense
on ROU assets is
included under depreciation and amortization expense in the interim condensed Consolidated Statement of Profit and
Loss.
The following is the break-up of
current and non-current
lease liabilities as at June 30, 2023 and March 31, 2023:
(In crore)
| Particulars |
As at |
| |
June 30,
2023 |
March 31,
2023 |
| Current lease liabilities |
1,824 |
1,242 |
| Non-current lease liabilities |
6,659 |
7,057 |
| Total |
8,483 |
8,299 |
2.21 BASIC AND DILUTED SHARES USED IN COMPUTING EARNINGS PER EQUITY SHARE
Accounting policy
Basic earnings per equity share is
computed by dividing
the net profit attributable to the equity holders of the Group by the weighted average number of equity shares
outstanding during the
period. Diluted earnings per equity share is computed by dividing the net profit attributable to the equity holders
of the Group by the
weighted average number of equity shares considered for deriving basic earnings per equity share and also the
weighted average number
of equity shares that could have been issued upon conversion of all dilutive potential equity shares. The dilutive
potential equity shares
are adjusted for the proceeds receivable had the equity shares been actually issued at fair value (i.e. the average
market value of the
outstanding equity shares). Dilutive potential equity shares are deemed converted as at the beginning of the period,
unless issued at
a later date. Dilutive potential equity shares are determined independently for each period presented.
The number of equity shares and
potentially dilutive
equity shares are adjusted retrospectively for all periods presented for any share splits and bonus shares issues
including for changes
effected prior to the approval of the financial statements by the Board of Directors.
2.22 CONTINGENT LIABILITIES AND
COMMITMENTS
Accounting policy
Contingent liability is a possible
obligation arising
from past events and whose existence will be confirmed only by the occurrence or non-occurrence of one or more
uncertain future events
not wholly within the control of the entity or a present obligation that arises from past events but is not
recognized because it is not
probable that an outflow of resources embodying economic benefits will be required to settle the obligation or the
amount of the obligation
cannot be measured with sufficient reliability.
(In crore)
| Particulars |
As at |
|
|
June 30, 2023 |
March 31, 2023 |
| Contingent liabilities : |
|
|
| Claims against the Group, not acknowledged as
debts(1) |
4,794 |
4,762 |
| [Amount paid to statutory authorities 6,508 crore (6,539 crore)] |
|
|
| Commitments : |
|
|
| Estimated amount of contracts remaining to be executed on
capital contracts and not provided for (net of advances and deposits)(2) |
861 |
959 |
| Other commitments* |
88 |
92 |
| * |
|
Uncalled capital pertaining to investments |
| (1) |
|
As at June 30, 2023 and March 31, 2023, claims against the Group not acknowledged as debts
in respect of income tax matters amounted to 4,066 crore
and 4,062 crore, respectively.
The claims against the Group
primarily represent demands
arising on completion of assessment proceedings under the Income Tax Act, 1961. These claims are on account of
multiple issues of disallowances
such as disallowance of profits earned from STP Units and SEZ Units, disallowance of deductions in respect of
employment of new employees
under section 80JJAA, disallowance of expenditure towards software being held as capital in nature, payments
made to Associated Enterprises
held as liable for withholding of taxes. These matters are pending before various Income Tax Authorities and
the Management including
its tax advisors expect that its position will likely be upheld on ultimate resolution and will not have a
material adverse effect on
the Group's financial position and results of operations.
Amount paid to statutory
authorities against the tax
claims amounted to 6,498 crore
and 6,528 crore as at June 30,
2023 and March 31, 2023, respectively.
|
| (2) |
|
Capital contracts primarily comprises of commitments for infrastructure facilities
and computer
equipments. |
Legal Proceedings
The Group is subject to legal
proceedings and claims,
which have arisen in the ordinary course of business. The Group’s management reasonably expects that these
legal actions, when ultimately
concluded and determined, will not have a material and adverse effect on the Group’s results of operations or
financial condition.
2.23 RELATED PARTY
TRANSACTIONS
Refer to the Company's Annual
Report for the year ended
March 31, 2023 for the full names and other details of the Company's subsidiaries and controlled trusts.
Changes in Subsidiaries
During the three months ended June
30, 2023, there
are no changes in the subsidiaries.
Changes in key management
personnel
The following are the changes in
the key management
personnel:
Independent directors:
| - |
|
Helene Auriol Potier (appointed as independent director effective May 26, 2023) |
Executive Officers:
| - |
|
Mohit Joshi (resigned as President effective March 11, 2023 and was on leave till
June 9,
2023 which was his last date with the company) |
Transaction with key management
personnel:
The table below describes the
compensation to key management
personnel which comprise directors and executive officers:
(In crore)
| Particulars |
Three months ended June 30, |
| |
2023 |
2022 |
| Salaries and other short term employee benefits to whole-time
directors and executive officers (1)(2) |
32 |
32 |
| Commission and other benefits to non-executive/independent
directors |
4 |
4 |
| Total |
36 |
36 |
| (1) |
|
Total employee stock compensation expense for the three months ended June 30,
2023 and
June 30, 2022 includes a charge of 20 crore and 17
crore, respectively, towards key management personnel (Refer to Note 2.12). |
| (2) |
|
Does not include post-employment benefits and other long-term benefits based on
actuarial
valuation as these are done for the Company as a whole. |
2.24 SEGMENT REPORTING
Ind AS 108, Operating segments,
establishes standards
for the way that public business enterprises report information about operating segments and related disclosures
about products and services,
geographic areas, and major customers. The Group's operations predominantly relate to providing end-to-end business
solutions to enable
clients to enhance business performance. The Chief Operating Decision Maker (CODM) evaluates the Group's performance
and allocates resources
based on an analysis of various performance indicators by business segments. Accordingly, information has been
presented along business
segments. The accounting principles used in the preparation of the financial statements are consistently applied to
record revenue and
expenditure in individual segments, and are as set out in the accounting policies.
Business segments of the Group are
primarily enterprises
in Financial Services and Insurance, enterprises in Manufacturing, enterprises in Retail, Consumer Packaged Goods
and Logistics, enterprises
in the Energy, Utilities, Resources and Services, enterprises in Communication, Telecom OEM and Media, enterprises
in Hi-Tech, enterprises
in Life Sciences and Healthcare and all other segments. The Financial services reportable segments has been
aggregated to include the
Financial Services operating segment and Finacle operating segment because of the similarity of the economic
characteristics. All other
segments represent the operating segments of businesses in India, Japan, China, Infosys Public Services & other
enterprises in Public
Services.
Revenue and identifiable operating
expenses in relation
to segments are categorized based on items that are individually identifiable to that segment. Revenue for 'all
other segments' represents
revenue generated by Infosys Public services and revenue generated from customers located in India, Japan and China
and other enterprises
in Public services. Allocated expenses of segments include expenses incurred for rendering services from the Group's
offshore software
development centers and on-site expenses, which are categorized in relation to the associated efforts of the
segment. Certain expenses
such as depreciation and amortization, which form a significant component of total expenses, are not specifically
allocable to specific
segments as the underlying assets are used interchangeably. The Management believes that it is not practical to
provide segment disclosures
relating to those costs and expenses, and accordingly these expenses are separately disclosed as
"unallocated" and adjusted
against the total income of the Group.
Assets and liabilities used in the
Group's business
are not identified to any of the reportable segments, as these are used interchangeably between segments. The
Management believes that
it is currently not practicable to provide segment disclosures relating to total assets and liabilities since a
meaningful segregation
of the available data is onerous.
Business segment revenue
information is collated based
on individual customers invoiced or in relation to which the revenue is otherwise recognized.
Disclosure of revenue by geographic
locations is given
in note 2.17 Revenue from operations.
Business Segments
Three months ended June 30, 2023
and June 30, 2022:
(In crore)
|
Particulars |
Financial
Services (1) |
Retail
(2) |
Communication (3) |
Energy,
Utilities, Resources and Services |
Manufacturing |
Hi-Tech |
Life
Sciences (4) |
All other
segments (5) |
Total
|
| Revenue from operations |
10,661 |
5,513 |
4,441 |
4,889 |
5,350 |
3,056 |
2,749 |
1,274 |
37,933 |
| |
10,562 |
5,004 |
4,464 |
4,259 |
4,172 |
2,812 |
2,257 |
940 |
34,470 |
| Identifiable operating expenses |
6,147 |
2,869 |
2,640 |
2,690 |
3,523 |
1,743 |
1,593 |
819 |
22,024 |
| |
5,856 |
2,524 |
2,867 |
2,276 |
2,973 |
1,675 |
1,334 |
662 |
20,167 |
| Allocated expenses |
1,969 |
1,015 |
817 |
909 |
855 |
511 |
454 |
315 |
6,845 |
| |
1,952 |
942 |
803 |
838 |
814 |
465 |
388 |
237 |
6,439 |
| Segment operating income |
2,545 |
1,629 |
984 |
1,290 |
972 |
802 |
702 |
140 |
9,064 |
| |
2,754 |
1,538 |
794 |
1,145 |
385 |
672 |
535 |
41 |
7,864 |
| Unallocable expenses |
|
|
|
|
|
|
|
|
1,173 |
| |
|
|
|
|
|
|
|
|
950 |
| Other income, net (Refer to Note
2.18) |
|
|
|
|
|
|
|
|
561 |
| |
|
|
|
|
|
|
|
|
676 |
| Finance cost |
|
|
|
|
|
|
|
|
90 |
| |
|
|
|
|
|
|
|
|
56 |
| Profit before tax |
|
|
|
|
|
|
|
|
8,362 |
| |
|
|
|
|
|
|
|
|
7,534 |
| Income tax expense |
|
|
|
|
|
|
|
|
2,417 |
| |
|
|
|
|
|
|
|
|
2,172 |
| Net Profit |
|
|
|
|
|
|
|
|
5,945 |
| |
|
|
|
|
|
|
|
|
5,362 |
| Depreciation and amortization |
|
|
|
|
|
|
|
|
1,173 |
| |
|
|
|
|
|
|
|
|
950 |
| Non-cash
expenses other than depreciation and amortization |
|
|
|
|
|
|
|
|
– |
| (1) |
|
Financial Services include enterprises in Financial Services and Insurance
|
| (2) |
|
Retail includes enterprises in Retail, Consumer Packaged Goods and
Logistics |
| (3) |
|
Communication includes enterprises in Communication, Telecom OEM and Media
|
| (4) |
|
Life Sciences includes enterprises in Life sciences and Health care |
| (5) |
|
Others include operating segments of businesses in India, Japan, China, Infosys
Public
Services & other enterprises in Public Services |
Significant clients
No client individually accounted
for more than 10%
of the revenues for the three months ended June 30, 2023 and June 30, 2022, respectively.
2.25 FUNCTION WISE CLASSIFICATION
OF CONDENSED CONSOLIDATED
STATEMENT OF PROFIT AND LOSS
(In crore)
| Particulars |
Note No. |
Three months ended June 30, |
| |
|
2023 |
2022 |
| Revenue from operations |
2.16 |
37,933 |
34,470 |
| Cost of Sales |
|
26,382 |
24,369 |
| Gross profit |
|
11,551 |
10,101 |
| Operating expenses |
|
|
|
| Selling and marketing expenses |
|
1,783 |
1,493 |
| General and administration expenses |
|
1,877 |
1,694 |
| Total operating expenses |
|
3,660 |
3,187 |
| Operating profit |
|
7,891 |
6,914 |
| Other income, net |
2.17 |
561 |
676 |
| Finance cost |
|
90 |
56 |
| Profit before tax |
|
8,362 |
7,534 |
| Tax expense: |
|
|
|
| Current tax |
2.15 |
2,307 |
2,350 |
| Deferred tax |
2.15 |
110 |
(178) |
| Profit for the period |
|
5,945 |
5,362 |
| Other comprehensive income |
|
|
|
| Items that will not be reclassified subsequently to profit or
loss |
|
|
|
| Remeasurement of the net defined benefit liability/asset, net
|
|
87 |
(86) |
| Equity instruments through other comprehensive income, net |
|
1 |
3 |
| |
|
88 |
(83) |
| Items that will be reclassified subsequently to profit or
loss |
|
|
|
| Fair value changes on derivatives designated as cash flow hedge,
net |
|
6 |
26 |
| Exchange differences on translation of foreign operations, net
|
|
15 |
53 |
| Fair value changes on investments, net |
|
75 |
(372) |
| |
|
96 |
(293) |
| Total other comprehensive income / (loss), net of tax
|
|
184 |
(376) |
| Total comprehensive income for the period |
|
6,129 |
4,986 |
| Profit attributable to: |
|
|
|
| Owners of the Company |
|
5,945 |
5,360 |
| Non-controlling interests |
|
– |
2 |
| |
|
5,945 |
5,362 |
| Total comprehensive income attributable to: |
|
|
|
| Owners of the Company |
|
6,132 |
4,986 |
| Non-controlling interests |
|
(3) |
– |
| |
|
6,129 |
4,986 |
for and on behalf of the Board of
Directors of Infosys
Limited
|
Nandan M. Nilekani
Chairman
|
Salil Parekh
Chief Executive Officer
and Managing Director
|
Bobby Parikh
Director
|
| |
|
|
|
Nilanjan Roy
Chief Financial Officer
|
Jayesh Sanghrajka
Executive Vice President
and
Deputy Chief Financial
Officer
|
A.G.S. Manikantha
Company Secretary
|
| |
|
|
|
Bengaluru
July 20, 2023
|
|
|
Infosys (NYSE:INFY)
Historical Stock Chart
From Jun 2024 to Jul 2024

Infosys (NYSE:INFY)
Historical Stock Chart
From Jul 2023 to Jul 2024
