Toyota Profits Down 30.5% in FY12 - Analyst Blog
May 09 2012 - 10:43AM
Zacks
Toyota Motor Corp. (TM) posted a 30.5% decline
in profits to ¥283.56 billion ($3.7 billion) or ¥90.20 ($1.17) per
share in its fiscal year ended March 31, 2012 compared with ¥408.18
billion or ¥130.16 in the prior fiscal year. With this, the company
has missed the Zacks Consensus Estimate of $2.52 per share for the
year.
Consolidated revenues in the year dipped marginally by 2% to
¥18.58 trillion ($241.59 billion). Total unit sales increased 0.6%
to 7.35 million units during the fiscal year. Higher unit sales in
Japan (8%), Europe (0.3%) and Asia (6%) were more than offset by
lower sales in North America (8%) and Other reporting regions
(2%).
The decrease in revenues and profits was attributable to
challenges faced by the company owing to the earthquake in Japan
and severe flooding in Thailand in 2011 as well as unprecedented
strength of the yen.
Operating income fell 24% to ¥355.63 billion from ¥468.28
billion fiscal 2011. Marketing efforts and cost reduction efforts
each had a positive impact of ¥150.0 billion on the operating
income. However, they were offset by unfavorable changes in
exchange rates of ¥250.0 billion, an increase in expense of ¥100.0
billion and other factors of ¥62.6 billion.
Segment Results
In the Automotive segment, revenues slid 2% to ¥16.99 trillion
in the year while operating income fell 75% to ¥21.68 billion. The
decrease in operating income was mainly attributable to unfavorable
changes in exchange rates, despite cost reduction efforts.
In the Financial Services segment, revenues ebbed 8% to ¥1.10
trillion while operating income dipped 14.5% to ¥306.44 billion.
The fall in operating income was caused by valuation losses on
interest rate swaps at fair value and effects related to credit
losses including provision and reversal in sales finance
subsidiaries. In All Other businesses, revenues grew 8% to ¥1.05
billion while operating income rose 19% to ¥42.06 billion.
Financial Position
Toyota had cash and cash equivalents of ¥1.68 trillion as of
March 31, 2012, a decrease from ¥2.08 trillion as of March 31,
2011. Total debt amounted to ¥12.0 trillion as of March 31, 2012,
reflecting a debt-to-capitalization ratio of 53%, compared with
¥12.40 trillion or 54.5% as of March 31, 2011.
In fiscal 2012, Toyota’s operating net cash flow sagged 28% to
¥1.45 trillion from ¥2.02 trillion in the prior fiscal year,
primarily driven by lower profits and significant decline in
deferred income taxes. Meanwhile, capital expenditures (net)
increased to ¥686.90 billion from ¥577.98 billion a year ago.
Fiscal 2013 Guidance
For fiscal 2013 ending March 31, 2013, Toyota projected
consolidated vehicles sales to increase 1.35 million units to 8.70
million units. Consequently, the company expects higher
consolidated revenues of ¥22.00 trillion, operating income of ¥1.00
trillion yen and profits of ¥760.0 billion for the fiscal year
compared with fiscal 2012.
Our Take
Toyota is the leading automaker in the world. Its product
portfolio consists of a full range of models from passenger cars,
minivans and trucks as well as related parts and accessories. Its
domestic competitor includes Honda Motor Co. (HMC)
and Nissan Motor Co. (NSANY). Despite the
disappointing but expected results, a promising outlook led the
company to retain a Zacks #2 Rank on its shares, which translates
to a short-term (1 to 3 months) rating of Buy.
(Exchange rate: $1 = ¥76.92)
HONDA MOTOR (HMC): Free Stock Analysis Report
NISSAN ADR (NSANY): Free Stock Analysis Report
TOYOTA MOTOR CP (TM): Free Stock Analysis Report
To read this article on Zacks.com click here.
Zacks Investment Research
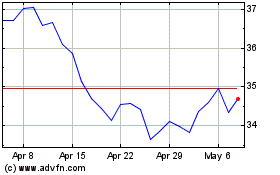
Honda Motor (NYSE:HMC)
Historical Stock Chart
From Jun 2024 to Jul 2024

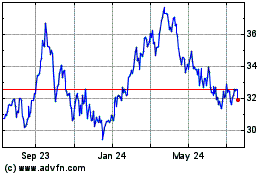
Honda Motor (NYSE:HMC)
Historical Stock Chart
From Jul 2023 to Jul 2024
