Dreyfus Strategic Municipal Bond Fund Annual Earnings Report for the Fiscal Year Ended November 30, 2014
February 03 2015 - 1:39PM
Business Wire
Dreyfus Strategic Municipal Bond Fund, Inc. (NYSE:DSM) reported
the following financial information for the fiscal year ended
November 30, 2014, compared with the results for the fiscal year
ended November 30, 2013:
YEAR ENDED NOVEMBER
30:
2014
2013
NET INVESTMENT INCOME* TOTAL $25,582,261 $26,041,267 PER SHARE
$0.52 $0.53 NET INVESTMENT INCOME AFTER DIVIDENDS PAID TO PREFERRED
SHAREHOLDERS TOTAL $25,482,818 $25,810,536 PER SHARE (COMMON STOCK)
$0.52 $0.52 NET ASSET VALUE AT END OF PERIOD NET OF PREFERRED STOCK
$420,435,341 $389,692,272 PREFERRED STOCK OUTSTANDING $93,000,000
$118,800,000 PER SHARE (COMMON STOCK) $8.57 $7.94 NET ASSET VALUE
AT BEGINNING OF PERIOD NET OF PREFERRED STOCK $389,692,272
$455,705,933 PREFERRED STOCK OUTSTANDING $118,800,000 $139,500,000
PER SHARE (COMMON STOCK) $7.94 $9.30
*Net Investment Income is calculated based on U.S. generally
accepted accounting principles, whereas income distributions are
determined in accordance with income tax regulations, which differ
from U.S. generally accepted accounting principles.
For Press Inquiries:The Dreyfus CorporationPatrice M.
Kozlowski212-922-6030orFor Other Inquiries:MBSC Securities
CorporationThe National Marketing Desk200 Park AvenueNew York, New
York 101661-800-334-6899
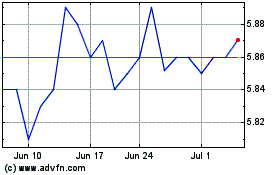
BNY Mellon Strategic Mun... (NYSE:DSM)
Historical Stock Chart
From Oct 2024 to Nov 2024

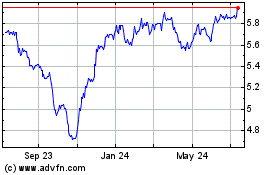
BNY Mellon Strategic Mun... (NYSE:DSM)
Historical Stock Chart
From Nov 2023 to Nov 2024
