false
0000351569
0000351569
2024-07-25
2024-07-25
iso4217:USD
xbrli:shares
iso4217:USD
xbrli:shares
UNITED STATES
SECURITIES AND EXCHANGE COMMISSION
Washington, D.C. 20549
FORM 8-K
CURRENT REPORT
PURSUANT TO SECTION 13 OR 15(d) OF THE
SECURITIES EXCHANGE ACT OF 1934
| Date of report (Date of earliest event reported): |
July 25, 2024 |
| Ameris Bancorp |
|
(Exact Name of Registrant as Specified in
Charter)
|
| Georgia |
001-13901 |
58-1456434 |
(State or Other Jurisdiction of
Incorporation) |
(Commission File Number) |
(IRS Employer Identification No.) |
| |
3490 Piedmont Road N.E., Suite
1550, Atlanta, Georgia |
30305 |
| |
(Address of Principal Executive Offices) |
(Zip Code) |
| Registrant’s telephone number, including area code: |
(404) 639-6500 |
| |
| (Former Name or Former Address, if Changed Since Last Report) |
Check the appropriate box below if the Form
8-K filing is intended to simultaneously satisfy the filing obligation of the registrant under any of the following provisions (see General Instruction A.2. below):
| ¨ |
Written communications pursuant to Rule 425 under the Securities Act (17 CFR 230.425) |
| ¨ |
Soliciting material pursuant to Rule 14a-12 under the Exchange Act (17 CFR 240.14a-12) |
| ¨ |
Pre-commencement communications pursuant to Rule 14d-2(b) under the Exchange Act (17 CFR 240.14d-2(b)) |
| ¨ |
Pre-commencement communications pursuant to Rule 13e-4(c) under the Exchange Act (17 CFR 240.13e-4(c)) |
Securities registered pursuant to Section 12(b) of the Act:
| Title of each class |
Trading Symbol(s) |
Name of each exchange on which registered |
| Common Stock, par value $1.00 per share |
ABCB |
New York Stock Exchange |
Indicate by check mark whether the registrant
is an emerging growth company as defined in Rule 405 of the Securities Act of 1933 (§230.405 of this chapter) or Rule 12b-2 of the
Securities Exchange Act of 1934 (§240.12b-2 of this chapter).
Emerging growth company
¨
If an emerging growth company, indicate
by check mark if the registrant has elected not to use the extended transition period for complying with any new or revised financial
accounting standards provided pursuant to Section 13(a) of the Exchange Act. ¨
| Item 2.02 | Results of Operations and Financial Condition. |
On July 25, 2024, Ameris Bancorp
(the “Company”) issued a press release announcing its unaudited financial results for the quarter ended June 30, 2024. A copy
of that press release is attached to this Current Report on Form 8-K (this “Report”) as Exhibit 99.1.
The information contained
in this Item 2.02 and in Exhibit 99.1 attached to this Report is being furnished and shall not be deemed filed for purposes of Section
18 of the Securities Exchange Act of 1934, as amended, or otherwise subject to the liabilities of such section. Furthermore, such information
shall not be deemed to be incorporated by reference into any registration statement or other document filed pursuant to the Securities
Act of 1933, as amended.
| Item 7.01 | Regulation FD Disclosure. |
A copy of the investor presentation
material that the Company will present regarding its earnings during the teleconference beginning at 9:00 a.m. Eastern time on July 26,
2024 is attached to this Report as Exhibit 99.2. The investor presentation material is also available on the “Investor Relations”
page of the Company’s website (http://www.amerisbank.com).
The information contained
in this Item 7.01 and in Exhibit 99.2 attached to this Report is being furnished and shall not be deemed filed for purposes of Section
18 of the Securities Exchange Act of 1934, as amended, or otherwise subject to the liabilities of such section. Furthermore, such information
shall not be deemed to be incorporated by reference into any registration statement or other document filed pursuant to the Securities
Act of 1933, as amended.
| Item 9.01 | Financial Statements and Exhibits. |
(d) Exhibits.
SIGNATURE
Pursuant to the requirements
of the Securities Exchange Act of 1934, as amended, the registrant has duly caused this report to be signed on its behalf by the undersigned,
hereunto duly authorized.
| |
AMERIS BANCORP |
| |
|
| |
|
| |
By: |
/s/ Nicole S. Stokes |
| |
|
Nicole S. Stokes |
| |
|
Chief Financial Officer |
Date: July 25, 2024
Exhibit 99.1

News Release
AMERIS BANCORP ANNOUNCES FINANCIAL RESULTS
FOR SECOND QUARTER 2024
Highlights of Ameris’s results for the
second quarter of 2024 include the following:
| · | Net
income of $90.8 million, or $1.32 per diluted share; |
| · | Adjusted
net income(1) of $80.8 million, or $1.17 per diluted share |
| · | Return
on average assets ("ROA") of 1.41%; Adjusted ROA(1) of 1.25% |
| · | Pre-tax,
pre-provision net revenue (PPNR) ROA(1) of 2.25%; Adjustment items positively
impacted PPNR ROA by 29 basis points |
| · | Growth
in tangible book value(1) of $1.27 per share, or 14.8% annualized, to $35.79
at June 30, 2024 |
| · | TCE
ratio(1) of 9.72%, compared with 8.80% one year ago |
| · | Net
interest margin of 3.58% for the second quarter of 2024, compared with 3.51% in the prior
quarter |
| · | Organic
growth in loans of $392.3 million, or 7.7% annualized |
| · | Growth
in total deposits of $446.8 million, or 8.6% annualized |
| · | Increase
in the allowance for loan losses to 1.60% of loans, from 1.55% at March 31, 2024 |
| · | CRE
concentration improved to 274% of capital, from 281% at March 31, 2024 |
| · | Annualized
net charge-offs declined to 0.18% of average total loans |
ATLANTA, GA, July 25, 2024 - Ameris
Bancorp (NYSE: ABCB) (the “Company”) today reported net income of $90.8 million, or $1.32 per diluted share, for the quarter
ended June 30, 2024, compared with $62.6 million, or $0.91 per diluted share, for the quarter ended June 30, 2023. Excluding
the gain on sale of mortgage servicing rights, gain on conversion of Visa Class B-1 stock, FDIC special assessment, gain on bank
owned life insurance ("BOLI") proceeds and tax expense attributable to BOLI restructuring, adjusted net income(1) was
$80.8 million, or $1.17 per diluted share, for the quarter ended June 30, 2024, compared with $62.6 million, or $0.91 per diluted
share, for the quarter ended June 30, 2023.
For the year-to-date period ending June 30,
2024, the Company reported net income of $165.1 million, or $2.39 per diluted share, compared with $123.1 million, or $1.78 per diluted
share, for the same period in 2023. The year-to-date period ending June 30, 2024 included a provision for credit losses of $39.9
million, compared with $95.2 million for the same period in 2023.
Commenting on the Company’s results, Palmer
Proctor, the Company’s Chief Executive Officer, said, “This quarter we achieved outstanding financial performance, marked
by margin expansion, growth in net interest income, and an increase in core deposits, resulting in a PPNR ROA exceeding 2%. We enhanced
shareholder value, with tangible book value and earning assets both growing over 14% annualized. Looking ahead, we remain optimistic
about the rest of 2024 and beyond, driven by our strong balance sheet, thriving Southeastern markets, and disciplined focus on continuous
improvement."
Net Interest Income and Net Interest Margin
Net interest income on a tax-equivalent basis
(TE) was $212.9 million in the second quarter of 2024, an increase of $10.5 million, or 5.2%, from last quarter and $2.4 million, or
1.1%, compared with the second quarter of 2023. The Company's net interest margin was 3.58% for the second quarter of 2024, up from 3.51%
reported for the first quarter of 2024 and down slightly from 3.60% reported for the second quarter of 2023. The increase in net interest
margin this quarter compared with the first quarter of 2024 is primarily attributable to improved yield on loans and securities during
the period, partially offset by increases in funding costs. During the second quarter of 2024, the Company recognized approximately $2.3
million, or 0.04% to margin, related to positive inflation adjustments on Treasury Inflation-Protected Securities and accelerated accretion
on an early bond payoff. The decrease in net interest margin compared with the same period in 2023 is due to the effect of overall increases
in deposit costs over the last year, partially offset by increased loan yields. The rate of change in deposit costs continues to slow
as market interest rates stabilize.
Yields on earning assets increased 13 basis points
during the quarter to 5.86%, compared with 5.73% in the first quarter of 2024, and increased 34 basis points from 5.52% in the second
quarter of 2023. Yields on loans increased to 6.00% during the second quarter of 2024, compared with 5.92% for the first quarter of 2024
and 5.66% for the second quarter of 2023.
The Company’s total cost of funds was 2.48%
in the second quarter of 2024, an increase of seven and 43 basis points compared with the first quarter of 2024 and second quarter of
2023, respectively. Deposit costs increased only three basis points during the second quarter of 2024 to 2.32%, compared with 2.29% in
the first quarter of 2024. Costs of interest-bearing deposits increased during the quarter from 3.31% in the first quarter of 2024 to
3.37% in the second quarter of 2024, reflecting an increase in money market account balances and costs.
Noninterest Income
Noninterest income increased $22.8 million, or
34.7%, in the second quarter of 2024 to $88.7 million, compared with $65.9 million for the first quarter of 2024, primarily as a result
of mortgage revenue and gain on securities. Mortgage banking activity increased by $7.0 million, or 17.7%, to $46.4 million in the second
quarter of 2024, compared with $39.4 million for the first quarter of 2024. Gain on sale spreads decreased slightly to 2.45% in the second
quarter of 2024 from 2.49% for the first quarter of 2024. Total production in the retail mortgage division increased $417.1 million,
or 45.8%, to $1.33 billion in the second quarter of 2024, compared with $910.2 million for the first quarter of 2024. The retail mortgage
open pipeline was $802.2 million at the end of the second quarter of 2024, compared with $606.7 million for the first quarter of 2024.
Also included in noninterest income was a $4.7 million gain from the sale of mortgage servicing rights and a $12.6 million gain on the
conversion of Visa Class B-1 shares during the quarter.
Noninterest Expense
Noninterest expense increased $6.6 million, or
4.5%, to $155.4 million during the second quarter of 2024, compared with $148.7 million for the first quarter of 2024. During the second
quarter of 2024, the Company recorded an adjustment of ($895,000) related to the FDIC special assessment, compared with $2.9 million
in the first quarter of 2024. Excluding this item, adjusted expenses(1) increased approximately $10.5 million, or 7.2%,
to $156.3 million in the second quarter of 2024 from $145.8 million in the first quarter of 2024. The increase in adjusted expenses(1) resulted
from a $5.3 million increase in salaries and employee benefits primarily in variable compensation related to mortgage production. Also
contributing to the increase in adjusted expenses was $2.6 million of less deferred origination costs in our equipment finance division.
Advertising and marketing expense increased $1.0 million due to a new deposit marketing campaign initiated in the second quarter. Management
continues to focus on operating efficiency, and the adjusted efficiency ratio(1) increased to 55.00% in the second quarter
of 2024, compared with 54.56% in the first quarter of 2024.
Income Tax Expense
The Company's effective tax rate for the second
quarter of 2024 was 28.2%, compared with 23.7% for the first quarter of 2024. Tax expense for the second quarter of 2024 included a $4.8
million expense related to the termination of certain BOLI policies during the quarter, the proceeds of which the Company will reinvest
in higher yielding policies.
Balance Sheet Trends
Total assets at June 30, 2024 were $26.52
billion, compared with $25.20 billion at December 31, 2023. Debt securities available-for-sale increased to $1.53 billion, compared
with $1.40 billion at December 31, 2023. Loans, net of unearned income, increased $723.3 million, or 7.2% annualized, to $20.99
billion at June 30, 2024, compared with $20.27 billion at December 31, 2023. Loans held for sale increased to $570.2 million
at June 30, 2024 from $281.3 million at December 31, 2023.
At June 30, 2024, total deposits amounted
to $21.44 billion, compared with $20.71 billion at December 31, 2023. During the second quarter of 2024, deposits grew $446.8 million,
with noninterest bearing accounts increasing $110.9 million, money market accounts increasing $267.0 million, retail CDs increasing $23.6
million and interest bearing demand accounts increasing $65.6 million, with such increases offset in part by a $15.2 million decrease
in savings accounts and a $5.2 million decrease in brokered CDs. Noninterest bearing accounts as a percentage of total deposits was minimally
changed, such that at June 30, 2024, noninterest bearing deposit accounts represented $6.65 billion, or 31.0% of total deposits,
compared with $6.49 billion, or 31.3% of total deposits, at December 31, 2023.
Shareholders’ equity at June 30, 2024
totaled $3.57 billion, an increase of $139.9 million, or 4.1%, from December 31, 2023. The increase in shareholders’
equity was primarily the result of earnings of $165.1 million during the first six months of 2024, partially offset by dividends declared,
share repurchases and an increase in other comprehensive loss of $2.1 million resulting from changes in interest rates on the Company's
investment portfolio. Tangible book value per share(1) increased $2.15 per share, or 12.9% annualized, during the first
six months of 2024 to $35.79 at June 30, 2024. Tangible common equity as a percentage of tangible assets was 9.72% at June 30,
2024, compared with 9.64% at the end of 2023. The Company repurchased 62,700 of its shares in the quarter ending June 30, 2024 at
an average cost of $47.12 per share, equating to approximately $3.0 million.
Credit Quality
During the second quarter of 2024, the Company
recorded a provision for credit losses of $18.8 million, bringing the allowance for credit losses on loans to a 1.60%, compared with
a provision of $21.1 million in the first quarter of 2024. Nonperforming assets as a percentage of total assets were up three basis points
to 0.74% during the quarter. Approximately $93.5 million, or 47.3%, of the nonperforming assets at June 30, 2024 were GNMA-guaranteed
mortgage loans, which have minimal loss exposure. Excluding these government-guaranteed loans, nonperforming assets as a percentage of
total assets increased only one basis point to 0.39% at June 30, 2024, compared with 0.38% at the first quarter of 2024. The net
charge-off ratio improved to 18 basis points for the second quarter of 2024, from 25 basis points in the first quarter of 2024.
Conference Call
The Company will host a teleconference at 9:00
a.m. Eastern time on Friday, July 26, 2024, to discuss the Company's results and answer appropriate questions. The conference
call can be accessed by dialing 1-844-481-2939. The conference call ID is Ameris Bancorp. A replay of the call will be available beginning
one hour after the end of the conference call until August 2, 2024. To listen to the replay, dial 1-877-344-7529. The conference
replay access code is 8113235. The financial information discussed will be available on the Investor Relations page of the Ameris
Bank website at ir.amerisbank.com. Participants also may listen to a live webcast of the presentation by visiting the link on
the Investor Relations page of the Ameris Bank website.
About
Ameris Bancorp
Ameris Bancorp is the parent of Ameris Bank,
a state-chartered bank headquartered in Atlanta, Georgia. Ameris operates 164 financial centers across the Southeast and also serves
consumer and business customers nationwide through select lending channels. Ameris manages $26.5 billion in assets as of June 30,
2024, and provides a full range of traditional banking and lending products, treasury and cash management, insurance premium financing,
and mortgage and refinancing services. Learn more about Ameris at www.amerisbank.com.
(1) Considered non-GAAP financial
measure - See reconciliation of GAAP to non-GAAP financial measures in tables 9A - 9E.
This news release contains certain performance
measures determined by methods other than in accordance with accounting principles generally accepted in the United States of America
(“GAAP”). The Company’s management uses these non-GAAP financial measures in its analysis of the Company’s performance.
These measures are useful when evaluating the underlying performance and efficiency of the Company’s operations and balance sheet.
The Company’s management believes that these non-GAAP financial measures provide a greater understanding of ongoing operations,
enhance comparability of results with prior periods and demonstrate the effects of significant gains and charges in the current period.
The Company’s management believes that investors may use these non-GAAP financial measures to evaluate the Company’s financial
performance without the impact of unusual items that may obscure trends in the Company’s underlying performance. These disclosures
should not be viewed as a substitute for financial measures determined in accordance with GAAP, nor are they necessarily comparable to
non-GAAP financial measures that may be presented by other companies.
This news release contains forward-looking
statements, as defined by federal securities laws, including, among other forward-looking statements, certain plans, expectations and
goals. Words such as “may,” “believe,” “expect,” “anticipate,” “intend,”
“will,” “should,” “plan,” “estimate,” “predict,” “continue” and
“potential” or the negative of these terms or other comparable terminology, as well as similar expressions, are meant to
identify forward-looking statements. The forward-looking statements in this news release are based on current expectations and are provided
to assist in the understanding of potential future performance. Such forward-looking statements involve numerous assumptions, risks and
uncertainties that may cause actual results to differ materially from those expressed or implied in any such statements, including, without
limitation, the following: general competitive, economic, unemployment, political and market conditions and fluctuations, including real
estate market conditions, and the effects of such conditions and fluctuations on the creditworthiness of borrowers, collateral values,
asset recovery values and the value of investment securities; movements in interest rates and their impacts on net interest margin, investment
security valuations and other performance measures; expectations on credit quality and performance; legislative and regulatory changes;
changes in U.S. government monetary and fiscal policy; competitive pressures on product pricing and services; the success and timing
of other business strategies; our outlook and long-term goals for future growth; and natural disasters, geopolitical events, acts of
war or terrorism or other hostilities, public health crises and other catastrophic events beyond our control. For a discussion of some
of the other risks and other factors that may cause such forward-looking statements to differ materially from actual results, please
refer to the Company’s filings with the Securities and Exchange Commission, including the Company’s Annual Report on Form 10-K
for the year ended December 31, 2023 and the Company's subsequently filed periodic reports and other filings. Forward-looking statements
speak only as of the date they are made, and the Company undertakes no obligation to update or revise forward-looking statements.
For more information, contact:
Brady Gailey
Executive Director of Corporate Development
(404) 240-1517
AMERIS BANCORP AND SUBSIDIARIES
FINANCIAL TABLES
| Financial Highlights | |
Table 1 | |
| | |
Three Months Ended | | |
Six Months
Ended | |
| | |
Jun | | |
Mar | | |
Dec | | |
Sep | | |
Jun | | |
Jun | | |
Jun | |
| (dollars in thousands except per share data) | |
2024 | | |
2024 | | |
2023 | | |
2023 | | |
2023 | | |
2024 | | |
2023 | |
| EARNINGS | |
| | |
| | |
| | |
| | |
| | |
| | |
| |
| Net income | |
$ | 90,785 | | |
$ | 74,312 | | |
$ | 65,934 | | |
$ | 80,115 | | |
$ | 62,635 | | |
$ | 165,097 | | |
$ | 123,056 | |
| Adjusted net income(1) | |
$ | 80,763 | | |
$ | 75,612 | | |
$ | 73,568 | | |
$ | 80,115 | | |
$ | 62,635 | | |
$ | 156,375 | | |
$ | 122,570 | |
| | |
| | | |
| | | |
| | | |
| | | |
| | | |
| | | |
| | |
| COMMON SHARE DATA | |
| | | |
| | | |
| | | |
| | | |
| | | |
| | | |
| | |
| Earnings per share available to common shareholders | |
| | | |
| | | |
| | | |
| | | |
| | | |
| | | |
| | |
| Basic | |
$ | 1.32 | | |
$ | 1.08 | | |
$ | 0.96 | | |
$ | 1.16 | | |
$ | 0.91 | | |
$ | 2.40 | | |
$ | 1.78 | |
| Diluted | |
$ | 1.32 | | |
$ | 1.08 | | |
$ | 0.96 | | |
$ | 1.16 | | |
$ | 0.91 | | |
$ | 2.39 | | |
$ | 1.78 | |
| Adjusted diluted EPS(1) | |
$ | 1.17 | | |
$ | 1.10 | | |
$ | 1.07 | | |
$ | 1.16 | | |
$ | 0.91 | | |
$ | 2.27 | | |
$ | 1.77 | |
| Cash dividends per share | |
$ | 0.15 | | |
$ | 0.15 | | |
$ | 0.15 | | |
$ | 0.15 | | |
$ | 0.15 | | |
$ | 0.30 | | |
$ | 0.30 | |
| Book value per share (period end) | |
$ | 51.64 | | |
$ | 50.42 | | |
$ | 49.62 | | |
$ | 48.41 | | |
$ | 47.51 | | |
$ | 51.64 | | |
$ | 47.51 | |
| Tangible book value per share (period end)(1) | |
$ | 35.79 | | |
$ | 34.52 | | |
$ | 33.64 | | |
$ | 32.38 | | |
$ | 31.42 | | |
$ | 35.79 | | |
$ | 31.42 | |
| Weighted average number of shares | |
| | | |
| | | |
| | | |
| | | |
| | | |
| | | |
| | |
| Basic | |
| 68,824,150 | | |
| 68,808,393 | | |
| 68,824,004 | | |
| 68,879,352 | | |
| 68,989,549 | | |
| 68,818,618 | | |
| 69,084,746 | |
| Diluted | |
| 69,013,834 | | |
| 69,014,116 | | |
| 69,014,793 | | |
| 68,994,247 | | |
| 69,034,763 | | |
| 69,010,010 | | |
| 69,191,512 | |
| Period end number of shares | |
| 69,066,573 | | |
| 69,115,263 | | |
| 69,053,341 | | |
| 69,138,461 | | |
| 69,139,783 | | |
| 69,066,573 | | |
| 69,139,783 | |
| Market data | |
| | | |
| | | |
| | | |
| | | |
| | | |
| | | |
| | |
| High intraday price | |
$ | 51.18 | | |
$ | 53.99 | | |
$ | 53.84 | | |
$ | 45.34 | | |
$ | 37.18 | | |
$ | 53.99 | | |
$ | 50.54 | |
| Low intraday price | |
$ | 44.23 | | |
$ | 44.00 | | |
$ | 34.26 | | |
$ | 33.21 | | |
$ | 28.33 | | |
$ | 44.00 | | |
$ | 28.33 | |
| Period end closing price | |
$ | 50.35 | | |
$ | 48.38 | | |
$ | 53.05 | | |
$ | 38.39 | | |
$ | 34.21 | | |
$ | 50.35 | | |
$ | 34.21 | |
| Average daily volume | |
| 301,784 | | |
| 407,898 | | |
| 390,190 | | |
| 361,167 | | |
| 475,198 | | |
| 353,985 | | |
| 463,720 | |
| | |
| | | |
| | | |
| | | |
| | | |
| | | |
| | | |
| | |
| PERFORMANCE RATIOS | |
| | | |
| | | |
| | | |
| | | |
| | | |
| | | |
| | |
| Return on average assets | |
| 1.41 | % | |
| 1.18 | % | |
| 1.03 | % | |
| 1.25 | % | |
| 0.98 | % | |
| 1.30 | % | |
| 0.98 | % |
| Adjusted return on average assets(1) | |
| 1.25 | % | |
| 1.20 | % | |
| 1.15 | % | |
| 1.25 | % | |
| 0.98 | % | |
| 1.23 | % | |
| 0.97 | % |
| Return on average common equity | |
| 10.34 | % | |
| 8.63 | % | |
| 7.73 | % | |
| 9.56 | % | |
| 7.63 | % | |
| 9.49 | % | |
| 7.58 | % |
| Adjusted return on average tangible
common equity(1) | |
| 13.35 | % | |
| 12.88 | % | |
| 12.81 | % | |
| 14.35 | % | |
| 11.53 | % | |
| 13.12 | % | |
| 11.47 | % |
| Earning asset yield (TE) | |
| 5.86 | % | |
| 5.73 | % | |
| 5.69 | % | |
| 5.62 | % | |
| 5.52 | % | |
| 5.79 | % | |
| 5.38 | % |
| Total cost of funds | |
| 2.48 | % | |
| 2.41 | % | |
| 2.32 | % | |
| 2.24 | % | |
| 2.05 | % | |
| 2.44 | % | |
| 1.82 | % |
| Net interest margin (TE) | |
| 3.58 | % | |
| 3.51 | % | |
| 3.54 | % | |
| 3.54 | % | |
| 3.60 | % | |
| 3.54 | % | |
| 3.68 | % |
| Efficiency ratio | |
| 51.68 | % | |
| 55.64 | % | |
| 56.80 | % | |
| 52.21 | % | |
| 53.60 | % | |
| 53.54 | % | |
| 52.85 | % |
| Adjusted efficiency ratio (TE)(1) | |
| 55.00 | % | |
| 54.56 | % | |
| 52.87 | % | |
| 52.02 | % | |
| 53.41 | % | |
| 54.79 | % | |
| 52.72 | % |
| | |
| | | |
| | | |
| | | |
| | | |
| | | |
| | | |
| | |
| CAPITAL ADEQUACY (period end) | |
| | | |
| | | |
| | | |
| | | |
| | | |
| | | |
| | |
| Shareholders' equity to assets | |
| 13.45 | % | |
| 13.58 | % | |
| 13.60 | % | |
| 13.02 | % | |
| 12.73 | % | |
| 13.45 | % | |
| 12.73 | % |
| Tangible common equity to tangible
assets(1) | |
| 9.72 | % | |
| 9.71 | % | |
| 9.64 | % | |
| 9.11 | % | |
| 8.80 | % | |
| 9.72 | % | |
| 8.80 | % |
| | |
| | | |
| | | |
| | | |
| | | |
| | | |
| | | |
| | |
| OTHER DATA (period end) | |
| | | |
| | | |
| | | |
| | | |
| | | |
| | | |
| | |
| Full time equivalent employees | |
| | | |
| | | |
| | | |
| | | |
| | | |
| | | |
| | |
| Banking Division | |
| 2,073 | | |
| 2,082 | | |
| 2,088 | | |
| 2,082 | | |
| 2,104 | | |
| 2,073 | | |
| 2,104 | |
| Retail Mortgage Division | |
| 595 | | |
| 596 | | |
| 595 | | |
| 601 | | |
| 613 | | |
| 595 | | |
| 613 | |
| Warehouse Lending Division | |
| 9 | | |
| 8 | | |
| 7 | | |
| 8 | | |
| 8 | | |
| 9 | | |
| 8 | |
| Premium Finance Division | |
| 74 | | |
| 73 | | |
| 75 | | |
| 78 | | |
| 76 | | |
| 74 | | |
| 76 | |
| Total Ameris Bancorp FTE headcount | |
| 2,751 | | |
| 2,759 | | |
| 2,765 | | |
| 2,769 | | |
| 2,801 | | |
| 2,751 | | |
| 2,801 | |
| | |
| | | |
| | | |
| | | |
| | | |
| | | |
| | | |
| | |
| Branch locations | |
| 164 | | |
| 164 | | |
| 164 | | |
| 164 | | |
| 164 | | |
| 164 | | |
| 164 | |
| Deposits per branch location | |
$ | 130,757 | | |
$ | 128,033 | | |
$ | 126,271 | | |
$ | 125,551 | | |
$ | 124,653 | | |
$ | 130,757 | | |
$ | 124,653 | |
(1)Considered non-GAAP financial
measure - See reconciliation of GAAP to non-GAAP financial measures in tables 9A - 9E
AMERIS BANCORP AND SUBSIDIARIES
FINANCIAL TABLES
| Income Statement | |
Table 2 | |
| | |
Three Months Ended | | |
Six Months
Ended | |
| | |
Jun | | |
Mar | | |
Dec | | |
Sep | | |
Jun | | |
Jun | | |
Jun | |
| (dollars in thousands except per share data) | |
2024 | | |
2024 | | |
2023 | | |
2023 | | |
2023 | | |
2024 | | |
2023 | |
| Interest income | |
| | | |
| | | |
| | | |
| | | |
| | | |
| | | |
| | |
| Interest and fees on loans | |
$ | 317,664 | | |
$ | 303,393 | | |
$ | 303,487 | | |
$ | 304,699 | | |
$ | 292,012 | | |
$ | 621,057 | | |
$ | 563,976 | |
| Interest on taxable securities | |
| 16,948 | | |
| 13,092 | | |
| 14,033 | | |
| 14,754 | | |
| 15,915 | | |
| 30,040 | | |
| 30,215 | |
| Interest on nontaxable securities | |
| 335 | | |
| 330 | | |
| 326 | | |
| 331 | | |
| 339 | | |
| 665 | | |
| 678 | |
| Interest on deposits in other banks | |
| 12,376 | | |
| 12,637 | | |
| 14,368 | | |
| 10,769 | | |
| 13,686 | | |
| 25,013 | | |
| 22,799 | |
| Total interest income | |
| 347,323 | | |
| 329,452 | | |
| 332,214 | | |
| 330,553 | | |
| 321,952 | | |
| 676,775 | | |
| 617,668 | |
| | |
| | | |
| | | |
| | | |
| | | |
| | | |
| | | |
| | |
| Interest expense | |
| | | |
| | | |
| | | |
| | | |
| | | |
| | | |
| | |
| Interest on deposits | |
| 121,245 | | |
| 118,174 | | |
| 111,749 | | |
| 102,999 | | |
| 88,087 | | |
| 239,419 | | |
| 141,269 | |
| Interest on other borrowings | |
| 14,157 | | |
| 9,890 | | |
| 14,364 | | |
| 19,803 | | |
| 24,325 | | |
| 24,047 | | |
| 55,207 | |
| Total interest expense | |
| 135,402 | | |
| 128,064 | | |
| 126,113 | | |
| 122,802 | | |
| 112,412 | | |
| 263,466 | | |
| 196,476 | |
| | |
| | | |
| | | |
| | | |
| | | |
| | | |
| | | |
| | |
| Net interest income | |
| 211,921 | | |
| 201,388 | | |
| 206,101 | | |
| 207,751 | | |
| 209,540 | | |
| 413,309 | | |
| 421,192 | |
| | |
| | | |
| | | |
| | | |
| | | |
| | | |
| | | |
| | |
| Provision for loan losses | |
| 25,348 | | |
| 25,523 | | |
| 30,401 | | |
| 30,095 | | |
| 43,643 | | |
| 50,871 | | |
| 93,019 | |
| Provision for unfunded commitments | |
| (6,570 | ) | |
| (4,422 | ) | |
| (7,438 | ) | |
| (5,634 | ) | |
| 1,873 | | |
| (10,992 | ) | |
| 2,219 | |
| Provision for other credit losses | |
| (5 | ) | |
| 4 | | |
| (11 | ) | |
| (2 | ) | |
| — | | |
| (1 | ) | |
| 7 | |
| Provision for credit losses | |
| 18,773 | | |
| 21,105 | | |
| 22,952 | | |
| 24,459 | | |
| 45,516 | | |
| 39,878 | | |
| 95,245 | |
| Net interest income after
provision for credit losses | |
| 193,148 | | |
| 180,283 | | |
| 183,149 | | |
| 183,292 | | |
| 164,024 | | |
| 373,431 | | |
| 325,947 | |
| | |
| | | |
| | | |
| | | |
| | | |
| | | |
| | | |
| | |
| Noninterest income | |
| | | |
| | | |
| | | |
| | | |
| | | |
| | | |
| | |
| Service charges on deposit accounts | |
| 12,672 | | |
| 11,759 | | |
| 12,252 | | |
| 12,092 | | |
| 11,295 | | |
| 24,431 | | |
| 22,231 | |
| Mortgage banking activity | |
| 46,399 | | |
| 39,430 | | |
| 31,461 | | |
| 36,290 | | |
| 40,742 | | |
| 85,829 | | |
| 72,134 | |
| Other service charges, commissions and fees | |
| 1,211 | | |
| 1,202 | | |
| 1,234 | | |
| 1,221 | | |
| 975 | | |
| 2,413 | | |
| 1,946 | |
| Gain (loss) on securities | |
| 12,335 | | |
| (7 | ) | |
| (288 | ) | |
| (16 | ) | |
| (6 | ) | |
| 12,328 | | |
| — | |
| Other noninterest income | |
| 16,094 | | |
| 13,494 | | |
| 11,589 | | |
| 13,594 | | |
| 14,343 | | |
| 29,588 | | |
| 27,088 | |
| Total noninterest income | |
| 88,711 | | |
| 65,878 | | |
| 56,248 | | |
| 63,181 | | |
| 67,349 | | |
| 154,589 | | |
| 123,399 | |
| | |
| | | |
| | | |
| | | |
| | | |
| | | |
| | | |
| | |
| Noninterest expense | |
| | | |
| | | |
| | | |
| | | |
| | | |
| | | |
| | |
| Salaries and employee benefits | |
| 88,201 | | |
| 82,930 | | |
| 75,966 | | |
| 81,898 | | |
| 81,336 | | |
| 171,131 | | |
| 162,246 | |
| Occupancy and equipment | |
| 12,559 | | |
| 12,885 | | |
| 13,197 | | |
| 12,745 | | |
| 12,522 | | |
| 25,444 | | |
| 25,508 | |
| Data processing and communications expenses | |
| 15,193 | | |
| 14,654 | | |
| 14,028 | | |
| 12,973 | | |
| 13,451 | | |
| 29,847 | | |
| 26,485 | |
| Credit resolution-related expenses(1) | |
| 840 | | |
| 486 | | |
| 157 | | |
| (1,360 | ) | |
| 848 | | |
| 1,326 | | |
| 1,283 | |
| Advertising and marketing | |
| 3,571 | | |
| 2,545 | | |
| 2,974 | | |
| 2,723 | | |
| 2,627 | | |
| 6,116 | | |
| 6,159 | |
| Amortization of intangible assets | |
| 4,407 | | |
| 4,422 | | |
| 4,425 | | |
| 4,425 | | |
| 4,688 | | |
| 8,829 | | |
| 9,394 | |
| Other noninterest expenses | |
| 30,586 | | |
| 30,789 | | |
| 38,264 | | |
| 28,042 | | |
| 32,931 | | |
| 61,375 | | |
| 56,749 | |
| Total noninterest expense | |
| 155,357 | | |
| 148,711 | | |
| 149,011 | | |
| 141,446 | | |
| 148,403 | | |
| 304,068 | | |
| 287,824 | |
| | |
| | | |
| | | |
| | | |
| | | |
| | | |
| | | |
| | |
| Income before income tax expense | |
| 126,502 | | |
| 97,450 | | |
| 90,386 | | |
| 105,027 | | |
| 82,970 | | |
| 223,952 | | |
| 161,522 | |
| Income tax expense | |
| 35,717 | | |
| 23,138 | | |
| 24,452 | | |
| 24,912 | | |
| 20,335 | | |
| 58,855 | | |
| 38,466 | |
| Net income | |
$ | 90,785 | | |
$ | 74,312 | | |
$ | 65,934 | | |
$ | 80,115 | | |
$ | 62,635 | | |
$ | 165,097 | | |
$ | 123,056 | |
| | |
| | | |
| | | |
| | | |
| | | |
| | | |
| | | |
| | |
| Diluted earnings per common share | |
$ | 1.32 | | |
$ | 1.08 | | |
$ | 0.96 | | |
$ | 1.16 | | |
$ | 0.91 | | |
$ | 2.39 | | |
$ | 1.78 | |
(1) Includes expenses
associated with problem loans and OREO, as well as OREO losses and writedowns.
AMERIS BANCORP AND SUBSIDIARIES
FINANCIAL TABLES
| Period End Balance Sheet | |
Table 3 | |
| | |
Jun | | |
Mar | | |
Dec | | |
Sep | | |
Jun | |
| (dollars in thousands) | |
2024 | | |
2024 | | |
2023 | | |
2023 | | |
2023 | |
| Assets | |
| | |
| | |
| | |
| | |
| |
| Cash and due from banks | |
$ | 257,297 | | |
$ | 235,931 | | |
$ | 230,470 | | |
$ | 241,137 | | |
$ | 284,552 | |
| Interest-bearing deposits in banks | |
| 1,104,897 | | |
| 975,321 | | |
| 936,834 | | |
| 1,304,636 | | |
| 1,034,578 | |
| Debt securities available-for-sale, at fair value | |
| 1,531,047 | | |
| 1,414,419 | | |
| 1,402,944 | | |
| 1,424,081 | | |
| 1,460,356 | |
| Debt securities held-to-maturity, at amortized cost | |
| 148,538 | | |
| 147,022 | | |
| 141,512 | | |
| 141,859 | | |
| 142,513 | |
| Other investments | |
| 96,613 | | |
| 77,480 | | |
| 71,794 | | |
| 104,957 | | |
| 109,656 | |
| Loans held for sale | |
| 570,180 | | |
| 364,332 | | |
| 281,332 | | |
| 381,466 | | |
| 391,472 | |
| | |
| | | |
| | | |
| | | |
| | | |
| | |
| Loans, net of unearned income | |
| 20,992,603 | | |
| 20,600,260 | | |
| 20,269,303 | | |
| 20,201,079 | | |
| 20,471,759 | |
| Allowance for credit losses | |
| (336,218 | ) | |
| (320,023 | ) | |
| (307,100 | ) | |
| (290,104 | ) | |
| (272,071 | ) |
| Loans, net | |
| 20,656,385 | | |
| 20,280,237 | | |
| 19,962,203 | | |
| 19,910,975 | | |
| 20,199,688 | |
| | |
| | | |
| | | |
| | | |
| | | |
| | |
| Other real estate owned | |
| 2,213 | | |
| 2,158 | | |
| 6,199 | | |
| 3,397 | | |
| 6,170 | |
| Premises and equipment, net | |
| 213,255 | | |
| 214,801 | | |
| 216,435 | | |
| 217,564 | | |
| 218,662 | |
| Goodwill | |
| 1,015,646 | | |
| 1,015,646 | | |
| 1,015,646 | | |
| 1,015,646 | | |
| 1,015,646 | |
| Other intangible assets, net | |
| 79,120 | | |
| 83,527 | | |
| 87,949 | | |
| 92,375 | | |
| 96,800 | |
| Cash value of bank owned life insurance | |
| 376,458 | | |
| 396,804 | | |
| 395,778 | | |
| 393,769 | | |
| 391,483 | |
| Other assets | |
| 469,079 | | |
| 447,767 | | |
| 454,603 | | |
| 465,968 | | |
| 449,042 | |
| Total assets | |
$ | 26,520,728 | | |
$ | 25,655,445 | | |
$ | 25,203,699 | | |
$ | 25,697,830 | | |
$ | 25,800,618 | |
| | |
| | | |
| | | |
| | | |
| | | |
| | |
| Liabilities | |
| | | |
| | | |
| | | |
| | | |
| | |
| Deposits | |
| | | |
| | | |
| | | |
| | | |
| | |
| Noninterest-bearing | |
$ | 6,649,220 | | |
$ | 6,538,322 | | |
$ | 6,491,639 | | |
$ | 6,589,610 | | |
$ | 6,706,897 | |
| Interest-bearing | |
| 14,794,923 | | |
| 14,459,068 | | |
| 14,216,870 | | |
| 14,000,735 | | |
| 13,736,228 | |
| Total deposits | |
| 21,444,143 | | |
| 20,997,390 | | |
| 20,708,509 | | |
| 20,590,345 | | |
| 20,443,125 | |
| Other borrowings | |
| 946,413 | | |
| 631,380 | | |
| 509,586 | | |
| 1,209,553 | | |
| 1,536,989 | |
| Subordinated deferrable interest debentures | |
| 131,312 | | |
| 130,814 | | |
| 130,315 | | |
| 129,817 | | |
| 129,319 | |
| Other liabilities | |
| 432,246 | | |
| 411,123 | | |
| 428,542 | | |
| 421,046 | | |
| 406,555 | |
| Total liabilities | |
| 22,954,114 | | |
| 22,170,707 | | |
| 21,776,952 | | |
| 22,350,761 | | |
| 22,515,988 | |
| | |
| | | |
| | | |
| | | |
| | | |
| | |
| Shareholders' Equity | |
| | | |
| | | |
| | | |
| | | |
| | |
| Preferred stock | |
| — | | |
| — | | |
| — | | |
| — | | |
| — | |
| Common stock | |
| 72,697 | | |
| 72,683 | | |
| 72,516 | | |
| 72,514 | | |
| 72,515 | |
| Capital stock | |
| 1,950,846 | | |
| 1,948,352 | | |
| 1,945,385 | | |
| 1,942,852 | | |
| 1,939,865 | |
| Retained earnings | |
| 1,684,218 | | |
| 1,603,832 | | |
| 1,539,957 | | |
| 1,484,424 | | |
| 1,414,742 | |
| Accumulated other comprehensive loss, net of tax | |
| (38,020 | ) | |
| (39,959 | ) | |
| (35,939 | ) | |
| (60,818 | ) | |
| (50,618 | ) |
| Treasury stock | |
| (103,127 | ) | |
| (100,170 | ) | |
| (95,172 | ) | |
| (91,903 | ) | |
| (91,874 | ) |
| Total shareholders' equity | |
| 3,566,614 | | |
| 3,484,738 | | |
| 3,426,747 | | |
| 3,347,069 | | |
| 3,284,630 | |
| Total liabilities and
shareholders' equity | |
$ | 26,520,728 | | |
$ | 25,655,445 | | |
$ | 25,203,699 | | |
$ | 25,697,830 | | |
$ | 25,800,618 | |
| | |
| | | |
| | | |
| | | |
| | | |
| | |
| Other Data | |
| | | |
| | | |
| | | |
| | | |
| | |
| Earning assets | |
$ | 24,443,878 | | |
$ | 23,578,834 | | |
$ | 23,103,719 | | |
$ | 23,558,078 | | |
$ | 23,610,334 | |
| Intangible assets | |
| 1,094,766 | | |
| 1,099,173 | | |
| 1,103,595 | | |
| 1,108,021 | | |
| 1,112,446 | |
| Interest-bearing liabilities | |
| 15,872,648 | | |
| 15,221,262 | | |
| 14,856,771 | | |
| 15,340,105 | | |
| 15,402,536 | |
| Average assets | |
| 25,954,808 | | |
| 25,295,088 | | |
| 25,341,990 | | |
| 25,525,913 | | |
| 25,631,846 | |
| Average common shareholders' equity | |
| 3,530,869 | | |
| 3,462,871 | | |
| 3,383,554 | | |
| 3,324,960 | | |
| 3,293,049 | |
AMERIS BANCORP AND SUBSIDIARIES
FINANCIAL TABLES
| Asset Quality Information | |
Table 4 | |
| | |
Three Months Ended | | |
Six Months
Ended | |
| | |
Jun | | |
Mar | | |
Dec | | |
Sep | | |
Jun | | |
Jun | | |
Jun | |
| (dollars in thousands) | |
2024 | | |
2024 | | |
2023 | | |
2023 | | |
2023 | | |
2024 | | |
2023 | |
| Allowance for Credit Losses | |
| | | |
| | | |
| | | |
| | | |
| | | |
| | | |
| | |
| Balance at beginning of period | |
$ | 357,232 | | |
$ | 348,727 | | |
$ | 339,180 | | |
$ | 326,783 | | |
$ | 295,497 | | |
$ | 348,727 | | |
$ | 258,163 | |
| | |
| | | |
| | | |
| | | |
| | | |
| | | |
| | | |
| | |
| Adoption of ASU 2022-02 | |
| — | | |
| — | | |
| — | | |
| — | | |
| — | | |
| — | | |
| (1,711 | ) |
| | |
| | | |
| | | |
| | | |
| | | |
| | | |
| | | |
| | |
| Provision for loan losses | |
| 25,348 | | |
| 25,523 | | |
| 30,401 | | |
| 30,095 | | |
| 43,643 | | |
| 50,871 | | |
| 93,019 | |
| Provision for unfunded commitments | |
| (6,570 | ) | |
| (4,422 | ) | |
| (7,438 | ) | |
| (5,634 | ) | |
| 1,873 | | |
| (10,992 | ) | |
| 2,219 | |
| Provision for other credit losses | |
| (5 | ) | |
| 4 | | |
| (11 | ) | |
| (2 | ) | |
| — | | |
| (1 | ) | |
| 7 | |
| Provision for credit losses | |
| 18,773 | | |
| 21,105 | | |
| 22,952 | | |
| 24,459 | | |
| 45,516 | | |
| 39,878 | | |
| 95,245 | |
| | |
| | | |
| | | |
| | | |
| | | |
| | | |
| | | |
| | |
| Charge-offs | |
| 16,845 | | |
| 18,457 | | |
| 20,104 | | |
| 19,488 | | |
| 20,670 | | |
| 35,302 | | |
| 35,626 | |
| Recoveries | |
| 7,692 | | |
| 5,857 | | |
| 6,699 | | |
| 7,426 | | |
| 6,440 | | |
| 13,549 | | |
| 10,712 | |
| Net charge-offs (recoveries) | |
| 9,153 | | |
| 12,600 | | |
| 13,405 | | |
| 12,062 | | |
| 14,230 | | |
| 21,753 | | |
| 24,914 | |
| | |
| | | |
| | | |
| | | |
| | | |
| | | |
| | | |
| | |
| Ending balance | |
$ | 366,852 | | |
$ | 357,232 | | |
$ | 348,727 | | |
$ | 339,180 | | |
$ | 326,783 | | |
$ | 366,852 | | |
$ | 326,783 | |
| | |
| | | |
| | | |
| | | |
| | | |
| | | |
| | | |
| | |
| Allowance for loan losses | |
$ | 336,218 | | |
$ | 320,023 | | |
$ | 307,100 | | |
$ | 290,104 | | |
$ | 272,071 | | |
$ | 336,218 | | |
$ | 272,071 | |
| Allowance for unfunded commitments | |
| 30,566 | | |
| 37,136 | | |
| 41,558 | | |
| 48,996 | | |
| 54,630 | | |
| 30,566 | | |
| 54,630 | |
| Allowance for other credit losses | |
| 68 | | |
| 73 | | |
| 69 | | |
| 80 | | |
| 82 | | |
| 68 | | |
| 82 | |
| Total allowance for credit losses | |
$ | 366,852 | | |
$ | 357,232 | | |
$ | 348,727 | | |
$ | 339,180 | | |
$ | 326,783 | | |
$ | 366,852 | | |
$ | 326,783 | |
| | |
| | | |
| | | |
| | | |
| | | |
| | | |
| | | |
| | |
| Non-Performing Assets | |
| | | |
| | | |
| | | |
| | | |
| | | |
| | | |
| | |
| Nonaccrual portfolio loans | |
$ | 85,878 | | |
$ | 80,448 | | |
$ | 60,961 | | |
$ | 53,806 | | |
$ | 57,025 | | |
$ | 85,878 | | |
$ | 57,025 | |
| Other real estate owned | |
| 2,213 | | |
| 2,158 | | |
| 6,199 | | |
| 3,397 | | |
| 6,170 | | |
| 2,213 | | |
| 6,170 | |
| Repossessed assets | |
| 22 | | |
| 29 | | |
| 17 | | |
| 22 | | |
| 9 | | |
| 22 | | |
| 9 | |
| Accruing loans delinquent 90 days or more | |
| 15,909 | | |
| 15,811 | | |
| 16,988 | | |
| 11,891 | | |
| 13,424 | | |
| 15,909 | | |
| 13,424 | |
| Non-performing portfolio assets | |
$ | 104,022 | | |
$ | 98,446 | | |
$ | 84,165 | | |
$ | 69,116 | | |
$ | 76,628 | | |
$ | 104,022 | | |
$ | 76,628 | |
| Serviced GNMA-guaranteed mortgage nonaccrual
loans | |
| 93,520 | | |
| 84,238 | | |
| 90,156 | | |
| 80,752 | | |
| 69,655 | | |
| 93,520 | | |
| 69,655 | |
| Total non-performing assets | |
$ | 197,542 | | |
$ | 182,684 | | |
$ | 174,321 | | |
$ | 149,868 | | |
$ | 146,283 | | |
$ | 197,542 | | |
$ | 146,283 | |
| | |
| | | |
| | | |
| | | |
| | | |
| | | |
| | | |
| | |
| Asset Quality Ratios | |
| | | |
| | | |
| | | |
| | | |
| | | |
| | | |
| | |
| Non-performing portfolio assets as a percent of total assets | |
| 0.39 | % | |
| 0.38 | % | |
| 0.33 | % | |
| 0.27 | % | |
| 0.30 | % | |
| 0.39 | % | |
| 0.30 | % |
| Total non-performing assets as a percent of total assets | |
| 0.74 | % | |
| 0.71 | % | |
| 0.69 | % | |
| 0.58 | % | |
| 0.57 | % | |
| 0.74 | % | |
| 0.57 | % |
| Net charge-offs as a percent of average loans (annualized) | |
| 0.18 | % | |
| 0.25 | % | |
| 0.26 | % | |
| 0.23 | % | |
| 0.28 | % | |
| 0.21 | % | |
| 0.25 | % |
AMERIS BANCORP AND SUBSIDIARIES
FINANCIAL TABLES
| Loan Information | |
Table 5 | |
| | |
Jun | | |
Mar | | |
Dec | | |
Sep | | |
Jun | |
| (dollars in thousands) | |
2024 | | |
2024 | | |
2023 | | |
2023 | | |
2023 | |
| Loans by Type | |
| | | |
| | | |
| | | |
| | | |
| | |
| Commercial, financial and agricultural | |
$ | 2,860,973 | | |
$ | 2,758,716 | | |
$ | 2,688,929 | | |
$ | 2,632,836 | | |
$ | 2,718,831 | |
| Consumer | |
| 217,787 | | |
| 232,993 | | |
| 241,552 | | |
| 259,797 | | |
| 307,486 | |
| Indirect automobile | |
| 16,335 | | |
| 24,022 | | |
| 34,257 | | |
| 47,108 | | |
| 63,231 | |
| Mortgage warehouse | |
| 1,070,921 | | |
| 891,336 | | |
| 818,728 | | |
| 852,823 | | |
| 1,147,413 | |
| Municipal | |
| 454,967 | | |
| 477,567 | | |
| 492,668 | | |
| 497,093 | | |
| 510,410 | |
| Premium Finance | |
| 1,151,261 | | |
| 998,726 | | |
| 946,562 | | |
| 1,007,334 | | |
| 988,731 | |
| Real estate - construction and development | |
| 2,336,987 | | |
| 2,264,346 | | |
| 2,129,187 | | |
| 2,236,686 | | |
| 2,217,744 | |
| Real estate - commercial and farmland | |
| 8,103,634 | | |
| 8,131,248 | | |
| 8,059,754 | | |
| 7,865,389 | | |
| 7,815,779 | |
| Real estate - residential | |
| 4,779,738 | | |
| 4,821,306 | | |
| 4,857,666 | | |
| 4,802,013 | | |
| 4,702,134 | |
| Total loans | |
$ | 20,992,603 | | |
$ | 20,600,260 | | |
$ | 20,269,303 | | |
$ | 20,201,079 | | |
$ | 20,471,759 | |
| | |
| | | |
| | | |
| | | |
| | | |
| | |
| Loans by Risk Grade | |
| | | |
| | | |
| | | |
| | | |
| | |
| Pass | |
$ | 20,623,416 | | |
$ | 20,221,302 | | |
$ | 19,846,731 | | |
$ | 19,812,895 | | |
$ | 20,114,816 | |
| Other assets especially mentioned | |
| 115,477 | | |
| 137,225 | | |
| 203,725 | | |
| 187,449 | | |
| 171,035 | |
| Substandard | |
| 253,710 | | |
| 241,733 | | |
| 218,847 | | |
| 200,735 | | |
| 185,908 | |
| Total loans | |
$ | 20,992,603 | | |
$ | 20,600,260 | | |
$ | 20,269,303 | | |
$ | 20,201,079 | | |
$ | 20,471,759 | |
AMERIS BANCORP AND SUBSIDIARIES
FINANCIAL TABLES
| Average Balances | |
Table 6 | |
| | |
Three Months Ended | | |
Six Months
Ended | |
| | |
Jun | | |
Mar | | |
Dec | | |
Sep | | |
Jun | | |
Jun | | |
Jun | |
| (dollars in thousands) | |
2024 | | |
2024 | | |
2023 | | |
2023 | | |
2023 | | |
2024 | | |
2023 | |
| Earning Assets | |
| | | |
| | | |
| | | |
| | | |
| | | |
| | | |
| | |
| Interest-bearing deposits in banks | |
$ | 899,866 | | |
$ | 923,845 | | |
$ | 936,733 | | |
$ | 864,028 | | |
$ | 998,609 | | |
$ | 911,855 | | |
$ | 929,496 | |
| Investment securities - taxable | |
| 1,663,841 | | |
| 1,599,705 | | |
| 1,591,567 | | |
| 1,650,164 | | |
| 1,699,096 | | |
| 1,631,773 | | |
| 1,708,222 | |
| Investment securities - nontaxable | |
| 41,396 | | |
| 41,287 | | |
| 40,227 | | |
| 40,896 | | |
| 42,580 | | |
| 41,341 | | |
| 42,814 | |
| Loans held for sale | |
| 491,000 | | |
| 323,351 | | |
| 405,080 | | |
| 464,452 | | |
| 577,606 | | |
| 407,175 | | |
| 534,192 | |
| Loans | |
| 20,820,361 | | |
| 20,320,678 | | |
| 20,252,773 | | |
| 20,371,689 | | |
| 20,164,938 | | |
| 20,570,520 | | |
| 19,993,794 | |
| Total Earning Assets | |
$ | 23,916,464 | | |
$ | 23,208,866 | | |
$ | 23,226,380 | | |
$ | 23,391,229 | | |
$ | 23,482,829 | | |
$ | 23,562,664 | | |
$ | 23,208,518 | |
| | |
| | | |
| | | |
| | | |
| | | |
| | | |
| | | |
| | |
| Deposits | |
| | | |
| | | |
| | | |
| | | |
| | | |
| | | |
| | |
| Noninterest-bearing deposits | |
$ | 6,558,427 | | |
$ | 6,403,300 | | |
$ | 6,572,190 | | |
$ | 6,655,191 | | |
$ | 6,729,789 | | |
$ | 6,480,864 | | |
$ | 6,931,852 | |
| NOW accounts | |
| 3,824,538 | | |
| 3,829,977 | | |
| 3,760,992 | | |
| 3,661,701 | | |
| 3,949,850 | | |
| 3,827,257 | | |
| 4,047,484 | |
| MMDA | |
| 6,251,719 | | |
| 5,952,389 | | |
| 5,994,361 | | |
| 5,527,731 | | |
| 5,002,590 | | |
| 6,102,054 | | |
| 4,998,417 | |
| Savings accounts | |
| 781,588 | | |
| 795,887 | | |
| 817,075 | | |
| 915,678 | | |
| 1,009,749 | | |
| 788,738 | | |
| 1,007,693 | |
| Retail CDs | |
| 2,430,416 | | |
| 2,378,678 | | |
| 2,281,357 | | |
| 2,200,413 | | |
| 2,024,014 | | |
| 2,404,547 | | |
| 1,819,307 | |
| Brokered CDs | |
| 1,167,174 | | |
| 1,381,382 | | |
| 1,122,684 | | |
| 1,441,854 | | |
| 1,393,206 | | |
| 1,274,278 | | |
| 762,672 | |
| Total Deposits | |
| 21,013,862 | | |
| 20,741,613 | | |
| 20,548,659 | | |
| 20,402,568 | | |
| 20,109,198 | | |
| 20,877,738 | | |
| 19,567,425 | |
| Non-Deposit Funding | |
| | | |
| | | |
| | | |
| | | |
| | | |
| | | |
| | |
| Federal funds purchased and securities sold under agreements
to repurchase | |
| 1 | | |
| — | | |
| — | | |
| — | | |
| — | | |
| — | | |
| — | |
| FHLB advances | |
| 548,251 | | |
| 219,589 | | |
| 538,096 | | |
| 943,855 | | |
| 1,408,855 | | |
| 383,920 | | |
| 1,687,286 | |
| Other borrowings | |
| 307,449 | | |
| 308,210 | | |
| 311,091 | | |
| 312,572 | | |
| 316,626 | | |
| 307,829 | | |
| 338,912 | |
| Subordinated deferrable interest debentures | |
| 131,050 | | |
| 130,551 | | |
| 130,054 | | |
| 129,554 | | |
| 129,056 | | |
| 130,801 | | |
| 128,808 | |
| Total Non-Deposit Funding | |
| 986,751 | | |
| 658,350 | | |
| 979,241 | | |
| 1,385,981 | | |
| 1,854,537 | | |
| 822,550 | | |
| 2,155,006 | |
| Total Funding | |
$ | 22,000,613 | | |
$ | 21,399,963 | | |
$ | 21,527,900 | | |
$ | 21,788,549 | | |
$ | 21,963,735 | | |
$ | 21,700,288 | | |
$ | 21,722,431 | |
AMERIS BANCORP AND SUBSIDIARIES
FINANCIAL TABLES
| Interest Income and Interest Expense (TE) | |
Table 7 | |
| | |
Three Months Ended | | |
Six Months
Ended | |
| | |
Jun | | |
Mar | | |
Dec | | |
Sep | | |
Jun | | |
Jun | | |
Jun | |
| (dollars in thousands) | |
2024 | | |
2024 | | |
2023 | | |
2023 | | |
2023 | | |
2024 | | |
2023 | |
| Interest Income | |
| | | |
| | | |
| | | |
| | | |
| | | |
| | | |
| | |
| Interest-bearing deposits in banks | |
$ | 12,376 | | |
$ | 12,637 | | |
$ | 14,368 | | |
$ | 10,769 | | |
$ | 13,686 | | |
$ | 25,013 | | |
$ | 22,799 | |
| Debt securities - taxable | |
| 16,948 | | |
| 13,092 | | |
| 14,033 | | |
| 14,754 | | |
| 15,915 | | |
| 30,040 | | |
| 30,215 | |
| Debt securities - nontaxable (TE) | |
| 423 | | |
| 418 | | |
| 413 | | |
| 418 | | |
| 430 | | |
| 841 | | |
| 859 | |
| Loans held for sale | |
| 8,189 | | |
| 5,348 | | |
| 6,846 | | |
| 7,460 | | |
| 8,398 | | |
| 13,537 | | |
| 15,405 | |
| Loans (TE) | |
| 310,347 | | |
| 298,907 | | |
| 297,501 | | |
| 298,102 | | |
| 284,471 | | |
| 609,254 | | |
| 550,273 | |
| Total Earning Assets | |
$ | 348,283 | | |
$ | 330,402 | | |
$ | 333,161 | | |
$ | 331,503 | | |
$ | 322,900 | | |
$ | 678,685 | | |
$ | 619,551 | |
| | |
| | | |
| | | |
| | | |
| | | |
| | | |
| | | |
| | |
| Interest Expense | |
| | | |
| | | |
| | | |
| | | |
| | | |
| | | |
| | |
| Interest-Bearing Deposits | |
| | | |
| | | |
| | | |
| | | |
| | | |
| | | |
| | |
| NOW accounts | |
$ | 21,020 | | |
$ | 20,574 | | |
$ | 19,293 | | |
$ | 17,255 | | |
$ | 18,003 | | |
$ | 41,594 | | |
$ | 33,036 | |
| MMDA | |
| 58,332 | | |
| 53,953 | | |
| 54,002 | | |
| 45,683 | | |
| 35,224 | | |
| 112,285 | | |
| 63,033 | |
| Savings accounts | |
| 984 | | |
| 986 | | |
| 974 | | |
| 1,791 | | |
| 2,296 | | |
| 1,970 | | |
| 3,584 | |
| Retail CDs | |
| 25,711 | | |
| 24,576 | | |
| 22,257 | | |
| 19,013 | | |
| 14,751 | | |
| 50,287 | | |
| 22,380 | |
| Brokered CDs | |
| 15,198 | | |
| 18,085 | | |
| 15,223 | | |
| 19,257 | | |
| 17,813 | | |
| 33,283 | | |
| 19,236 | |
| Total Interest-Bearing Deposits | |
| 121,245 | | |
| 118,174 | | |
| 111,749 | | |
| 102,999 | | |
| 88,087 | | |
| 239,419 | | |
| 141,269 | |
| Non-Deposit Funding | |
| | | |
| | | |
| | | |
| | | |
| | | |
| | | |
| | |
| FHLB advances | |
| 7,167 | | |
| 2,578 | | |
| 7,089 | | |
| 12,543 | | |
| 17,222 | | |
| 9,745 | | |
| 39,670 | |
| Other borrowings | |
| 3,574 | | |
| 3,879 | | |
| 3,798 | | |
| 3,821 | | |
| 3,902 | | |
| 7,453 | | |
| 9,251 | |
| Subordinated deferrable interest debentures | |
| 3,416 | | |
| 3,433 | | |
| 3,477 | | |
| 3,439 | | |
| 3,201 | | |
| 6,849 | | |
| 6,286 | |
| Total Non-Deposit Funding | |
| 14,157 | | |
| 9,890 | | |
| 14,364 | | |
| 19,803 | | |
| 24,325 | | |
| 24,047 | | |
| 55,207 | |
| Total Interest-Bearing
Funding | |
$ | 135,402 | | |
$ | 128,064 | | |
$ | 126,113 | | |
$ | 122,802 | | |
$ | 112,412 | | |
$ | 263,466 | | |
$ | 196,476 | |
| | |
| | | |
| | | |
| | | |
| | | |
| | | |
| | | |
| | |
| Net Interest Income (TE) | |
$ | 212,881 | | |
$ | 202,338 | | |
$ | 207,048 | | |
$ | 208,701 | | |
$ | 210,488 | | |
$ | 415,219 | | |
$ | 423,075 | |
AMERIS BANCORP AND SUBSIDIARIES
FINANCIAL TABLES
| Yields(1) | |
Table 8 | |
| | |
Three Months Ended | | |
Six Months
Ended | |
| | |
Jun | | |
Mar | | |
Dec | | |
Sep | | |
Jun | | |
Jun | | |
Jun | |
| | |
2024 | | |
2024 | | |
2023 | | |
2023 | | |
2023 | | |
2024 | | |
2023 | |
| Earning Assets | |
| | | |
| | | |
| | | |
| | | |
| | | |
| | | |
| | |
| Interest-bearing deposits in banks | |
| 5.53 | % | |
| 5.50 | % | |
| 6.09 | % | |
| 4.94 | % | |
| 5.50 | % | |
| 5.52 | % | |
| 4.95 | % |
| Debt securities - taxable | |
| 4.10 | % | |
| 3.29 | % | |
| 3.50 | % | |
| 3.55 | % | |
| 3.76 | % | |
| 3.70 | % | |
| 3.57 | % |
| Debt securities - nontaxable (TE) | |
| 4.11 | % | |
| 4.07 | % | |
| 4.07 | % | |
| 4.06 | % | |
| 4.05 | % | |
| 4.09 | % | |
| 4.05 | % |
| Loans held for sale | |
| 6.71 | % | |
| 6.65 | % | |
| 6.71 | % | |
| 6.37 | % | |
| 5.83 | % | |
| 6.69 | % | |
| 5.82 | % |
| Loans (TE) | |
| 6.00 | % | |
| 5.92 | % | |
| 5.83 | % | |
| 5.81 | % | |
| 5.66 | % | |
| 5.96 | % | |
| 5.55 | % |
| Total Earning Assets | |
| 5.86 | % | |
| 5.73 | % | |
| 5.69 | % | |
| 5.62 | % | |
| 5.52 | % | |
| 5.79 | % | |
| 5.38 | % |
| | |
| | | |
| | | |
| | | |
| | | |
| | | |
| | | |
| | |
| Interest-Bearing Deposits | |
| | | |
| | | |
| | | |
| | | |
| | | |
| | | |
| | |
| NOW accounts | |
| 2.21 | % | |
| 2.16 | % | |
| 2.04 | % | |
| 1.87 | % | |
| 1.83 | % | |
| 2.19 | % | |
| 1.65 | % |
| MMDA | |
| 3.75 | % | |
| 3.65 | % | |
| 3.57 | % | |
| 3.28 | % | |
| 2.82 | % | |
| 3.70 | % | |
| 2.54 | % |
| Savings accounts | |
| 0.51 | % | |
| 0.50 | % | |
| 0.47 | % | |
| 0.78 | % | |
| 0.91 | % | |
| 0.50 | % | |
| 0.72 | % |
| Retail CDs | |
| 4.25 | % | |
| 4.16 | % | |
| 3.87 | % | |
| 3.43 | % | |
| 2.92 | % | |
| 4.21 | % | |
| 2.48 | % |
| Brokered CDs | |
| 5.24 | % | |
| 5.27 | % | |
| 5.38 | % | |
| 5.30 | % | |
| 5.13 | % | |
| 5.25 | % | |
| 5.09 | % |
| Total Interest-Bearing Deposits | |
| 3.37 | % | |
| 3.31 | % | |
| 3.17 | % | |
| 2.97 | % | |
| 2.64 | % | |
| 3.34 | % | |
| 2.25 | % |
| Non-Deposit Funding | |
| | | |
| | | |
| | | |
| | | |
| | | |
| | | |
| | |
| Federal funds purchased and securities sold under agreements
to repurchase | |
| — | % | |
| — | % | |
| — | % | |
| — | % | |
| — | % | |
| — | % | |
| — | % |
| FHLB advances | |
| 5.26 | % | |
| 4.72 | % | |
| 5.23 | % | |
| 5.27 | % | |
| 4.90 | % | |
| 5.10 | % | |
| 4.74 | % |
| Other borrowings | |
| 4.68 | % | |
| 5.06 | % | |
| 4.84 | % | |
| 4.85 | % | |
| 4.94 | % | |
| 4.87 | % | |
| 5.50 | % |
| Subordinated deferrable interest debentures | |
| 10.48 | % | |
| 10.58 | % | |
| 10.61 | % | |
| 10.53 | % | |
| 9.95 | % | |
| 10.53 | % | |
| 9.84 | % |
| Total Non-Deposit Funding | |
| 5.77 | % | |
| 6.04 | % | |
| 5.82 | % | |
| 5.67 | % | |
| 5.26 | % | |
| 5.88 | % | |
| 5.17 | % |
| Total Interest-Bearing Liabilities | |
| 3.53 | % | |
| 3.43 | % | |
| 3.35 | % | |
| 3.22 | % | |
| 2.96 | % | |
| 3.48 | % | |
| 2.68 | % |
| | |
| | | |
| | | |
| | | |
| | | |
| | | |
| | | |
| | |
| Net Interest Spread | |
| 2.33 | % | |
| 2.30 | % | |
| 2.34 | % | |
| 2.40 | % | |
| 2.56 | % | |
| 2.31 | % | |
| 2.70 | % |
| | |
| | | |
| | | |
| | | |
| | | |
| | | |
| | | |
| | |
| Net Interest
Margin(2) | |
| 3.58 | % | |
| 3.51 | % | |
| 3.54 | % | |
| 3.54 | % | |
| 3.60 | % | |
| 3.54 | % | |
| 3.68 | % |
| | |
| | | |
| | | |
| | | |
| | | |
| | | |
| | | |
| | |
| Total Cost of Funds(3) | |
| 2.48 | % | |
| 2.41 | % | |
| 2.32 | % | |
| 2.24 | % | |
| 2.05 | % | |
| 2.44 | % | |
| 1.82 | % |
(1) Interest and average rates are calculated on a tax-equivalent
basis using an effective tax rate of 21%.
(2) Rate calculated based on average earning assets.
(3) Rate calculated based on total average funding including
noninterest-bearing deposits.
AMERIS BANCORP AND SUBSIDIARIES
FINANCIAL TABLES
Non-GAAP Reconciliations
| Adjusted Net Income | |
Table 9A | |
| | |
Three Months Ended | | |
Six Months
Ended | |
| | |
Jun | | |
Mar | | |
Dec | | |
Sep | | |
Jun | | |
Jun | | |
Jun | |
| (dollars in thousands except per share data) | |
2024 | | |
2024 | | |
2023 | | |
2023 | | |
2023 | | |
2024 | | |
2023 | |
| Net income available to common shareholders | |
$ | 90,785 | | |
$ | 74,312 | | |
$ | 65,934 | | |
$ | 80,115 | | |
$ | 62,635 | | |
$ | 165,097 | | |
$ | 123,056 | |
| | |
| | | |
| | | |
| | | |
| | | |
| | | |
| | | |
| | |
| Adjustment items: | |
| | | |
| | | |
| | | |
| | | |
| | | |
| | | |
| | |
| Gain on sale of MSR | |
| (4,713 | ) | |
| — | | |
| — | | |
| — | | |
| — | | |
| (4,713 | ) | |
| — | |
| Gain on conversion of Visa Class B-1 stock | |
| (12,554 | ) | |
| — | | |
| — | | |
| — | | |
| — | | |
| (12,554 | ) | |
| — | |
| Gain on BOLI proceeds | |
| (466 | ) | |
| (998 | ) | |
| — | | |
| — | | |
| — | | |
| (1,464 | ) | |
| (486 | ) |
| FDIC special assessment | |
| (895 | ) | |
| 2,909 | | |
| 11,566 | | |
| — | | |
| — | | |
| 2,014 | | |
| — | |
| Gain on bank premises | |
| — | | |
| — | | |
| (1,903 | ) | |
| — | | |
| — | | |
| — | | |
| — | |
| Tax effect of adjustment items (Note 1) | |
| 3,814 | | |
| (611 | ) | |
| (2,029 | ) | |
| — | | |
| — | | |
| 3,203 | | |
| — | |
| After tax adjustment items | |
| (14,814 | ) | |
| 1,300 | | |
| 7,634 | | |
| — | | |
| — | | |
| (13,514 | ) | |
| (486 | ) |
| Tax expense attributable to BOLI restructuring | |
| 4,792 | | |
| — | | |
| — | | |
| — | | |
| — | | |
| 4,792 | | |
| — | |
| Adjusted net income | |
$ | 80,763 | | |
$ | 75,612 | | |
$ | 73,568 | | |
$ | 80,115 | | |
$ | 62,635 | | |
$ | 156,375 | | |
$ | 122,570 | |
| | |
| | | |
| | | |
| | | |
| | | |
| | | |
| | | |
| | |
| Weighted average number of shares - diluted | |
| 69,013,834 | | |
| 69,014,116 | | |
| 69,014,793 | | |
| 68,994,247 | | |
| 69,034,763 | | |
| 69,010,010 | | |
| 69,191,512 | |
| Net income per diluted share | |
$ | 1.32 | | |
$ | 1.08 | | |
$ | 0.96 | | |
$ | 1.16 | | |
$ | 0.91 | | |
$ | 2.39 | | |
$ | 1.78 | |
| Adjusted net income per diluted share | |
$ | 1.17 | | |
$ | 1.10 | | |
$ | 1.07 | | |
$ | 1.16 | | |
$ | 0.91 | | |
$ | 2.27 | | |
$ | 1.77 | |
| | |
| | | |
| | | |
| | | |
| | | |
| | | |
| | | |
| | |
| Average assets | |
$ | 25,954,808 | | |
$ | 25,295,088 | | |
$ | 25,341,990 | | |
$ | 25,525,913 | | |
$ | 25,631,846 | | |
$ | 25,624,948 | | |
$ | 25,375,312 | |
| Return on average assets | |
| 1.41 | % | |
| 1.18 | % | |
| 1.03 | % | |
| 1.25 | % | |
| 0.98 | % | |
| 1.30 | % | |
| 0.98 | % |
| Adjusted return on average assets | |
| 1.25 | % | |
| 1.20 | % | |
| 1.15 | % | |
| 1.25 | % | |
| 0.98 | % | |
| 1.23 | % | |
| 0.97 | % |
| | |
| | | |
| | | |
| | | |
| | | |
| | | |
| | | |
| | |
| Average common equity | |
$ | 3,530,869 | | |
$ | 3,462,871 | | |
$ | 3,383,554 | | |
$ | 3,324,960 | | |
$ | 3,293,049 | | |
$ | 3,496,870 | | |
$ | 3,271,787 | |
| Average tangible common equity | |
$ | 2,433,958 | | |
$ | 2,361,544 | | |
$ | 2,277,810 | | |
$ | 2,214,775 | | |
$ | 2,178,323 | | |
$ | 2,397,751 | | |
$ | 2,154,720 | |
| Return on average common equity | |
| 10.34 | % | |
| 8.63 | % | |
| 7.73 | % | |
| 9.56 | % | |
| 7.63 | % | |
| 9.49 | % | |
| 7.58 | % |
| Adjusted return on average tangible common equity | |
| 13.35 | % | |
| 12.88 | % | |
| 12.81 | % | |
| 14.35 | % | |
| 11.53 | % | |
| 13.12 | % | |
| 11.47 | % |
| | |
| | | |
| | | |
| | | |
| | | |
| | | |
| | | |
| | |
| Note 1: Tax effect is calculated utilizing
a 21% rate for taxable adjustments. Gain on BOLI proceeds is non-taxable and no tax effect is included. |
AMERIS BANCORP AND SUBSIDIARIES
FINANCIAL TABLES
Non-GAAP Reconciliations (continued)
| Adjusted Efficiency Ratio
(TE) | |
Table 9B | |
| | |
Three Months Ended | | |
Six Months
Ended | |
| | |
Jun | | |
Mar | | |
Dec | | |
Sep | | |
Jun | | |
Jun | | |
Jun | |
| (dollars in thousands) | |
2024 | | |
2024 | | |
2023 | | |
2023 | | |
2023 | | |
2024 | | |
2023 | |
| Adjusted Noninterest Expense | |
| | | |
| | | |
| | | |
| | | |
| | | |
| | | |
| | |
| Total noninterest expense | |
$ | 155,357 | | |
$ | 148,711 | | |
$ | 149,011 | | |
$ | 141,446 | | |
$ | 148,403 | | |
$ | 304,068 | | |
$ | 287,824 | |
| Adjustment items: | |
| | | |
| | | |
| | | |
| | | |
| | | |
| | | |
| | |
| FDIC special assessment | |
| 895 | | |
| (2,909 | ) | |
| (11,566 | ) | |
| — | | |
| — | | |
| (2,014 | ) | |
| — | |
| Gain on bank premises | |
| — | | |
| — | | |
| 1,903 | | |
| — | | |
| — | | |
| — | | |
| — | |
| Adjusted noninterest expense | |
$ | 156,252 | | |
$ | 145,802 | | |
$ | 139,348 | | |
$ | 141,446 | | |
$ | 148,403 | | |
$ | 302,054 | | |
$ | 287,824 | |
| | |
| | | |
| | | |
| | | |
| | | |
| | | |
| | | |
| | |
| Total Revenue | |
| | | |
| | | |
| | | |
| | | |
| | | |
| | | |
| | |
| Net interest income | |
$ | 211,921 | | |
$ | 201,388 | | |
$ | 206,101 | | |
$ | 207,751 | | |
$ | 209,540 | | |
$ | 413,309 | | |
$ | 421,192 | |
| Noninterest income | |
| 88,711 | | |
| 65,878 | | |
| 56,248 | | |
| 63,181 | | |
| 67,349 | | |
| 154,589 | | |
| 123,399 | |
| Total revenue | |
$ | 300,632 | | |
$ | 267,266 | | |
$ | 262,349 | | |
$ | 270,932 | | |
$ | 276,889 | | |
$ | 567,898 | | |
$ | 544,591 | |
| | |
| | | |
| | | |
| | | |
| | | |
| | | |
| | | |
| | |
| Adjusted Total Revenue | |
| | | |
| | | |
| | | |
| | | |
| | | |
| | | |
| | |
| Net interest income (TE) | |
$ | 212,881 | | |
$ | 202,338 | | |
$ | 207,048 | | |
$ | 208,701 | | |
$ | 210,488 | | |
$ | 415,219 | | |
$ | 423,075 | |
| Noninterest income | |
| 88,711 | | |
| 65,878 | | |
| 56,248 | | |
| 63,181 | | |
| 67,349 | | |
| 154,589 | | |
| 123,399 | |
| Total revenue (TE) | |
| 301,592 | | |
| 268,216 | | |
| 263,296 | | |
| 271,882 | | |
| 277,837 | | |
| 569,808 | | |
| 546,474 | |
| Adjustment items: | |
| | | |
| | | |
| | | |
| | | |
| | | |
| | | |
| | |
| (Gain) loss on securities | |
| (12,335 | ) | |
| 7 | | |
| 288 | | |
| 16 | | |
| 6 | | |
| (12,328 | ) | |
| — | |
| Gain on sale of MSR | |
| (4,713 | ) | |
| — | | |
| — | | |
| — | | |
| — | | |
| (4,713 | ) | |
| — | |
| Gain on BOLI proceeds | |
| (466 | ) | |
| (998 | ) | |
| — | | |
| — | | |
| — | | |
| (1,464 | ) | |
| (486 | ) |
| Adjusted total revenue (TE) | |
$ | 284,078 | | |
$ | 267,225 | | |
$ | 263,584 | | |
$ | 271,898 | | |
$ | 277,843 | | |
$ | 551,303 | | |
$ | 545,988 | |
| | |
| | | |
| | | |
| | | |
| | | |
| | | |
| | | |
| | |
| Efficiency ratio | |
| 51.68 | % | |
| 55.64 | % | |
| 56.80 | % | |
| 52.21 | % | |
| 53.60 | % | |
| 53.54 | % | |
| 52.85 | % |
| Adjusted efficiency ratio (TE) | |
| 55.00 | % | |
| 54.56 | % | |
| 52.87 | % | |
| 52.02 | % | |
| 53.41 | % | |
| 54.79 | % | |
| 52.72 | % |
| Tangible Book Value Per Share | |
Table 9C | |
| | |
Three Months Ended | | |
Six Months
Ended | |
| | |
Jun | | |
Mar | | |
Dec | | |
Sep | | |
Jun | | |
Jun | | |
Jun | |
| (dollars in thousands except per share data) | |
2024 | | |
2024 | | |
2023 | | |
2023 | | |
2023 | | |
2024 | | |
2023 | |
| Total shareholders' equity | |
$ | 3,566,614 | | |
$ | 3,484,738 | | |
$ | 3,426,747 | | |
$ | 3,347,069 | | |
$ | 3,284,630 | | |
$ | 3,566,614 | | |
$ | 3,284,630 | |
| Less: | |
| | | |
| | | |
| | | |
| | | |
| | | |
| | | |
| | |
| Goodwill | |
| 1,015,646 | | |
| 1,015,646 | | |
| 1,015,646 | | |
| 1,015,646 | | |
| 1,015,646 | | |
| 1,015,646 | | |
| 1,015,646 | |
| Other intangibles, net | |
| 79,120 | | |
| 83,527 | | |
| 87,949 | | |
| 92,375 | | |
| 96,800 | | |
| 79,120 | | |
| 96,800 | |
| Total tangible shareholders' equity | |
$ | 2,471,848 | | |
$ | 2,385,565 | | |
$ | 2,323,152 | | |
$ | 2,239,048 | | |
$ | 2,172,184 | | |
$ | 2,471,848 | | |
$ | 2,172,184 | |
| | |
| | | |
| | | |
| | | |
| | | |
| | | |
| | | |
| | |
| Period end number of shares | |
| 69,066,573 | | |
| 69,115,263 | | |
| 69,053,341 | | |
| 69,138,461 | | |
| 69,139,783 | | |
| 69,066,573 | | |
| 69,139,783 | |
| Book value per share (period end) | |
$ | 51.64 | | |
$ | 50.42 | | |
$ | 49.62 | | |
$ | 48.41 | | |
$ | 47.51 | | |
$ | 51.64 | | |
$ | 47.51 | |
| Tangible book value per share (period end) | |
$ | 35.79 | | |
$ | 34.52 | | |
$ | 33.64 | | |
$ | 32.38 | | |
$ | 31.42 | | |
$ | 35.79 | | |
$ | 31.42 | |
AMERIS BANCORP AND SUBSIDIARIES
FINANCIAL TABLES
Non-GAAP Reconciliations (continued)
| Tangible Common Equity to Tangible Assets |
Table 9D | |
| | |
Three Months Ended | | |
Six Months
Ended | |
| | |
Jun | | |
Mar | | |
Dec | | |
Sep | | |
Jun | | |
Jun | | |
Jun | |
| (dollars in thousands except per share data) | |
2024 | | |
2024 | | |
2023 | | |
2023 | | |
2023 | | |
2024 | | |
2023 | |
| Total shareholders' equity | |
$ | 3,566,614 | | |
$ | 3,484,738 | | |
$ | 3,426,747 | | |
$ | 3,347,069 | | |
$ | 3,284,630 | | |
$ | 3,566,614 | | |
$ | 3,284,630 | |
| Less: | |
| | | |
| | | |
| | | |
| | | |
| | | |
| | | |
| | |
| Goodwill | |
| 1,015,646 | | |
| 1,015,646 | | |
| 1,015,646 | | |
| 1,015,646 | | |
| 1,015,646 | | |
| 1,015,646 | | |
| 1,015,646 | |
| Other intangibles, net | |
| 79,120 | | |
| 83,527 | | |
| 87,949 | | |
| 92,375 | | |
| 96,800 | | |
| 79,120 | | |
| 96,800 | |
| Total tangible shareholders' equity | |
$ | 2,471,848 | | |
$ | 2,385,565 | | |
$ | 2,323,152 | | |
$ | 2,239,048 | | |
$ | 2,172,184 | | |
$ | 2,471,848 | | |
$ | 2,172,184 | |
| | |
| | | |
| | | |
| | | |
| | | |
| | | |
| | | |
| | |
| Total assets | |
$ | 26,520,728 | | |
$ | 25,655,445 | | |
$ | 25,203,699 | | |
$ | 25,697,830 | | |
$ | 25,800,618 | | |
$ | 26,520,728 | | |
$ | 25,800,618 | |
| Less: | |
| | | |
| | | |
| | | |
| | | |
| | | |
| | | |
| | |
| Goodwill | |
| 1,015,646 | | |
| 1,015,646 | | |
| 1,015,646 | | |
| 1,015,646 | | |
| 1,015,646 | | |
| 1,015,646 | | |
| 1,015,646 | |
| Other intangibles, net | |
| 79,120 | | |
| 83,527 | | |
| 87,949 | | |
| 92,375 | | |
| 96,800 | | |
| 79,120 | | |
| 96,800 | |
| Total tangible assets | |
$ | 25,425,962 | | |
$ | 24,556,272 | | |
$ | 24,100,104 | | |
$ | 24,589,809 | | |
$ | 24,688,172 | | |
$ | 25,425,962 | | |
$ | 24,688,172 | |
| | |
| | | |
| | | |
| | | |
| | | |
| | | |
| | | |
| | |
| Equity to Assets | |
| 13.45 | % | |
| 13.58 | % | |
| 13.60 | % | |
| 13.02 | % | |
| 12.73 | % | |
| 13.45 | % | |
| 12.73 | % |
| Tangible Common Equity to Tangible Assets | |
| 9.72 | % | |
| 9.71 | % | |
| 9.64 | % | |
| 9.11 | % | |
| 8.80 | % | |
| 9.72 | % | |
| 8.80 | % |
| PPNR ROA | |
Table 9E | |
| | |
Three Months Ended | | |
Six Months
Ended | |
| | |
Jun | | |
Mar | | |
Dec | | |
Sep | | |
Jun | | |
Jun | | |
Jun | |
| (dollars in thousands except per share data) | |
2024 | | |
2024 | | |
2023 | | |
2023 | | |
2023 | | |
2024 | | |
2023 | |
| Net income | |
$ | 90,785 | | |
$ | 74,312 | | |
$ | 65,934 | | |
$ | 80,115 | | |
$ | 62,635 | | |
$ | 165,097 | | |
$ | 123,056 | |
| Plus: | |
| | | |
| | | |
| | | |
| | | |
| | | |
| | | |
| | |
| Income taxes | |
| 35,717 | | |
| 23,138 | | |
| 24,452 | | |
| 24,912 | | |
| 20,335 | | |
| 58,855 | | |
| 38,466 | |
| Provision for credit losses | |
| 18,773 | | |
| 21,105 | | |
| 22,952 | | |
| 24,459 | | |
| 45,516 | | |
| 39,878 | | |
| 95,245 | |
| PPNR | |
$ | 145,275 | | |
$ | 118,555 | | |
$ | 113,338 | | |
$ | 129,486 | | |
$ | 128,486 | | |
$ | 263,830 | | |
$ | 256,767 | |
| | |
| | | |
| | | |
| | | |
| | | |
| | | |
| | | |
| | |
| Average Assets | |
$ | 25,954,808 | | |
$ | 25,295,088 | | |
$ | 25,341,990 | | |
$ | 25,525,913 | | |
$ | 25,631,846 | | |
$ | 25,624,948 | | |
$ | 25,375,312 | |
| | |
| | | |
| | | |
| | | |
| | | |
| | | |
| | | |
| | |
| Return on Average Assets (ROA) | |
| 1.41 | % | |
| 1.18 | % | |
| 1.03 | % | |
| 1.25 | % | |
| 0.98 | % | |
| 1.30 | % | |
| 0.98 | % |
| PPNR ROA | |
| 2.25 | % | |
| 1.89 | % | |
| 1.77 | % | |
| 2.01 | % | |
| 2.01 | % | |
| 2.07 | % | |
| 2.04 | % |
AMERIS BANCORP AND SUBSIDIARIES
FINANCIAL TABLES
| Segment Reporting | |
Table 10 | |
| | |
Three Months Ended | | |
Six Months
Ended | |
| | |
Jun | | |
Mar | | |
Dec | | |
Sep | | |
Jun | | |
Jun | | |
Jun | |
| (dollars in thousands) | |
2024 | | |
2024 | | |
2023 | | |
2023 | | |
2023 | | |
2024 | | |
2023 | |
| Retail Mortgage Division | |
| | | |
| | | |
| | | |
| | | |
| | | |
| | | |
| | |
| Net interest income | |
$ | 23,742 | | |
$ | 23,287 | | |
$ | 24,053 | | |
$ | 22,805 | | |
$ | 21,417 | | |
$ | 47,029 | | |
$ | 41,444 | |
| Provision for credit losses | |
| (2,882 | ) | |
| 2,332 | | |
| 1,005 | | |
| 2,399 | | |
| 3,278 | | |
| (550 | ) | |
| 6,131 | |
| Noninterest income | |
| 50,145 | | |
| 38,765 | | |
| 30,588 | | |
| 35,691 | | |
| 39,808 | | |
| 88,910 | | |
| 70,866 | |
| Noninterest expense | |
| | | |
| | | |
| | | |
| | | |
| | | |
| | | |
| | |
| Salaries and employee benefits | |
| 25,254 | | |
| 21,073 | | |
| 16,996 | | |
| 21,231 | | |
| 21,930 | | |
| 46,327 | | |
| 42,090 | |
| Occupancy and equipment expenses | |
| 1,008 | | |
| 1,049 | | |
| 1,210 | | |
| 1,182 | | |
| 1,224 | | |
| 2,057 | | |
| 2,507 | |
| Data processing and telecommunications expenses | |
| 1,276 | | |
| 1,366 | | |
| 1,318 | | |
| 1,052 | | |
| 1,397 | | |
| 2,642 | | |
| 2,466 | |
| Other noninterest expenses | |
| 13,397 | | |
| 12,530 | | |
| 11,634 | | |
| 12,153 | | |
| 11,859 | | |
| 25,927 | | |
| 23,606 | |
| Total noninterest expense | |
| 40,935 | | |
| 36,018 | | |
| 31,158 | | |
| 35,618 | | |
| 36,410 | | |
| 76,953 | | |
| 70,669 | |
| Income before income tax expense | |
| 35,834 | | |
| 23,702 | | |
| 22,478 | | |
| 20,479 | | |
| 21,537 | | |
| 59,536 | | |
| 35,510 | |
| Income tax expense | |
| 7,525 | | |
| 4,978 | | |
| 4,720 | | |
| 4,301 | | |
| 4,523 | | |
| 12,503 | | |
| 7,457 | |
| Net income | |
$ | 28,309 | | |
$ | 18,724 | | |
$ | 17,758 | | |
$ | 16,178 | | |
$ | 17,014 | | |
$ | 47,033 | | |
$ | 28,053 | |
| | |
| | | |
| | | |
| | | |
| | | |
| | | |
| | | |
| | |
| Warehouse Lending Division | |
| | | |
| | | |
| | | |
| | | |
| | | |
| | | |
| | |
| Net interest income | |
$ | 6,292 | | |
$ | 6,028 | | |
$ | 5,965 | | |
$ | 6,008 | | |
$ | 6,166 | | |
$ | 12,320 | | |
$ | 11,866 | |
| Provision for credit losses | |
| 359 | | |
| 145 | | |
| (68 | ) | |
| (589 | ) | |
| 411 | | |
| 504 | | |
| 217 | |
| Noninterest income | |
| 1,028 | | |
| 740 | | |
| 929 | | |
| 662 | | |
| 1,404 | | |
| 1,768 | | |
| 1,884 | |
| Noninterest expense | |
| | | |
| | | |
| | | |
| | | |
| | | |
| | | |
| | |
| Salaries and employee benefits | |
| 1,124 | | |
| 888 | | |
| 296 | | |
| 924 | | |
| 772 | | |
| 2,012 | | |
| 1,574 | |
| Occupancy and equipment expenses | |
| 7 | | |
| 7 | | |
| 3 | | |
| 1 | | |
| — | | |
| 14 | | |
| 1 | |
| Data processing and telecommunications expenses | |
| 59 | | |
| 25 | | |
| 51 | | |
| 30 | | |
| 44 | | |
| 84 | | |
| 90 | |
| Other noninterest expenses | |
| 298 | | |
| 237 | | |
| 229 | | |
| 219 | | |
| 223 | | |
| 535 | | |
| 425 | |
| Total noninterest expense | |
| 1,488 | | |
| 1,157 | | |
| 579 | | |
| 1,174 | | |
| 1,039 | | |
| 2,645 | | |
| 2,090 | |
| Income before income tax expense | |
| 5,473 | | |
| 5,466 | | |
| 6,383 | | |
| 6,085 | | |
| 6,120 | | |
| 10,939 | | |
| 11,443 | |
| Income tax expense | |
| 1,149 | | |
| 1,148 | | |
| 1,340 | | |
| 1,278 | | |
| 1,285 | | |
| 2,297 | | |
| 2,403 | |
| Net income | |
$ | 4,324 | | |
$ | 4,318 | | |
$ | 5,043 | | |
$ | 4,807 | | |
$ | 4,835 | | |
$ | 8,642 | | |
$ | 9,040 | |
| | |
| | | |
| | | |
| | | |
| | | |
| | | |
| | | |
| | |
| Premium Finance Division | |
| | | |
| | | |
| | | |
| | | |
| | | |
| | | |
| | |
| Net interest income | |
$ | 8,350 | | |
$ | 7,605 | | |
$ | 7,801 | | |
$ | 9,381 | | |
$ | 8,185 | | |
$ | 15,955 | | |
$ | 16,825 | |
| Provision for credit losses | |
| 408 | | |
| (499 | ) | |
| 27 | | |
| 139 | | |
| 572 | | |
| (91 | ) | |
| 606 | |
| Noninterest income | |
| 11 | | |
| 10 | | |
| 9 | | |
| 4 | | |
| 9 | | |
| 21 | | |
| 18 | |
| Noninterest expense | |
| | | |
| | | |
| | | |
| | | |
| | | |
| | | |
| | |
| Salaries and employee benefits | |
| 1,900 | | |
| 2,053 | | |
| 1,973 | | |
| 2,308 | | |
| 2,122 | | |
| 3,953 | | |
| 4,319 | |
| Occupancy and equipment expenses | |
| 70 | | |
| 76 | | |
| 83 | | |
| 89 | | |
| 83 | | |
| 146 | | |
| 142 | |
| Data processing and telecommunications expenses | |
| 102 | | |
| 79 | | |
| 100 | | |
| 73 | | |
| 66 | | |
| 181 | | |
| 151 | |
| Other noninterest expenses | |
| 1,095 | | |
| 1,028 | | |
| 1,057 | | |
| 1,027 | | |
| 1,036 | | |
| 2,123 | | |
| 2,133 | |
| Total noninterest expense | |
| 3,167 | | |
| 3,236 | | |
| 3,213 | | |
| 3,497 | | |
| 3,307 | | |
| 6,403 | | |
| 6,745 | |
| Income before income tax expense | |
| 4,786 | | |
| 4,878 | | |
| 4,570 | | |
| 5,749 | | |
| 4,315 | | |
| 9,664 | | |
| 9,492 | |
| Income tax expense | |
| 953 | | |
| 984 | | |
| 945 | | |
| 1,170 | | |
| 869 | | |
| 1,937 | | |
| 1,919 | |
| Net income | |
$ | 3,833 | | |
$ | 3,894 | | |
$ | 3,625 | | |
$ | 4,579 | | |
$ | 3,446 | | |
$ | 7,727 | | |
$ | 7,573 | |
AMERIS BANCORP AND SUBSIDIARIES
FINANCIAL TABLES
| Segment Reporting (continued) | |
Table 10 | |
| | |
Three Months Ended | | |
Six Months
Ended | |
| | |
Jun | | |
Mar | | |
Dec | | |
Sep | | |
Jun | | |
Jun | | |
Jun | |
| (dollars in thousands) | |
2024 | | |
2024 | | |
2023 | | |
2023 | | |
2023 | | |
2024 | | |
2023 | |
| Banking Division | |
| | | |
| | | |
| | | |
| | | |
| | | |
| | | |
| | |
| Net interest income | |
$ | 173,537 | | |
$ | 164,468 | | |
$ | 168,282 | | |
$ | 169,557 | | |
$ | 173,772 | | |
$ | 338,005 | | |
$ | 351,057 | |
| Provision for credit losses | |
| 20,888 | | |
| 19,127 | | |
| 21,988 | | |
| 22,510 | | |
| 41,255 | | |
| 40,015 | | |
| 88,291 | |
| Noninterest income | |
| 37,527 | | |
| 26,363 | | |
| 24,722 | | |
| 26,824 | | |
| 26,128 | | |
| 63,890 | | |
| 50,631 | |
| Noninterest expense | |
| | | |
| | | |
| | | |
| | | |
| | | |
| | | |
| | |
| Salaries and employee benefits | |
| 59,923 | | |
| 58,916 | | |
| 56,701 | | |
| 57,435 | | |
| 56,512 | | |
| 118,839 | | |
| 114,263 | |
| Occupancy and equipment expenses | |
| 11,474 | | |
| 11,753 | | |
| 11,901 | | |
| 11,473 | | |
| 11,215 | | |
| 23,227 | | |
| 22,858 | |
| Data processing and telecommunications expenses | |
| 13,756 | | |
| 13,184 | | |
| 12,559 | | |
| 11,818 | | |
| 11,944 | | |
| 26,940 | | |
| 23,778 | |
| Other noninterest expenses | |
| 24,614 | | |
| 24,447 | | |
| 32,900 | | |
| 20,431 | | |
| 27,976 | | |
| 49,061 | | |
| 47,421 | |
| Total noninterest expense | |
| 109,767 | | |
| 108,300 | | |
| 114,061 | | |
| 101,157 | | |
| 107,647 | | |
| 218,067 | | |
| 208,320 | |
| Income before income tax expense | |
| 80,409 | | |
| 63,404 | | |
| 56,955 | | |
| 72,714 | | |
| 50,998 | | |
| 143,813 | | |
| 105,077 | |
| Income tax expense | |
| 26,090 | | |
| 16,028 | | |
| 17,447 | | |
| 18,163 | | |
| 13,658 | | |
| 42,118 | | |
| 26,687 | |
| Net income | |
$ | 54,319 | | |
$ | 47,376 | | |
$ | 39,508 | | |
$ | 54,551 | | |
$ | 37,340 | | |
$ | 101,695 | | |
$ | 78,390 | |
| | |
| | | |
| | | |
| | | |
| | | |
| | | |
| | | |
| | |
| Total Consolidated | |
| | | |
| | | |
| | | |
| | | |
| | | |
| | | |
| | |
| Net interest income | |
$ | 211,921 | | |
$ | 201,388 | | |
$ | 206,101 | | |
$ | 207,751 | | |
$ | 209,540 | | |
$ | 413,309 | | |
$ | 421,192 | |
| Provision for credit losses | |
| 18,773 | | |
| 21,105 | | |
| 22,952 | | |
| 24,459 | | |
| 45,516 | | |
| 39,878 | | |
| 95,245 | |
| Noninterest income | |
| 88,711 | | |
| 65,878 | | |
| 56,248 | | |
| 63,181 | | |
| 67,349 | | |
| 154,589 | | |
| 123,399 | |
| Noninterest expense | |
| | | |
| | | |
| | | |
| | | |
| | | |
| | | |
| | |
| Salaries and employee benefits | |
| 88,201 | | |
| 82,930 | | |
| 75,966 | | |
| 81,898 | | |
| 81,336 | | |
| 171,131 | | |
| 162,246 | |
| Occupancy and equipment expenses | |
| 12,559 | | |
| 12,885 | | |
| 13,197 | | |
| 12,745 | | |
| 12,522 | | |
| 25,444 | | |
| 25,508 | |
| Data processing and telecommunications expenses | |
| 15,193 | | |
| 14,654 | | |
| 14,028 | | |
| 12,973 | | |
| 13,451 | | |
| 29,847 | | |
| 26,485 | |
| Other noninterest expenses | |
| 39,404 | | |
| 38,242 | | |
| 45,820 | | |
| 33,830 | | |
| 41,094 | | |
| 77,646 | | |
| 73,585 | |
| Total noninterest expense | |
| 155,357 | | |
| 148,711 | | |
| 149,011 | | |
| 141,446 | | |
| 148,403 | | |
| 304,068 | | |
| 287,824 | |
| Income before income tax expense | |
| 126,502 | | |
| 97,450 | | |
| 90,386 | | |
| 105,027 | | |
| 82,970 | | |
| 223,952 | | |
| 161,522 | |
| Income tax expense | |
| 35,717 | | |
| 23,138 | | |
| 24,452 | | |
| 24,912 | | |
| 20,335 | | |
| 58,855 | | |
| 38,466 | |
| Net income | |
$ | 90,785 | | |
$ | 74,312 | | |
$ | 65,934 | | |
$ | 80,115 | | |
$ | 62,635 | | |
$ | 165,097 | | |
$ | 123,056 | |
Exhibit 99.2

2 nd Quarter 2024 Results Investor Presentation
Cautionary Statements 1 This presentation contains forward - looking statements, as defined by federal securities laws, including, among other forward - looking statements, certain plans, expectations and goals . Words such as “may,” “believe,” “expect,” “anticipate,” “intend,” “will,” “should,” “plan,” “estimate,” “predict,” “continue” and “potential” or the negative of these terms or other comparable terminology, as well as similar expressions, are meant to identify forward - looking statements . The forward - looking statements in this presentation are based on current expectations and are provided to assist in the understanding of potential future performance . Such forward - looking statements involve numerous assumptions, risks and uncertainties that may cause actual results to differ materially from those expressed or implied in any such statements, including, without limitation, the following : general competitive, economic, unemployment, political and market conditions and fluctuations, including real estate market conditions, and the effects of such conditions and fluctuations on the creditworthiness of borrowers, collateral values, asset recovery values and the value of investment securities ; movements in interest rates and their impacts on net interest margin, investment security valuations and other performance measures ; expectations on credit quality and performance ; legislative and regulatory changes ; changes in U . S . government monetary and fiscal policy ; competitive pressures on product pricing and services ; the success and timing of other business strategies ; our outlook and long - term goals for future growth ; and natural disasters, geopolitical events, acts of war or terrorism or other hostilities, public health crises and other catastrophic events beyond our control . For a discussion of some of the other risks and other factors that may cause such forward - looking statements to differ materially from actual results, please refer to the Company’s filings with the Securities and Exchange Commission, including the Company’s Annual Report on Form 10 - K for the year ended December 31 , 2023 and the Company’s subsequently filed periodic reports and other filings . Forward - looking statements speak only as of the date they are made, and the Company undertakes no obligation to update or revise forward - looking statements .
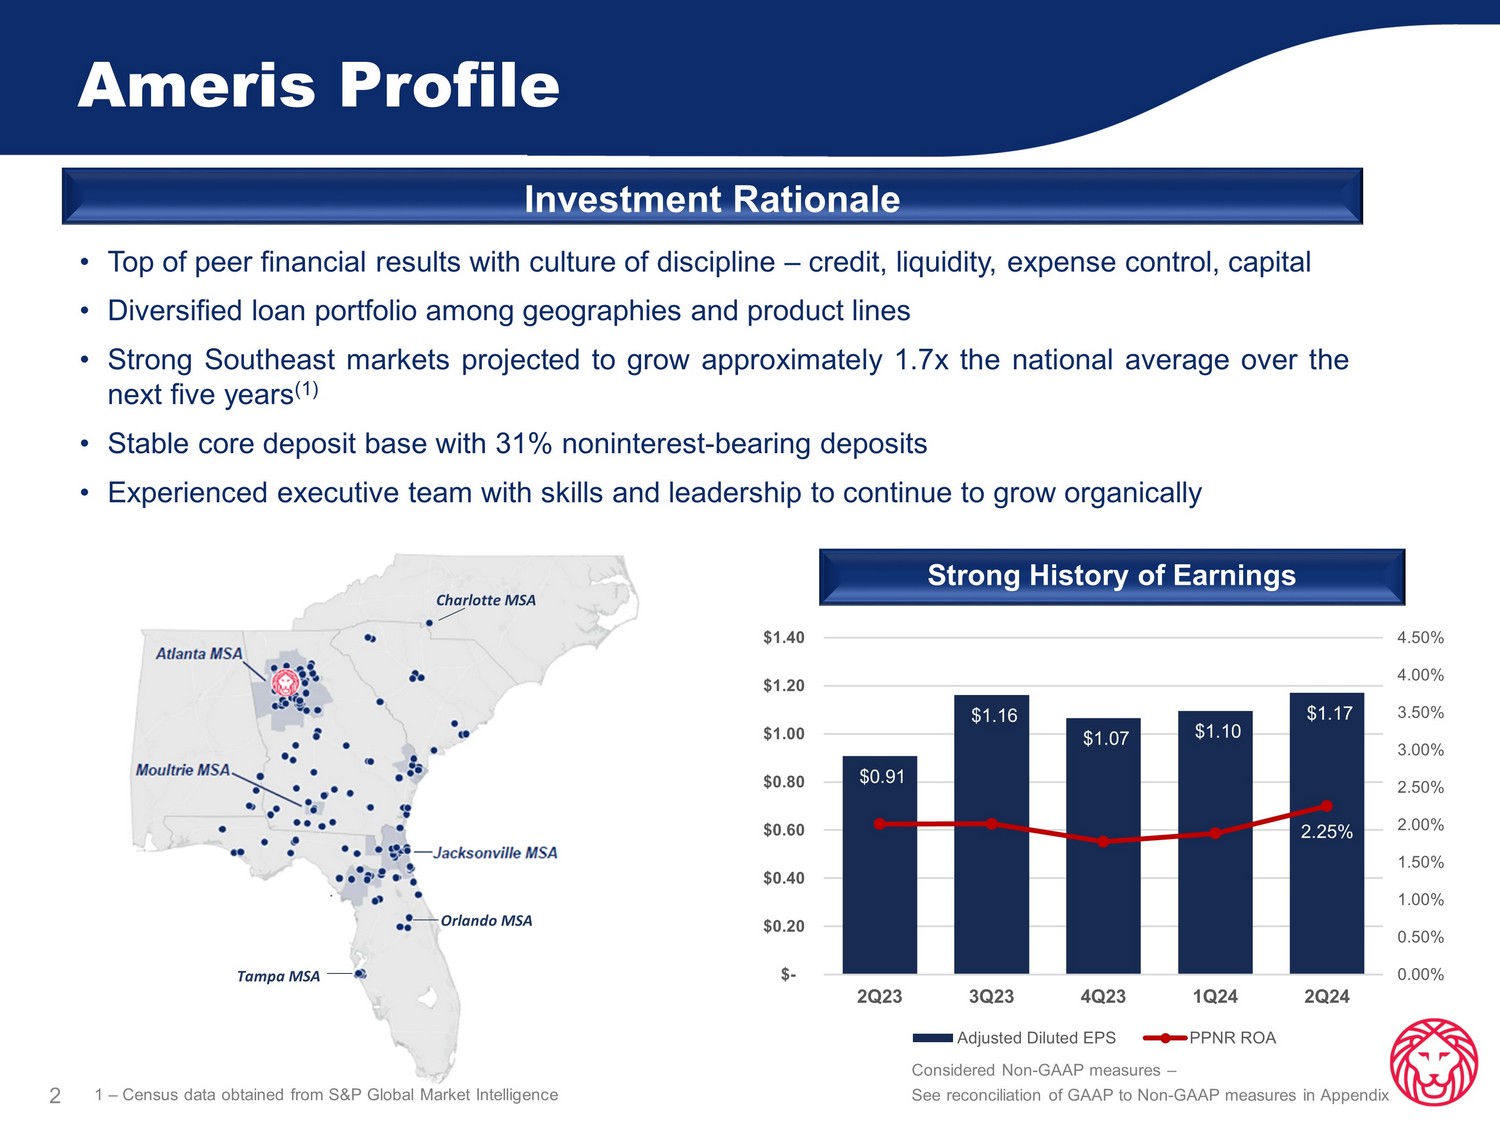
Ameris Profile Investment Rationale • Top of peer financial results with culture of discipline – credit, liquidity, expense control, capital • Diversified loan portfolio among geographies and product lines • Strong Southeast markets projected to grow approximately 1 . 7 x the national average over the next five years ( 1 ) • Stable core deposit base with 31 % noninterest - bearing deposits • Experienced executive team with skills and leadership to continue to grow organically Strong History of Earnings 2 Charlotte MSA Tampa MSA Orlando MSA $0.91 $1.16 $1.07 $1.10 $1.17 2.25% 0.00% 0.50% 1.00% 1.50% 2.00% 2.50% 3.00% 3.50% 4.00% 4.50% $- $0.20 $0.40 $0.60 $0.80 $1.00 $1.20 $1.40 2Q23 3Q23 4Q23 1Q24 2Q24 Adjusted Diluted EPS PPNR ROA 1 – Census data obtained from S&P Global Market Intelligence Considered Non - GAAP measures – See reconciliation of GAAP to Non - GAAP measures in Appendix
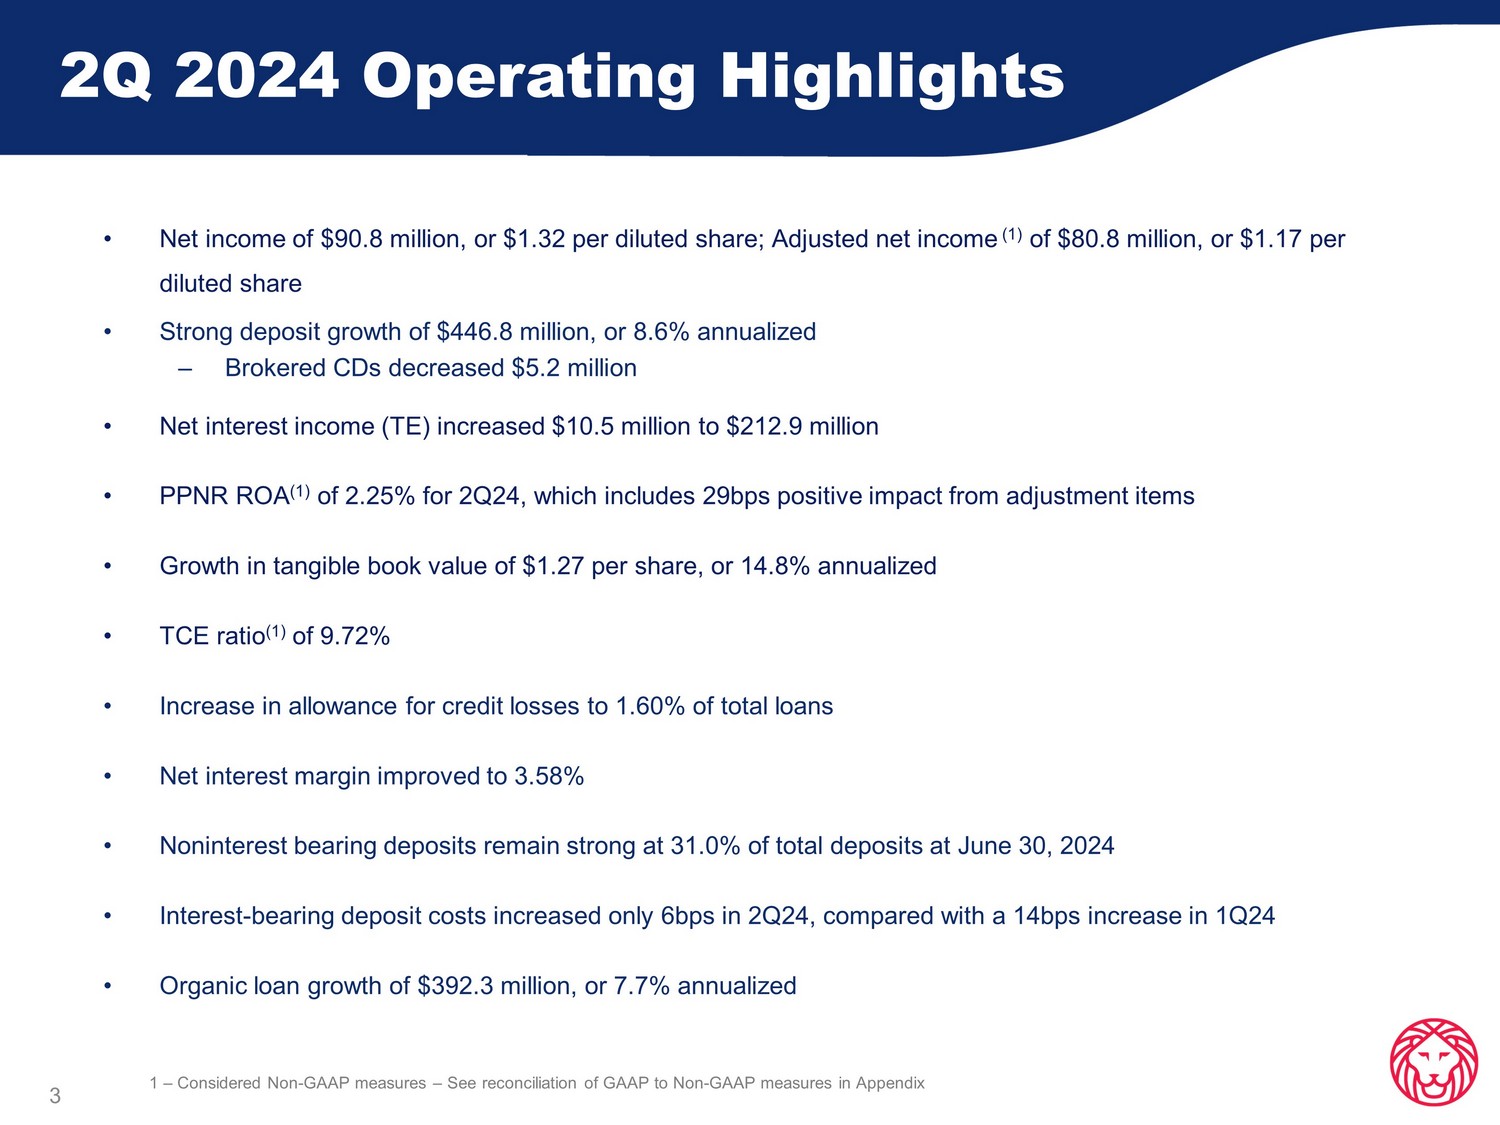
2Q 2024 Operating Highlights 3 • Net income of $90.8 million, or $1.32 per diluted share; Adjusted net income (1) of $80.8 million, or $1.17 per diluted share • Strong deposit growth of $446.8 million, or 8.6% annualized – Brokered CDs decreased $5.2 million • Net interest income (TE) increased $10.5 million to $212.9 million • PPNR ROA (1) of 2.25% for 2Q24, which includes 29bps positive impact from adjustment items • Growth in tangible book value of $1.27 per share, or 14.8% annualized • TCE ratio (1) of 9.72% • Increase in allowance for credit losses to 1.60% of total loans • Net interest margin improved to 3.58% • Noninterest bearing deposits remain strong at 31.0% of total deposits at June 30, 2024 • Interest - bearing deposit costs increased only 6bps in 2Q24, compared with a 14bps increase in 1Q24 • Organic loan growth of $392.3 million, or 7.7% annualized 1 – Considered Non - GAAP measures – See reconciliation of GAAP to Non - GAAP measures in Appendix
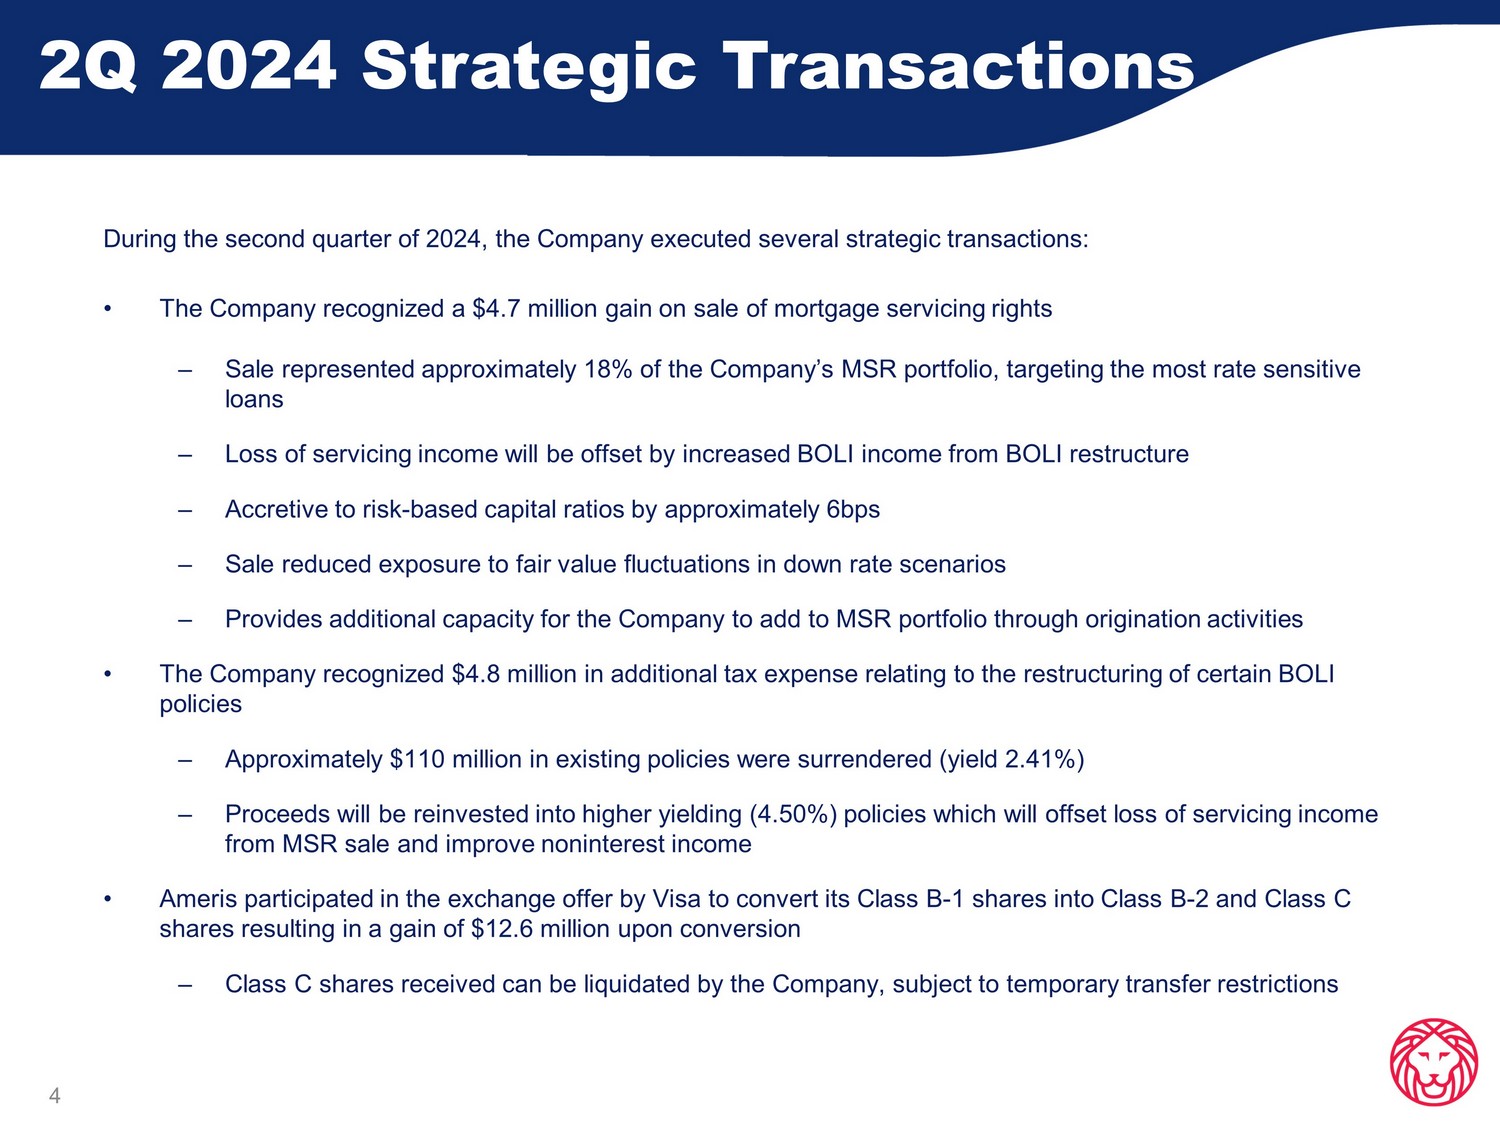
2Q 2024 Strategic Transactions 4 During the second quarter of 2024, the Company executed several strategic transactions: • The Company recognized a $4.7 million gain on sale of mortgage servicing rights – Sale represented approximately 18% of the Company’s MSR portfolio, targeting the most rate sensitive loans – Loss of servicing income will be offset by increased BOLI income from BOLI restructure – Accretive to risk - based capital ratios by approximately 6bps – Sale reduced exposure to fair value fluctuations in down rate scenarios – Provides additional capacity for the Company to add to MSR portfolio through origination activities • The Company recognized $4.8 million in additional tax expense relating to the restructuring of certain BOLI policies – Approximately $110 million in existing policies were surrendered (yield 2.41%) – Proceeds will be reinvested into higher yielding (4.50%) policies which will offset loss of servicing income from MSR sale and improve noninterest income • Ameris participated in the exchange offer by Visa to convert its Class B - 1 shares into Class B - 2 and Class C shares resulting in a gain of $12.6 million upon conversion – Class C shares received can be liquidated by the Company, subject to temporary transfer restrictions
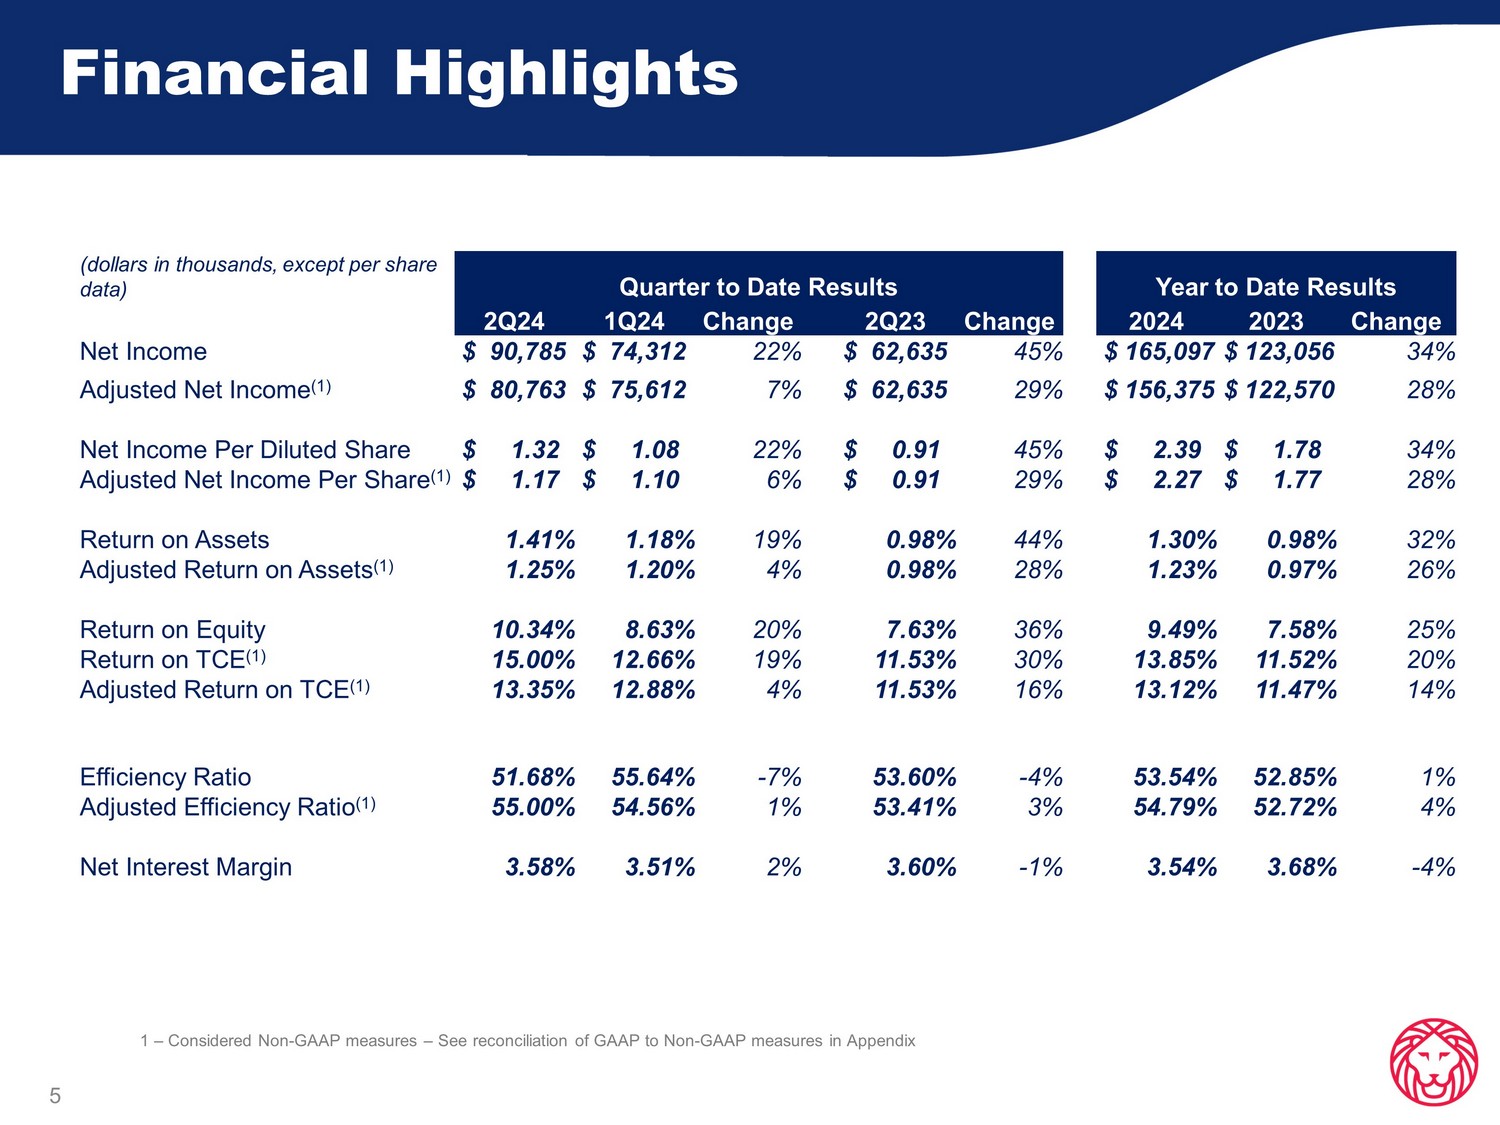
Financial Highlights 5 1 – Considered Non - GAAP measures – See reconciliation of GAAP to Non - GAAP measures in Appendix (dollars in thousands, except per share data) Quarter to Date Results Year to Date Results 2Q24 1Q24 Change 2Q23 Change 2024 2023 Change Net Income $ 90,785 $ 74,312 22% $ 62,635 45% $ 165,097 $ 123,056 34% Adjusted Net Income (1) $ 80,763 $ 75,612 7% $ 62,635 29% $ 156,375 $ 122,570 28% Net Income Per Diluted Share $ 1.32 $ 1.08 22% $ 0.91 45% $ 2.39 $ 1.78 34% Adjusted Net Income Per Share (1) $ 1.17 $ 1.10 6% $ 0.91 29% $ 2.27 $ 1.77 28% Return on Assets 1.41% 1.18% 19% 0.98% 44% 1.30% 0.98% 32% Adjusted Return on Assets (1) 1.25% 1.20% 4% 0.98% 28% 1.23% 0.97% 26% Return on Equity 10.34% 8.63% 20% 7.63% 36% 9.49% 7.58% 25% Return on TCE (1) 15.00% 12.66% 19% 11.53% 30% 13.85% 11.52% 20% Adjusted Return on TCE (1) 13.35% 12.88% 4% 11.53% 16% 13.12% 11.47% 14% Efficiency Ratio 51.68% 55.64% - 7% 53.60% - 4% 53.54% 52.85% 1% Adjusted Efficiency Ratio (1) 55.00% 54.56% 1% 53.41% 3% 54.79% 52.72% 4% Net Interest Margin 3.58% 3.51% 2% 3.60% - 1% 3.54% 3.68% - 4%
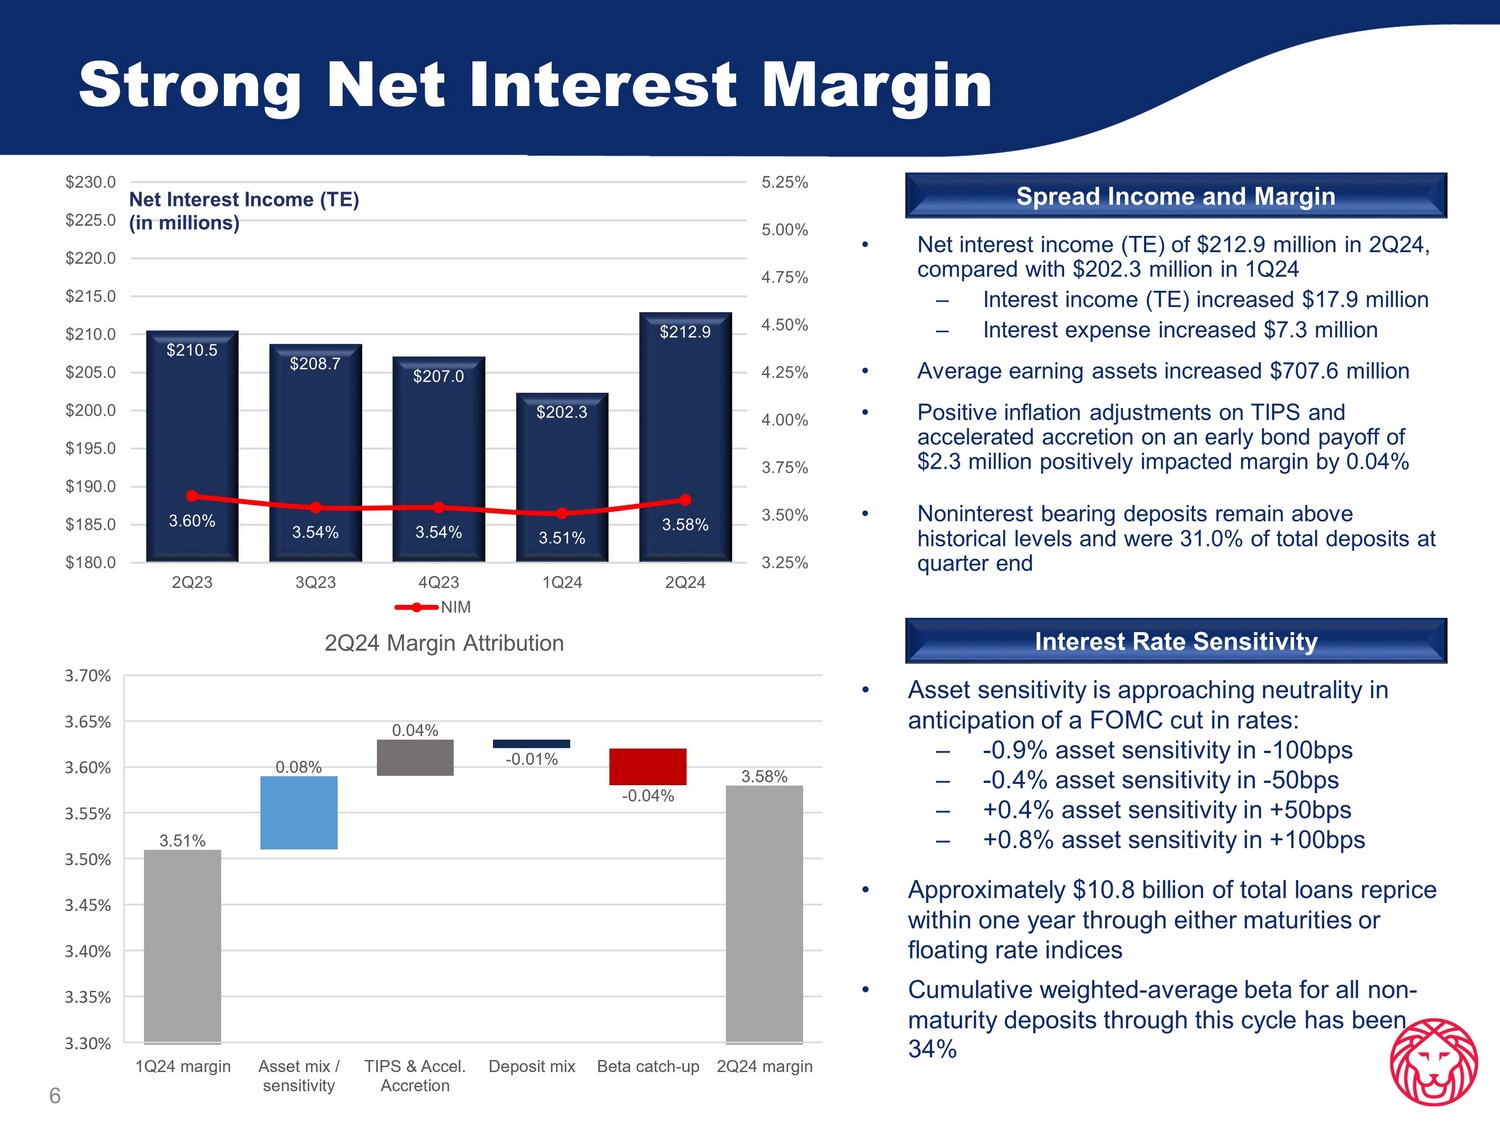
Strong Net Interest Margin 6 • Net interest income (TE) of $212.9 million in 2Q24, compared with $202.3 million in 1Q24 – Interest income (TE) increased $17.9 million – Interest expense increased $7.3 million • Average earning assets increased $707.6 million • Positive inflation adjustments on TIPS and accelerated accretion on an early bond payoff of $2.3 million positively impacted margin by 0.04% • Noninterest bearing deposits remain above historical levels and were 31.0% of total deposits at quarter end Spread Income and Margin Interest Rate Sensitivity • Asset sensitivity is approaching neutrality in anticipation of a FOMC cut in rates: – - 0.9% asset sensitivity in - 100bps – - 0.4% asset sensitivity in - 50bps – +0.4% asset sensitivity in +50bps – +0.8% asset sensitivity in +100bps • Approximately $10.8 billion of total loans reprice within one year through either maturities or floating rate indices • Cumulative weighted - average beta for all non - maturity deposits through this cycle has been 34% $210.5 $208.7 $207.0 $202.3 $212.9 3.60% 3.54% 3.54% 3.51% 3.58% 3.25% 3.50% 3.75% 4.00% 4.25% 4.50% 4.75% 5.00% 5.25% $180.0 $185.0 $190.0 $195.0 $200.0 $205.0 $210.0 $215.0 $220.0 $225.0 $230.0 2Q23 3Q23 4Q23 1Q24 2Q24 Net Interest Income (TE) (in millions) NIM
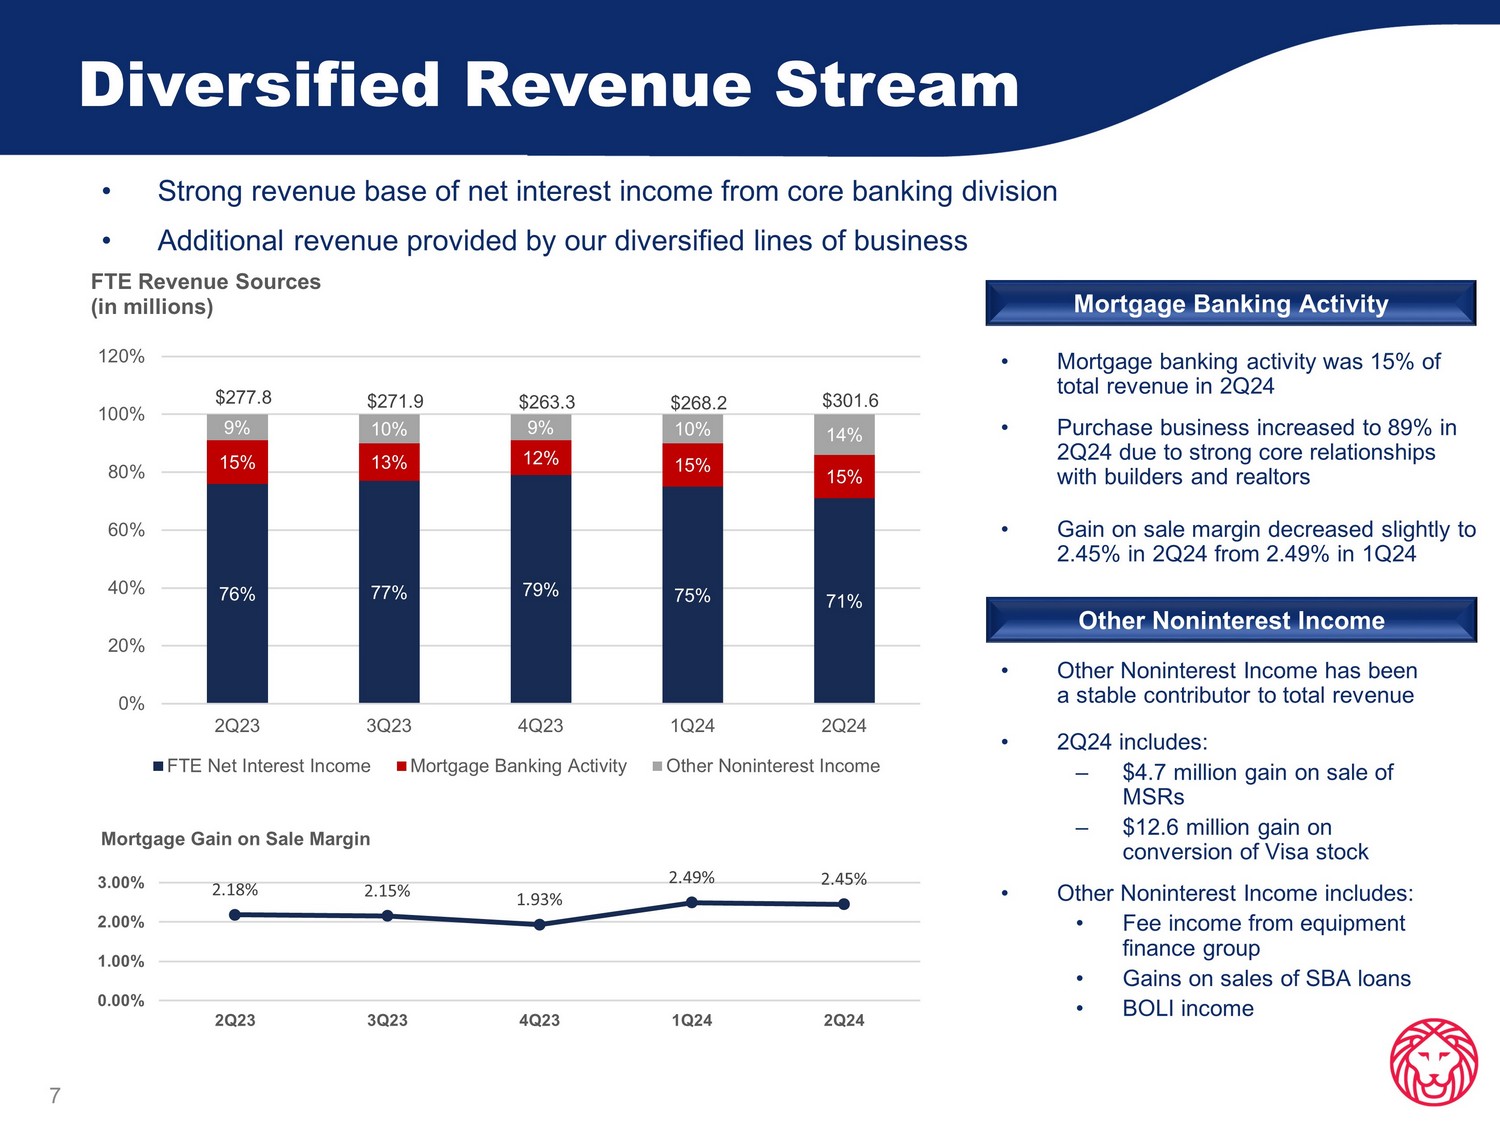
Diversified Revenue Stream 7 • Strong revenue base of net interest income from core banking division • Additional revenue provided by our diversified lines of business Mortgage Banking Activity • Mortgage banking activity was 15% of total revenue in 2Q24 • Purchase business increased to 89% in 2Q24 due to strong core relationships with builders and realtors • Gain on sale margin decreased slightly to 2.45% in 2Q24 from 2.49% in 1Q24 Other Noninterest Income • Other Noninterest Income has been a stable contributor to total revenue • 2Q24 includes: – $4.7 million gain on sale of MSRs – $12.6 million gain on conversion of Visa stock • Other Noninterest Income includes: • Fee income from equipment finance group • Gains on sales of SBA loans • BOLI income 76% 77% 79% 75% 71% 15% 13% 12% 15% 15% 9% 10% 9% 10% 14% $277.8 $271.9 $263.3 $268.2 $301.6 0% 20% 40% 60% 80% 100% 120% 2Q23 3Q23 4Q23 1Q24 2Q24 FTE Revenue Sources (in millions) FTE Net Interest Income Mortgage Banking Activity Other Noninterest Income 2.18% 2.15% 1.93% 2.49% 2.45% 0.00% 1.00% 2.00% 3.00% 2Q23 3Q23 4Q23 1Q24 2Q24 Mortgage Gain on Sale Margin
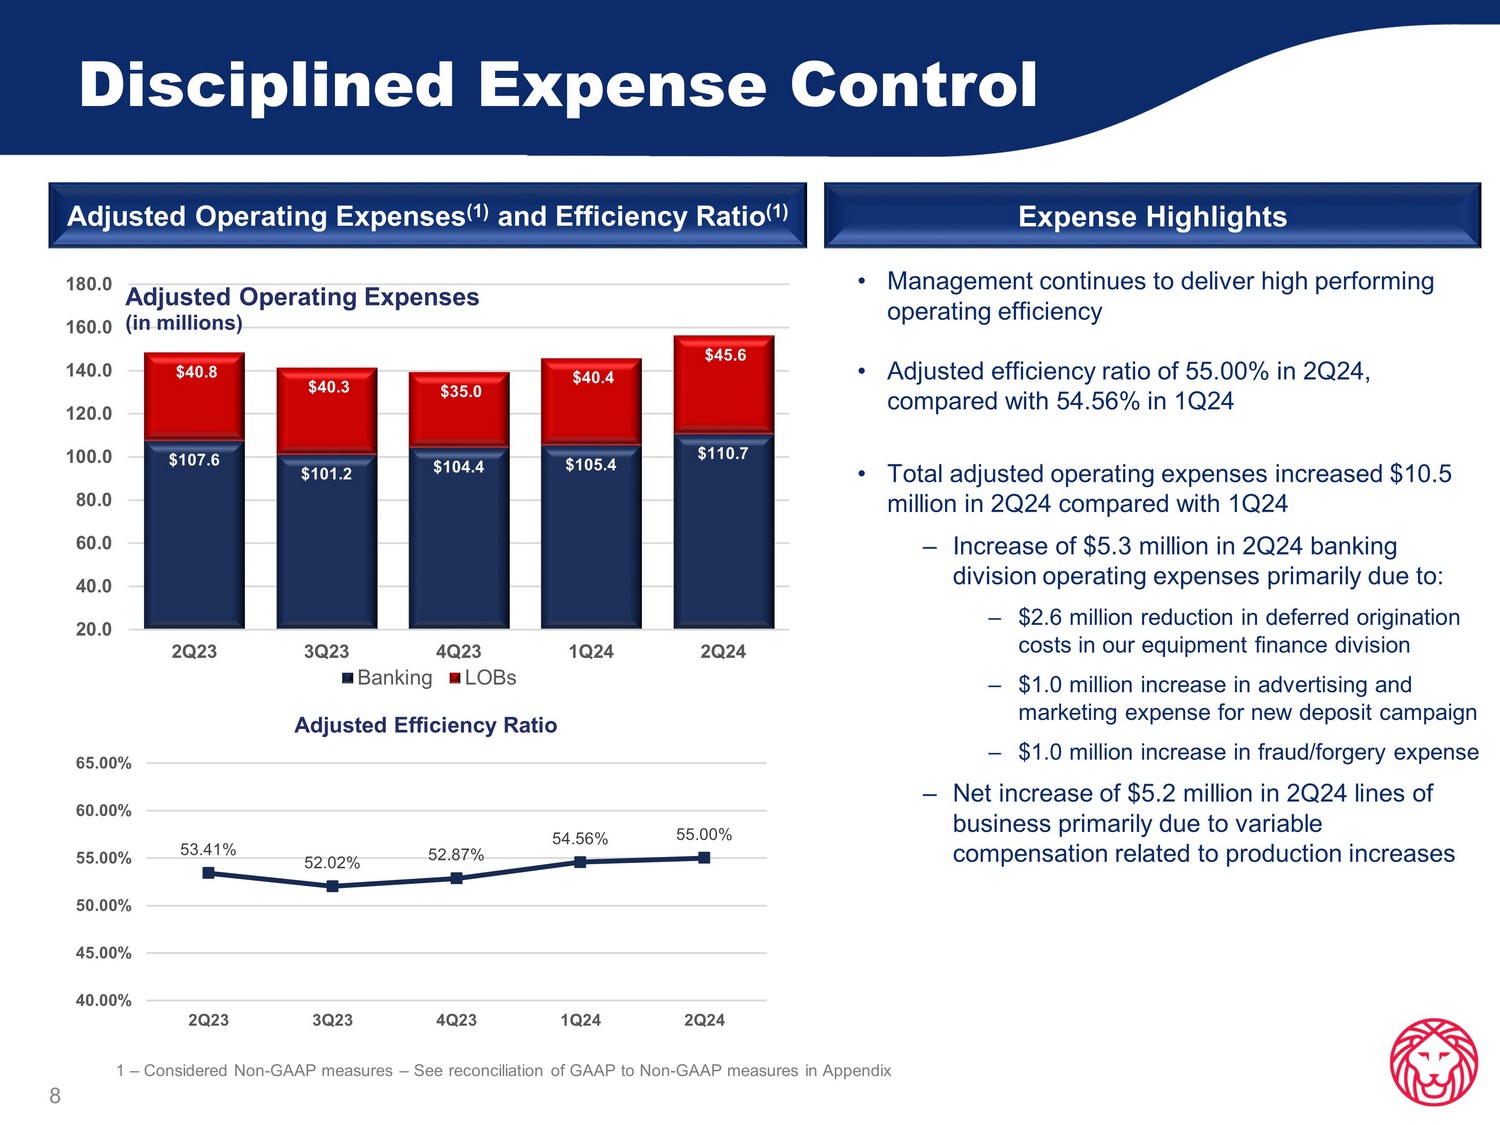
Disciplined Expense Control Adjusted Operating Expenses (1) and Efficiency Ratio (1) Expense Highlights 8 • Management continues to deliver high performing operating efficiency • Adjusted efficiency ratio of 55.00% in 2Q24, compared with 54.56% in 1Q24 • Total adjusted operating expenses increased $10.5 million in 2Q24 compared with 1Q24 ‒ Increase of $5.3 million in 2Q24 banking division operating expenses primarily due to: ‒ $2.6 million reduction in deferred origination costs in our equipment finance division ‒ $1.0 million increase in advertising and marketing expense for new deposit campaign ‒ $1.0 million increase in fraud/forgery expense – Net increase of $5.2 million in 2Q24 lines of business primarily due to variable compensation related to production increases 1 – Considered Non - GAAP measures – See reconciliation of GAAP to Non - GAAP measures in Appendix $107.6 $101.2 $104.4 $105.4 $110.7 $40.8 $40.3 $35.0 $40.4 $45.6 20.0 40.0 60.0 80.0 100.0 120.0 140.0 160.0 180.0 2Q23 3Q23 4Q23 1Q24 2Q24 Adjusted Operating Expenses (in millions) Banking LOBs 53.41% 52.02% 52.87% 54.56% 55.00% 40.00% 45.00% 50.00% 55.00% 60.00% 65.00% 2Q23 3Q23 4Q23 1Q24 2Q24 Adjusted Efficiency Ratio
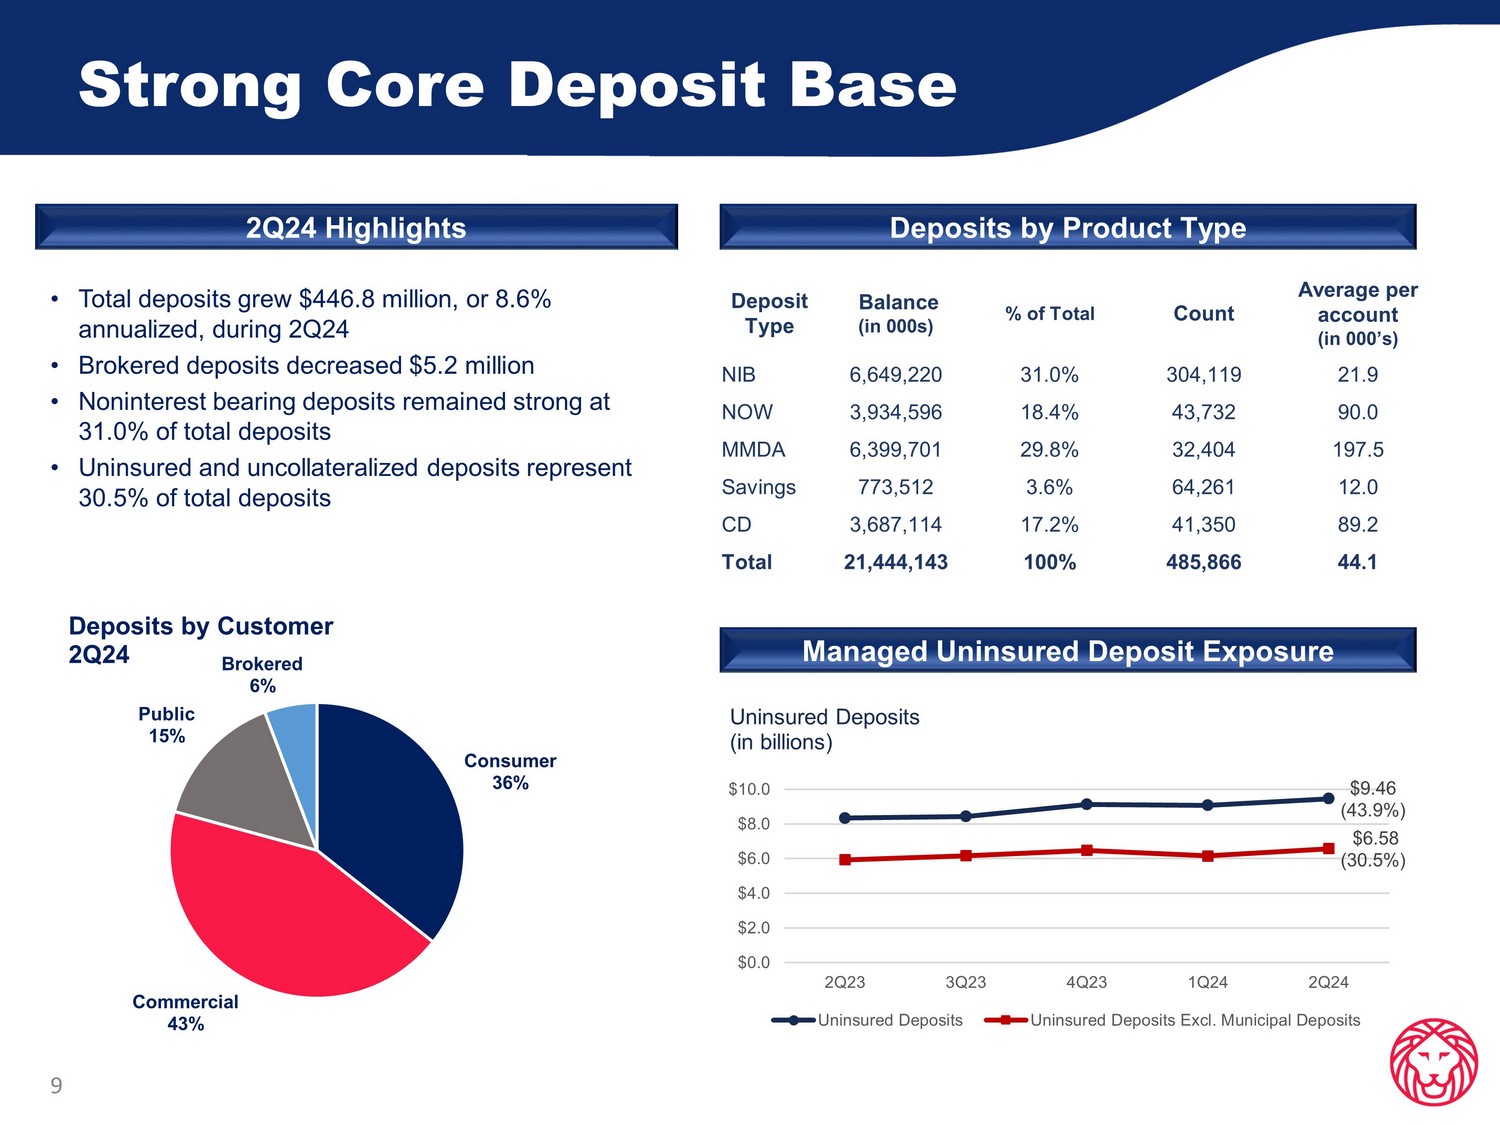
Strong Core Deposit Base 9 Deposits by Product Type Deposit Type Balance (in 000s) % of Total Count Average per account (in 000’s) NIB 6,649,220 31.0% 304,119 21.9 NOW 3,934,596 18.4% 43,732 90.0 MMDA 6,399,701 29.8% 32,404 197.5 Savings 773,512 3.6% 64,261 12.0 CD 3,687,114 17.2% 41,350 89.2 Total 21,444,143 100% 485,866 44.1 Managed Uninsured Deposit Exposure • Total deposits grew $446.8 million, or 8.6% annualized, during 2Q24 • Brokered deposits decreased $5.2 million • Noninterest bearing deposits remained strong at 31.0% of total deposits • Uninsured and uncollateralized deposits represent 30.5% of total deposits 2Q24 Highlights Consumer 36% Commercial 43% Public 15% Brokered 6% Deposits by Customer 2Q24 $9.46 (43.9%) $6.58 (30.5%) $0.0 $2.0 $4.0 $6.0 $8.0 $10.0 2Q23 3Q23 4Q23 1Q24 2Q24 Uninsured Deposits (in billions) Uninsured Deposits Uninsured Deposits Excl. Municipal Deposits
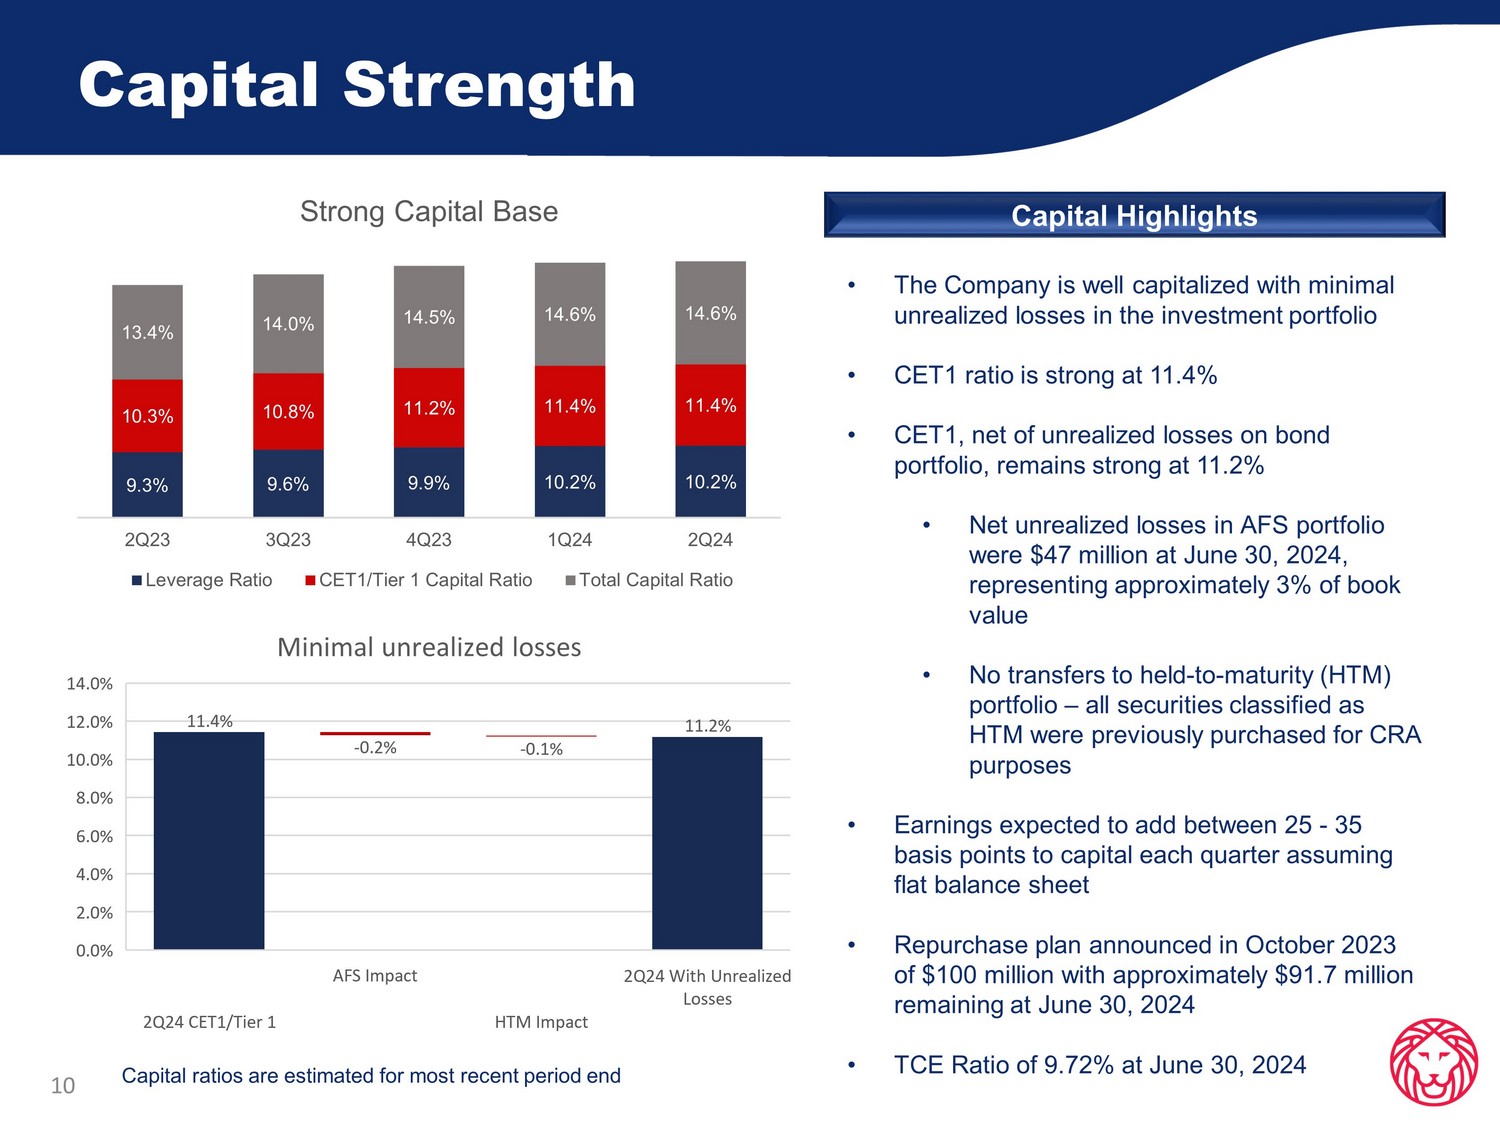
Capital Strength 10 Capital Highlights • The Company is well capitalized with minimal unrealized losses in the investment portfolio • CET1 ratio is strong at 11.4% • CET1, net of unrealized losses on bond portfolio, remains strong at 11.2% • Net unrealized losses in AFS portfolio were $47 million at June 30, 2024, representing approximately 3% of book value • No transfers to held - to - maturity (HTM) portfolio – all securities classified as HTM were previously purchased for CRA purposes • Earnings expected to add between 25 - 35 basis points to capital each quarter assuming flat balance sheet • Repurchase plan announced in October 2023 of $100 million with approximately $91.7 million remaining at June 30, 2024 • TCE Ratio of 9.72% at June 30, 2024 Capital ratios are estimated for most recent period end 9.3% 9.6% 9.9% 10.2% 10.2% 10.3% 10.8% 11.2% 11.4% 11.4% 13.4% 14.0% 14.5% 14.6% 14.6% 2Q23 3Q23 4Q23 1Q24 2Q24 Strong Capital Base Leverage Ratio CET1/Tier 1 Capital Ratio Total Capital Ratio
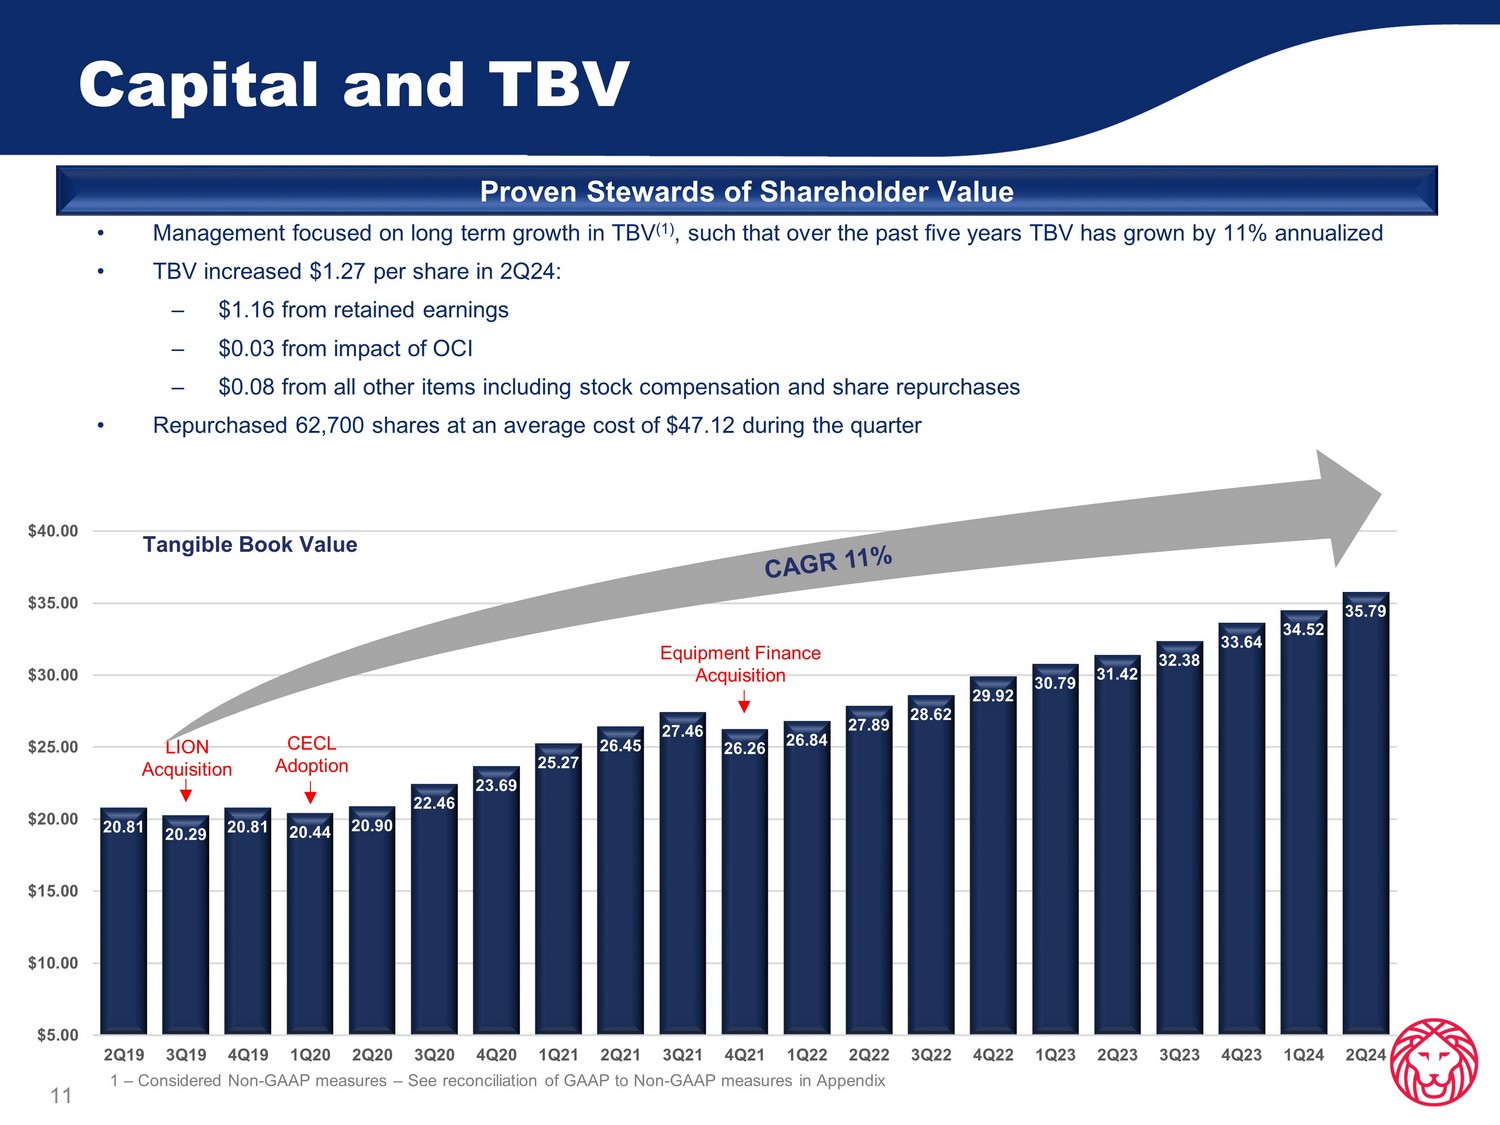
20.81 20.29 20.81 20.44 20.90 22.46 23.69 25.27 26.45 27.46 26.26 26.84 27.89 28.62 29.92 30.79 31.42 32.38 33.64 34.52 35.79 $5.00 $10.00 $15.00 $20.00 $25.00 $30.00 $35.00 $40.00 2Q19 3Q19 4Q19 1Q20 2Q20 3Q20 4Q20 1Q21 2Q21 3Q21 4Q21 1Q22 2Q22 3Q22 4Q22 1Q23 2Q23 3Q23 4Q23 1Q24 2Q24 Tangible Book Value Capital and TBV Proven Stewards of Shareholder Value 11 • Management focused on long term growth in TBV (1) , such that over the past five years TBV has grown by 11% annualized • TBV increased $1.27 per share in 2Q24: – $1.16 from retained earnings – $0.03 from impact of OCI – $0.08 from all other items including stock compensation and share repurchases • Repurchased 62,700 shares at an average cost of $47.12 during the quarter 1 – Considered Non - GAAP measures – See reconciliation of GAAP to Non - GAAP measures in Appendix Equipment Finance Acquisition LION Acquisition CECL Adoption

Loan Diversification and Credit Quality
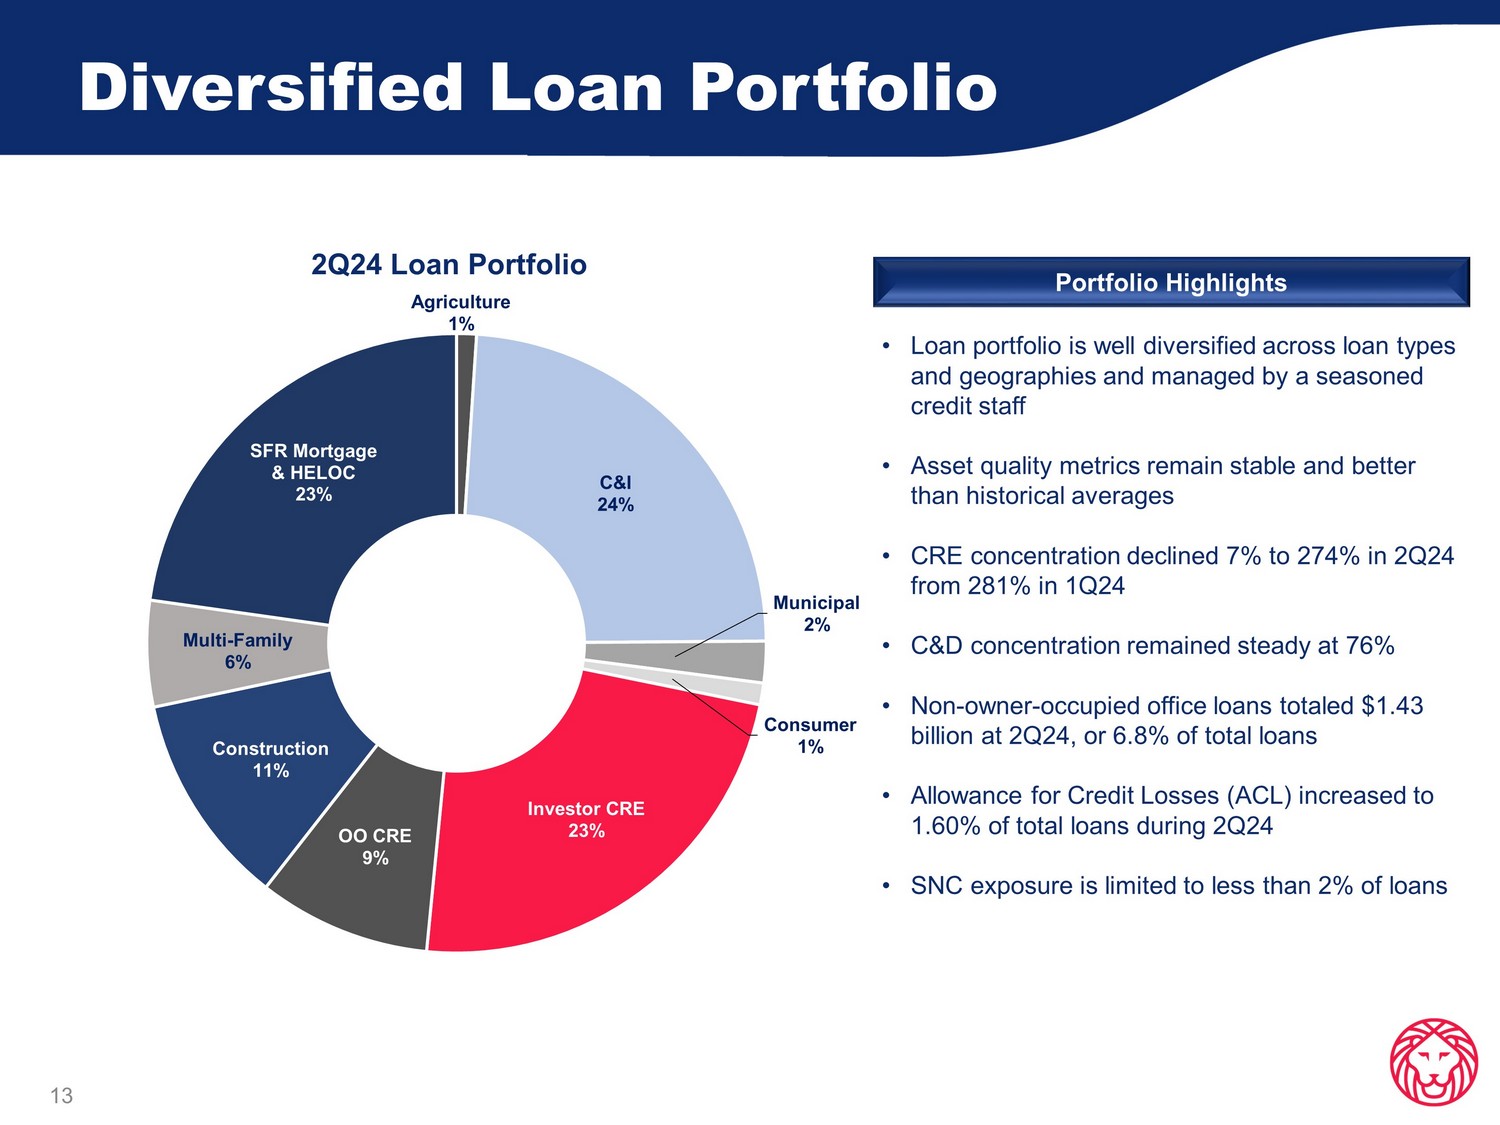
Diversified Loan Portfolio 2Q24 Loan Portfolio 13 • Loan portfolio is well diversified across loan types and geographies and managed by a seasoned credit staff • Asset quality metrics remain stable and better than historical averages • CRE concentration declined 7 % to 274% in 2Q24 from 281% in 1Q24 • C&D concentration remained steady at 76% • Non - owner - occupied office loans totaled $1.43 billion at 2Q24, or 6.8% of total loans • Allowance for Credit Losses (ACL) increased to 1.60% of total loans during 2Q24 • SNC exposure is limited to less than 2% of loans Portfolio Highlights Agriculture 1% C&I 24% Municipal 2% Consumer 1% Investor CRE 23% OO CRE 9% Construction 11% Multi - Family 6% SFR Mortgage & HELOC 23%
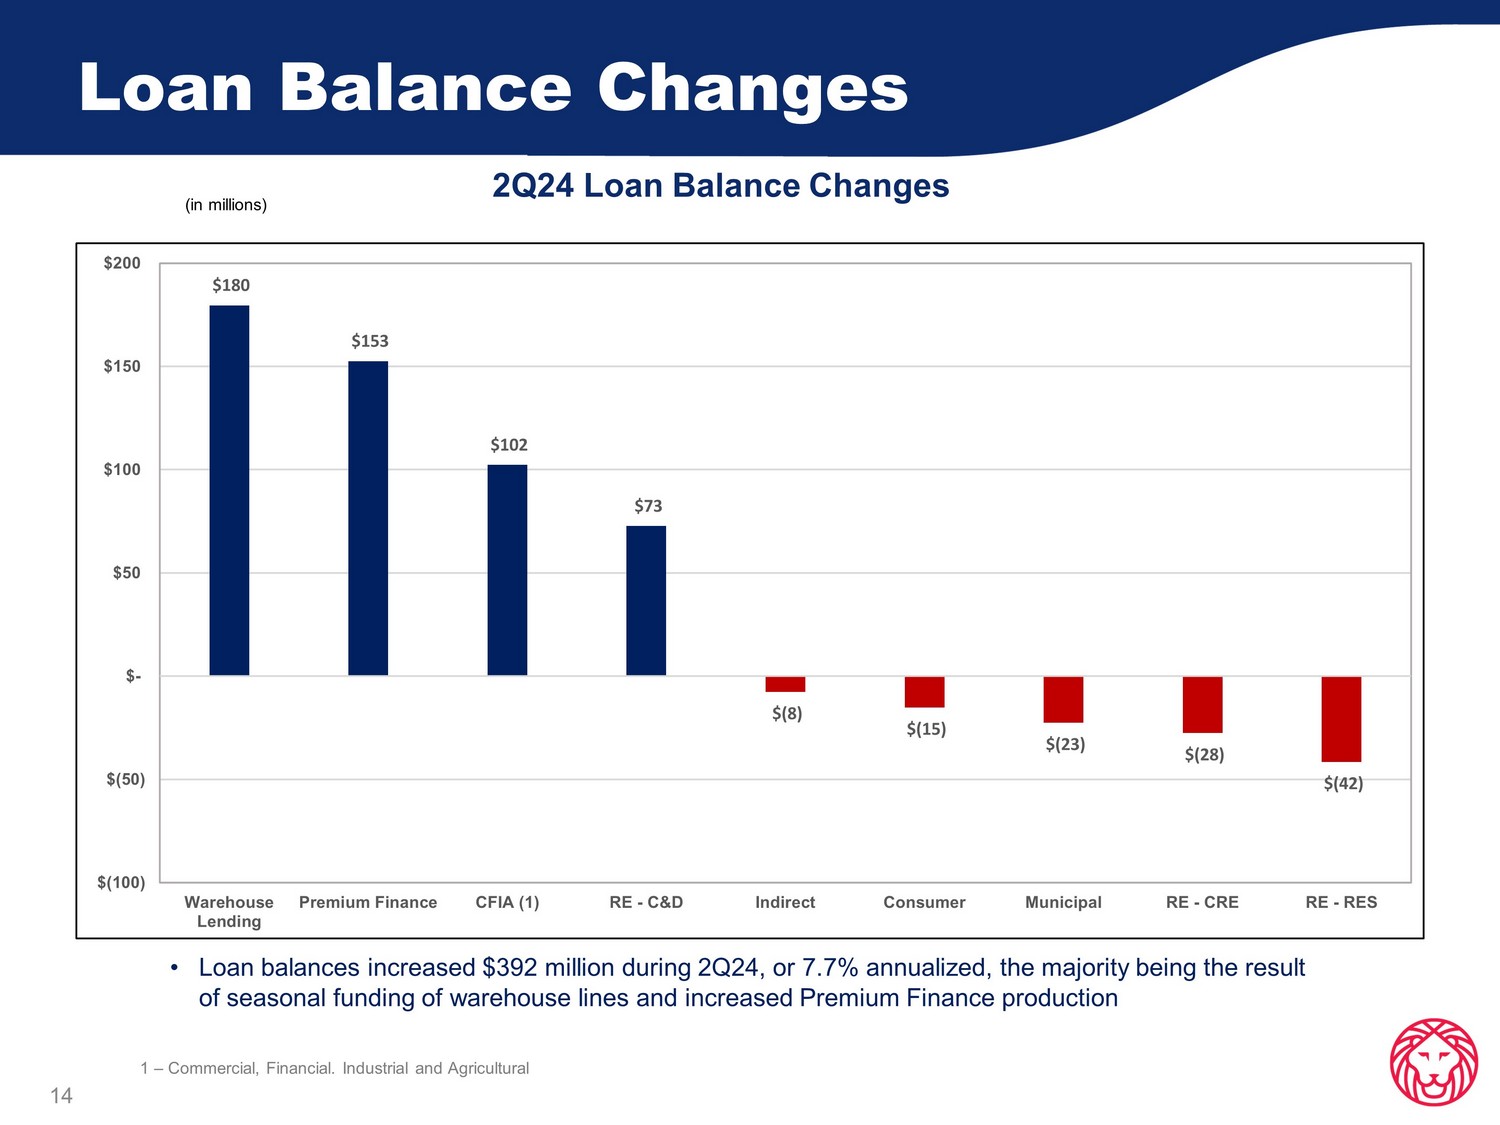
Loan Balance Changes 2Q24 Loan Balance Changes 14 • Loan balances increased $392 million during 2Q24, or 7.7% annualized, the majority being the result of seasonal funding of warehouse lines and increased Premium Finance production (in millions) $180 $153 $102 $73 $(8) $(15) $(23) $(28) $(42) $(100) $(50) $- $50 $100 $150 $200 Warehouse Lending Premium Finance CFIA (1) RE - C&D Indirect Consumer Municipal RE - CRE RE - RES 1 – Commercial, Financial. Industrial and Agricultural
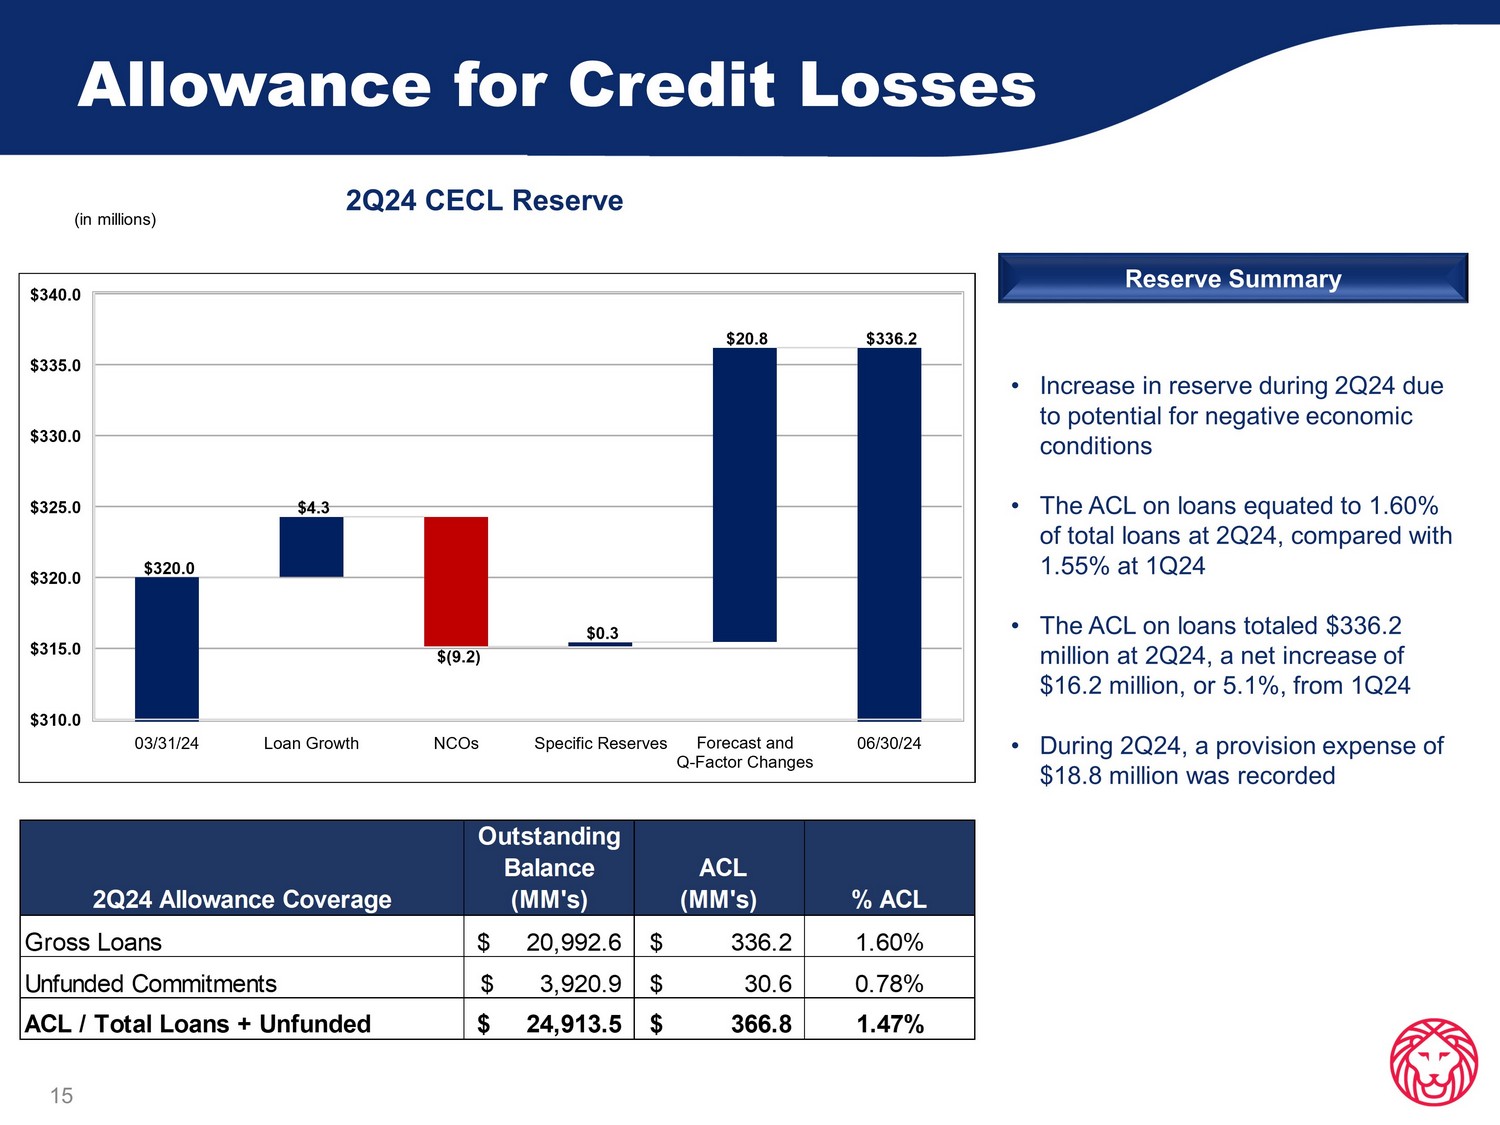
Allowance for Credit Losses 15 • Increase in reserve during 2Q24 due to potential for negative economic conditions • The ACL on loans equated to 1.60% of total loans at 2Q24, compared with 1.55% at 1Q24 • The ACL on loans totaled $336.2 million at 2Q24, a net increase of $ 16.2 mil lion, or 5.1 %, from 1Q24 • During 2Q24, a provision expense of $18.8 million was recorded 2Q24 CECL Reserve Reserve Summary (in millions) 2Q24 Allowance Coverage Outstanding Balance (MM's) ACL (MM's) % ACL Gross Loans 20,992.6$ 336.2$ 1.60% Unfunded Commitments 3,920.9$ 30.6$ 0.78% ACL / Total Loans + Unfunded 24,913.5$ 366.8$ 1.47%
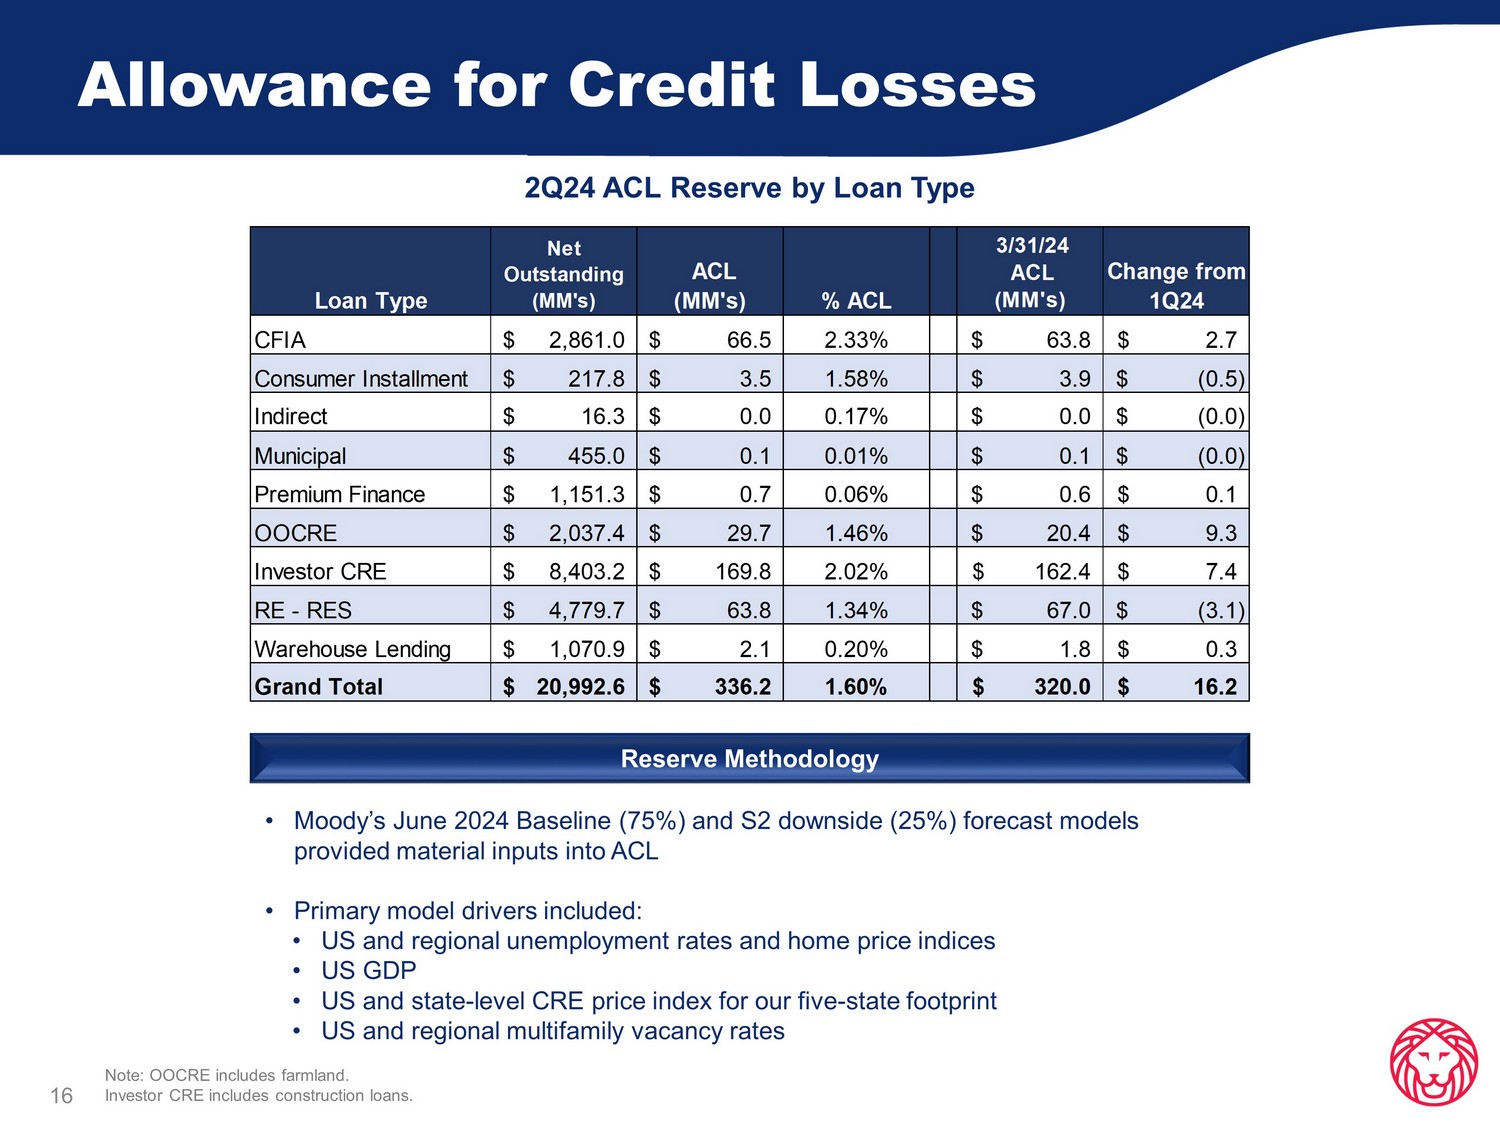
Allowance for Credit Losses 16 2 Q24 A CL Reserve by Loan Type Reserve Methodology • Moody’s June 2024 Baseline (75%) and S2 downside (25%) forecast models provided material inputs into ACL • Primary model drivers included: • US and regional unemployment rates and home price indices • US GDP • US and state - level CRE price index for our five - state footprint • US and regional multifamily vacancy rates Note: OOCRE includes farmland . Investor CRE includes construction loans. Loan Type Net Outstanding (MM's) ACL (MM's) % ACL 3/31/24 ACL (MM's) Change from 1Q24 CFIA 2,861.0$ 66.5$ 2.33% 63.8$ 2.7$ Consumer Installment 217.8$ 3.5$ 1.58% 3.9$ (0.5)$ Indirect 16.3$ 0.0$ 0.17% 0.0$ (0.0)$ Municipal 455.0$ 0.1$ 0.01% 0.1$ (0.0)$ Premium Finance 1,151.3$ 0.7$ 0.06% 0.6$ 0.1$ OOCRE 2,037.4$ 29.7$ 1.46% 20.4$ 9.3$ Investor CRE 8,403.2$ 169.8$ 2.02% 162.4$ 7.4$ RE - RES 4,779.7$ 63.8$ 1.34% 67.0$ (3.1)$ Warehouse Lending 1,070.9$ 2.1$ 0.20% 1.8$ 0.3$ Grand Total 20,992.6$ 336.2$ 1.60% 320.0$ 16.2$
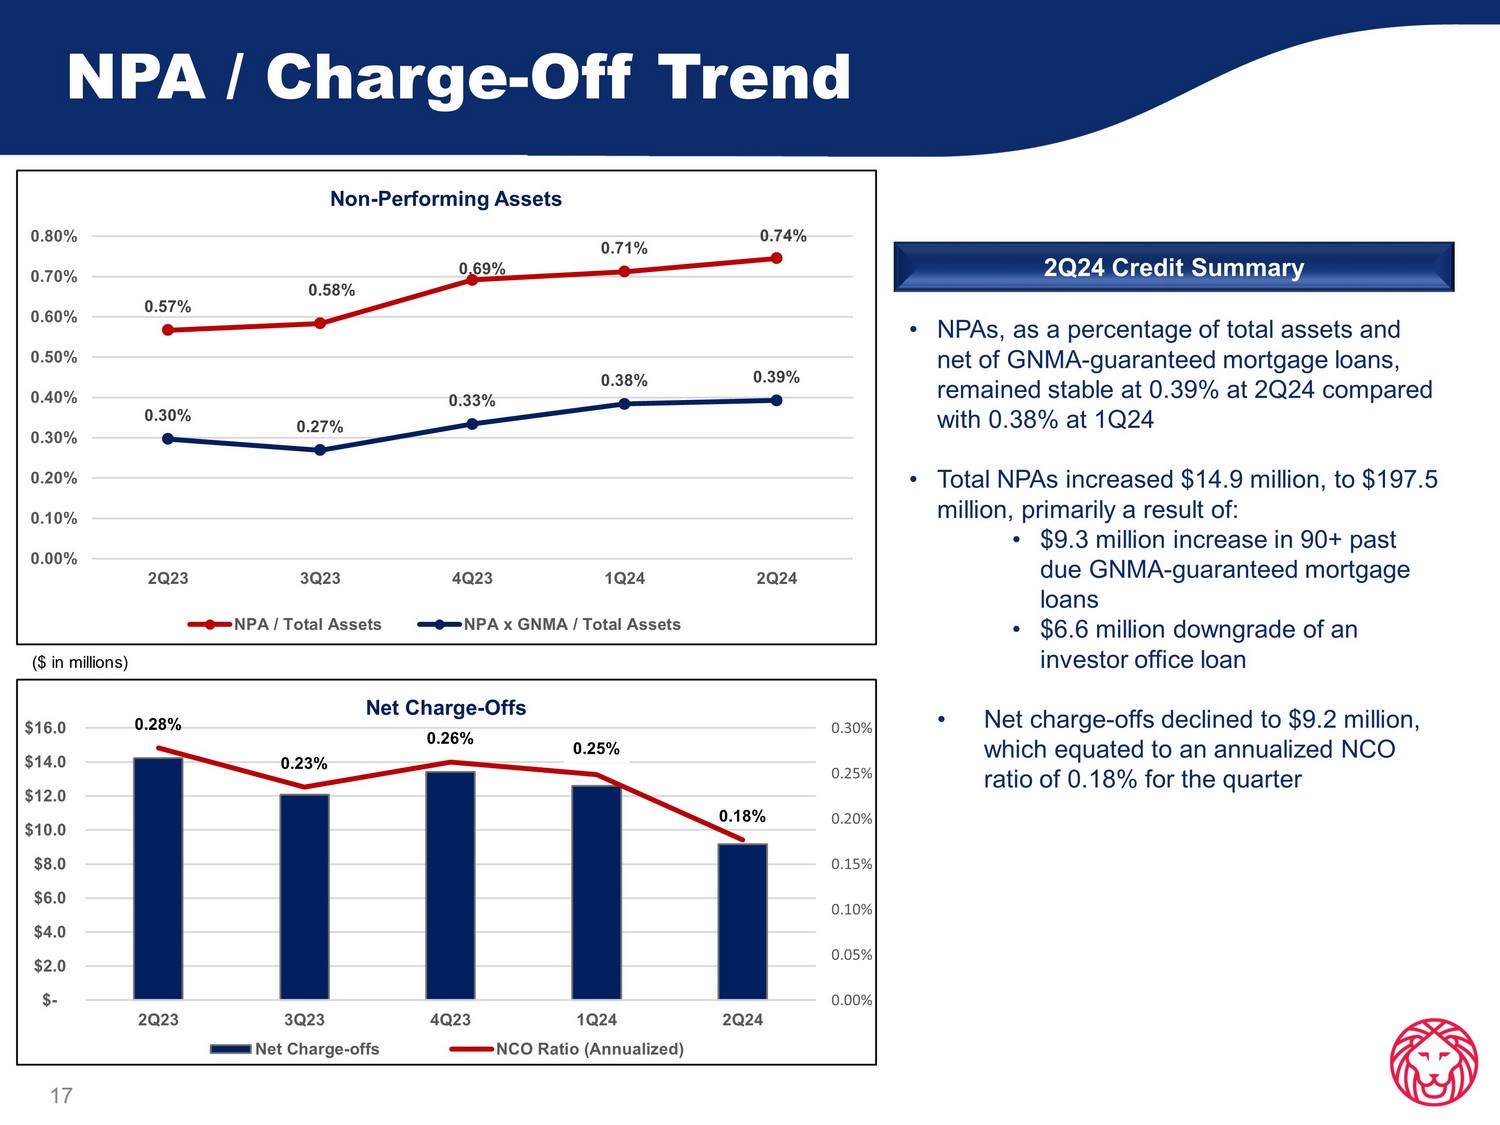
NPA / Charge - Off Trend 17 • NPAs, as a percentage of total assets and net of GNMA - guaranteed mortgage loans, remained stable at 0.39% at 2Q24 compared with 0.38% at 1Q24 • Total NPAs in creased $14.9 million, to $197.5 million, primarily a result of: • $9.3 million increase in 90+ past due GNMA - guaranteed mortgage loans • $6.6 million downgrade of an investor office loan • Net charge - offs declined to $9.2 million, which equated to an annualized NCO ratio of 0.18% for the quarter 2Q24 Credit Summary ($ in millions) 0.57% 0.58% 0.69% 0.71% 0.74% 0.30% 0.27% 0.33% 0.38% 0.39% 0.00% 0.10% 0.20% 0.30% 0.40% 0.50% 0.60% 0.70% 0.80% 2Q23 3Q23 4Q23 1Q24 2Q24 Non - Performing Assets NPA / Total Assets NPA x GNMA / Total Assets 0.28% 0.23% 0.26% 0.25% 0.18% 0.00% 0.05% 0.10% 0.15% 0.20% 0.25% 0.30% $- $2.0 $4.0 $6.0 $8.0 $10.0 $12.0 $14.0 $16.0 2Q23 3Q23 4Q23 1Q24 2Q24 Net Charge - Offs Net Charge-offs NCO Ratio (Annualized)
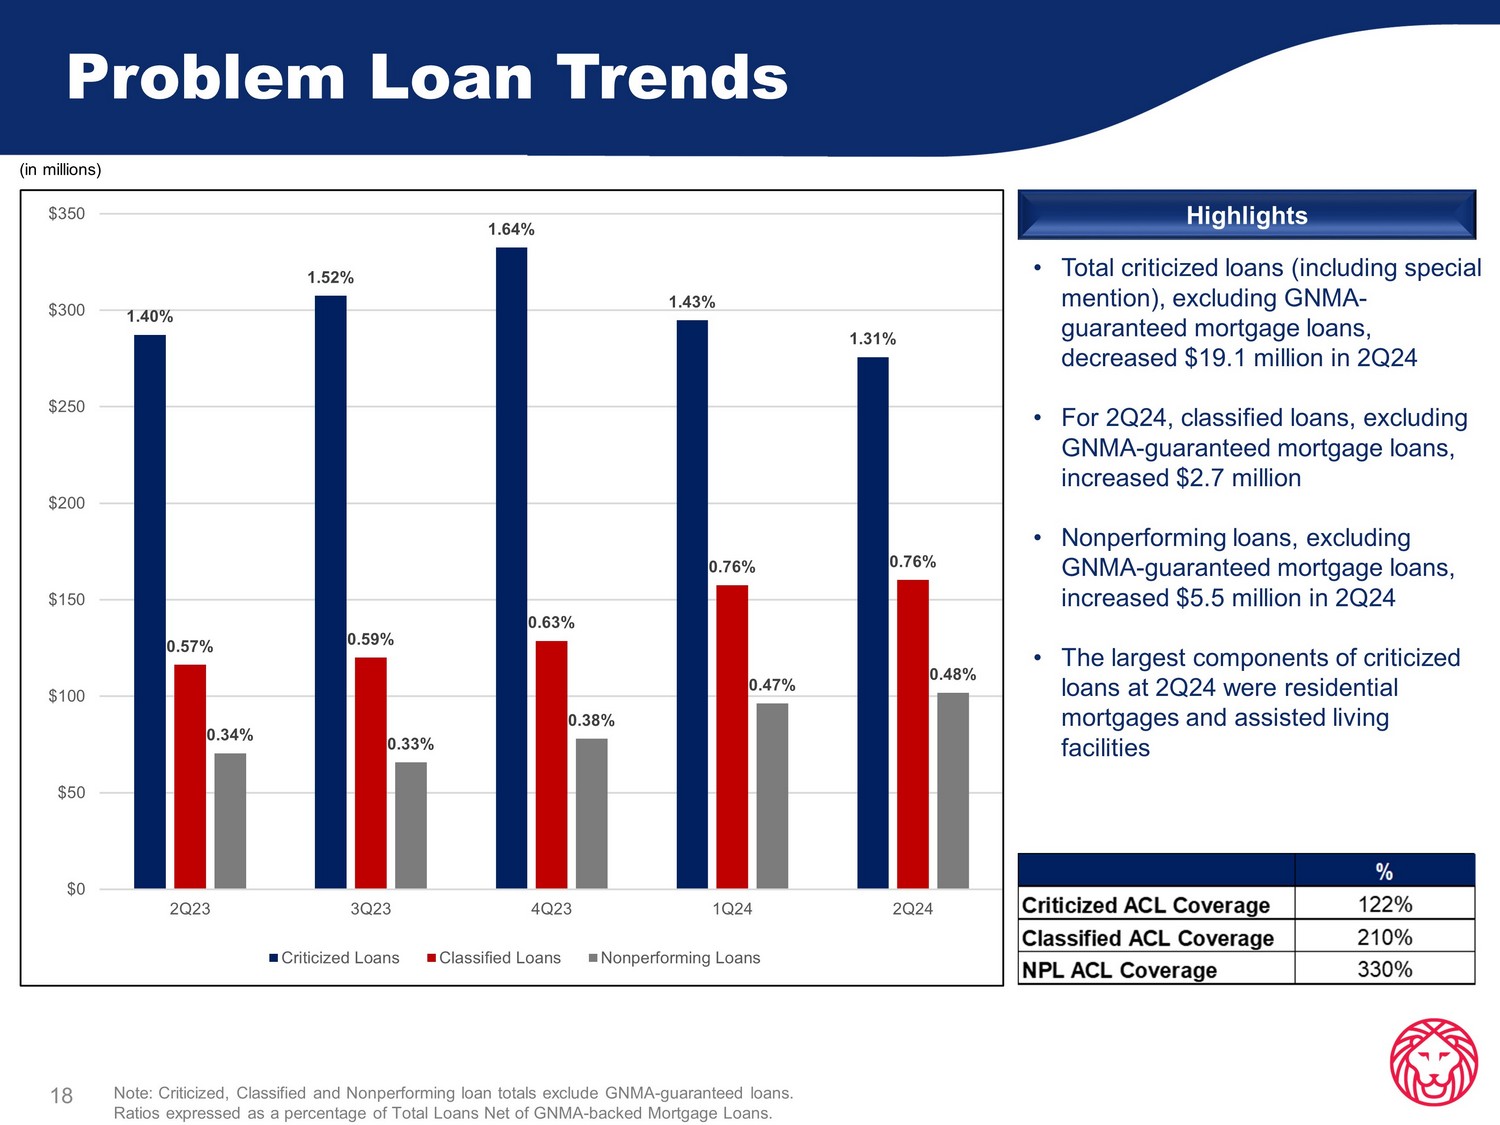
Problem Loan Trends 18 • Total criticized loans (including special mention ), excluding GNMA - guaranteed mortgage loans, de creased $19.1 million in 2Q24 • For 2Q24, classified loans, excluding GNMA - guaranteed mortgage loans, in creased $2.7 million • Nonperforming loans, excluding GNMA - guaranteed mortgage loans, increased $5.5 million in 2Q24 • The largest components of criticized loans at 2Q24 were residential mortgages and assisted living facilities Highlights (in millions) Note: Criticized, Classified and Nonperforming loan totals exclude GNMA - guaranteed loans. Ratios expressed as a percentage of Total Loans Net of GNMA - backed Mortgage Loans. 1.40% 1.52% 1.64% 1.43% 1.31% 0.57% 0.59% 0.63% 0.76% 0.76% 0.34% 0.33% 0.38% 0.47% 0.48% $0 $50 $100 $150 $200 $250 $300 $350 2Q23 3Q23 4Q23 1Q24 2Q24 Criticized Loans Classified Loans Nonperforming Loans
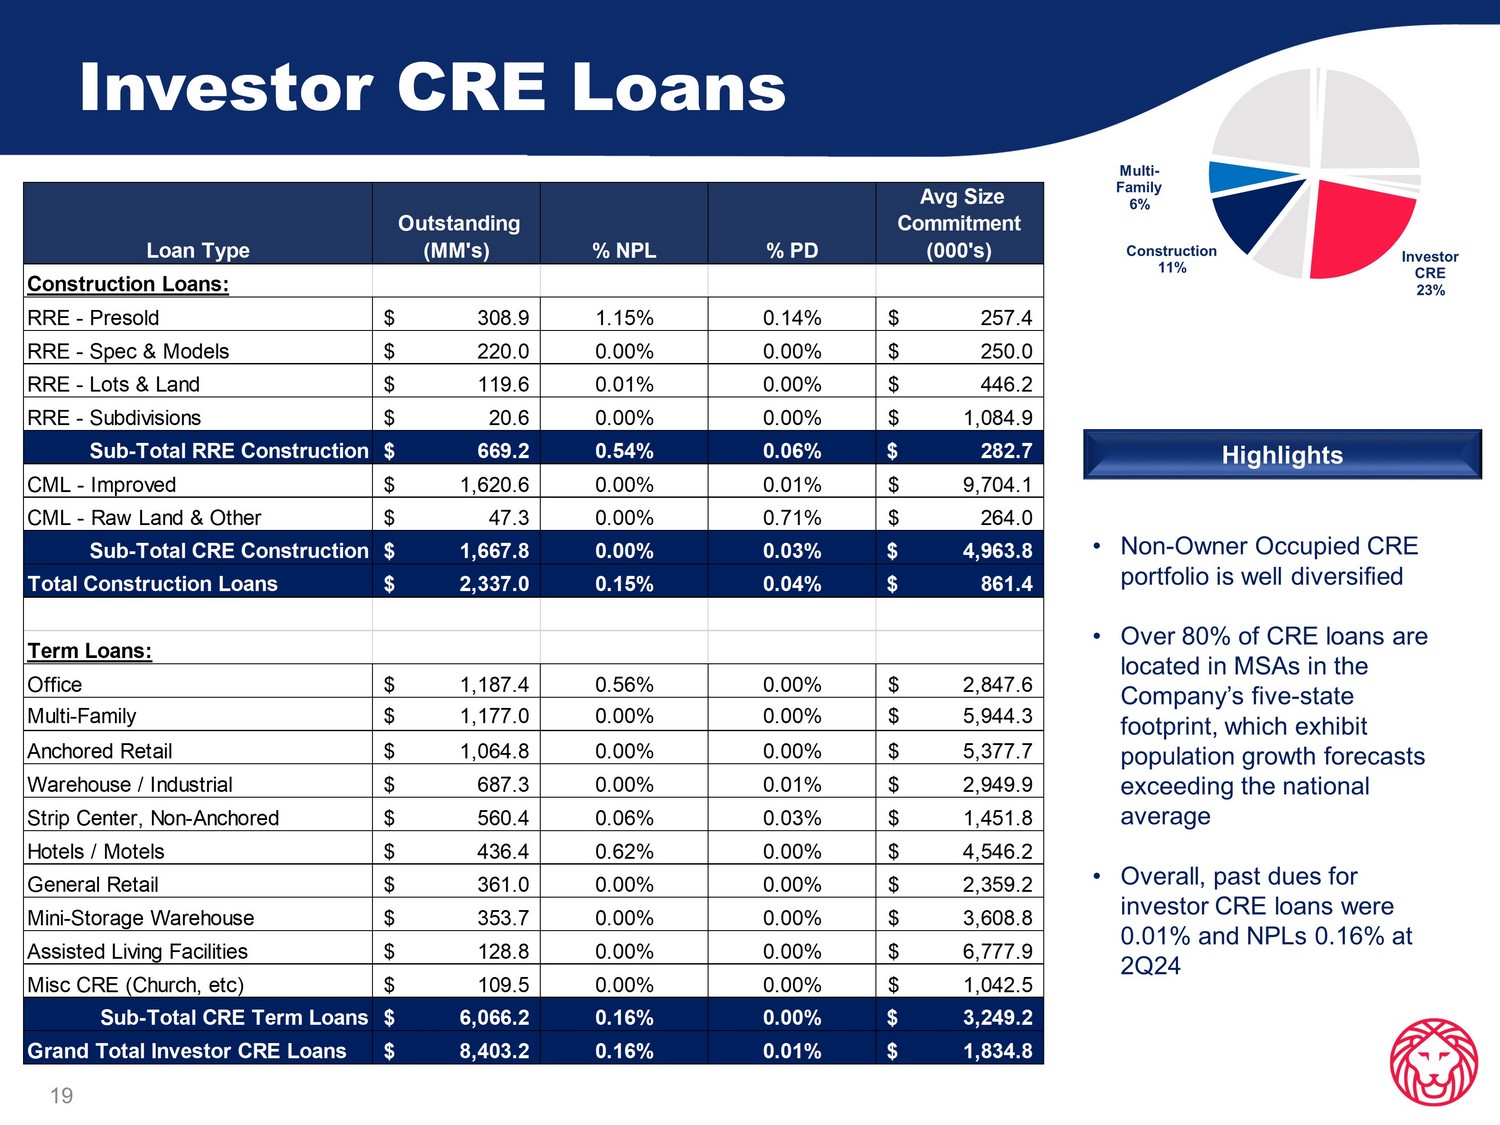
Investor CRE Loans 19 • Non - Owner Occupied CRE portfolio is well diversified • Over 80% of CRE loans are located in MSAs in the Company’s five - state footprint, which exhibit population growth forecasts exceeding the national average • Overall, past dues for investor CRE loans were 0.01% and NPLs 0.16% at 2Q24 Investor CRE 23% Construction 11% Multi - Family 6% Highlights Loan Type Outstanding (MM's) % NPL % PD Avg Size Commitment (000's) Construction Loans: RRE - Presold 308.9$ 1.15% 0.14% 257.4$ RRE - Spec & Models 220.0$ 0.00% 0.00% 250.0$ RRE - Lots & Land 119.6$ 0.01% 0.00% 446.2$ RRE - Subdivisions 20.6$ 0.00% 0.00% 1,084.9$ Sub-Total RRE Construction 669.2$ 0.54% 0.06% 282.7$ CML - Improved 1,620.6$ 0.00% 0.01% 9,704.1$ CML - Raw Land & Other 47.3$ 0.00% 0.71% 264.0$ Sub-Total CRE Construction 1,667.8$ 0.00% 0.03% 4,963.8$ Total Construction Loans 2,337.0$ 0.15% 0.04% 861.4$ Term Loans: Office 1,187.4$ 0.56% 0.00% 2,847.6$ Multi-Family 1,177.0$ 0.00% 0.00% 5,944.3$ Anchored Retail 1,064.8$ 0.00% 0.00% 5,377.7$ Warehouse / Industrial 687.3$ 0.00% 0.01% 2,949.9$ Strip Center, Non-Anchored 560.4$ 0.06% 0.03% 1,451.8$ Hotels / Motels 436.4$ 0.62% 0.00% 4,546.2$ General Retail 361.0$ 0.00% 0.00% 2,359.2$ Mini-Storage Warehouse 353.7$ 0.00% 0.00% 3,608.8$ Assisted Living Facilities 128.8$ 0.00% 0.00% 6,777.9$ Misc CRE (Church, etc) 109.5$ 0.00% 0.00% 1,042.5$ Sub-Total CRE Term Loans 6,066.2$ 0.16% 0.00% 3,249.2$ Grand Total Investor CRE Loans 8,403.2$ 0.16% 0.01% 1,834.8$
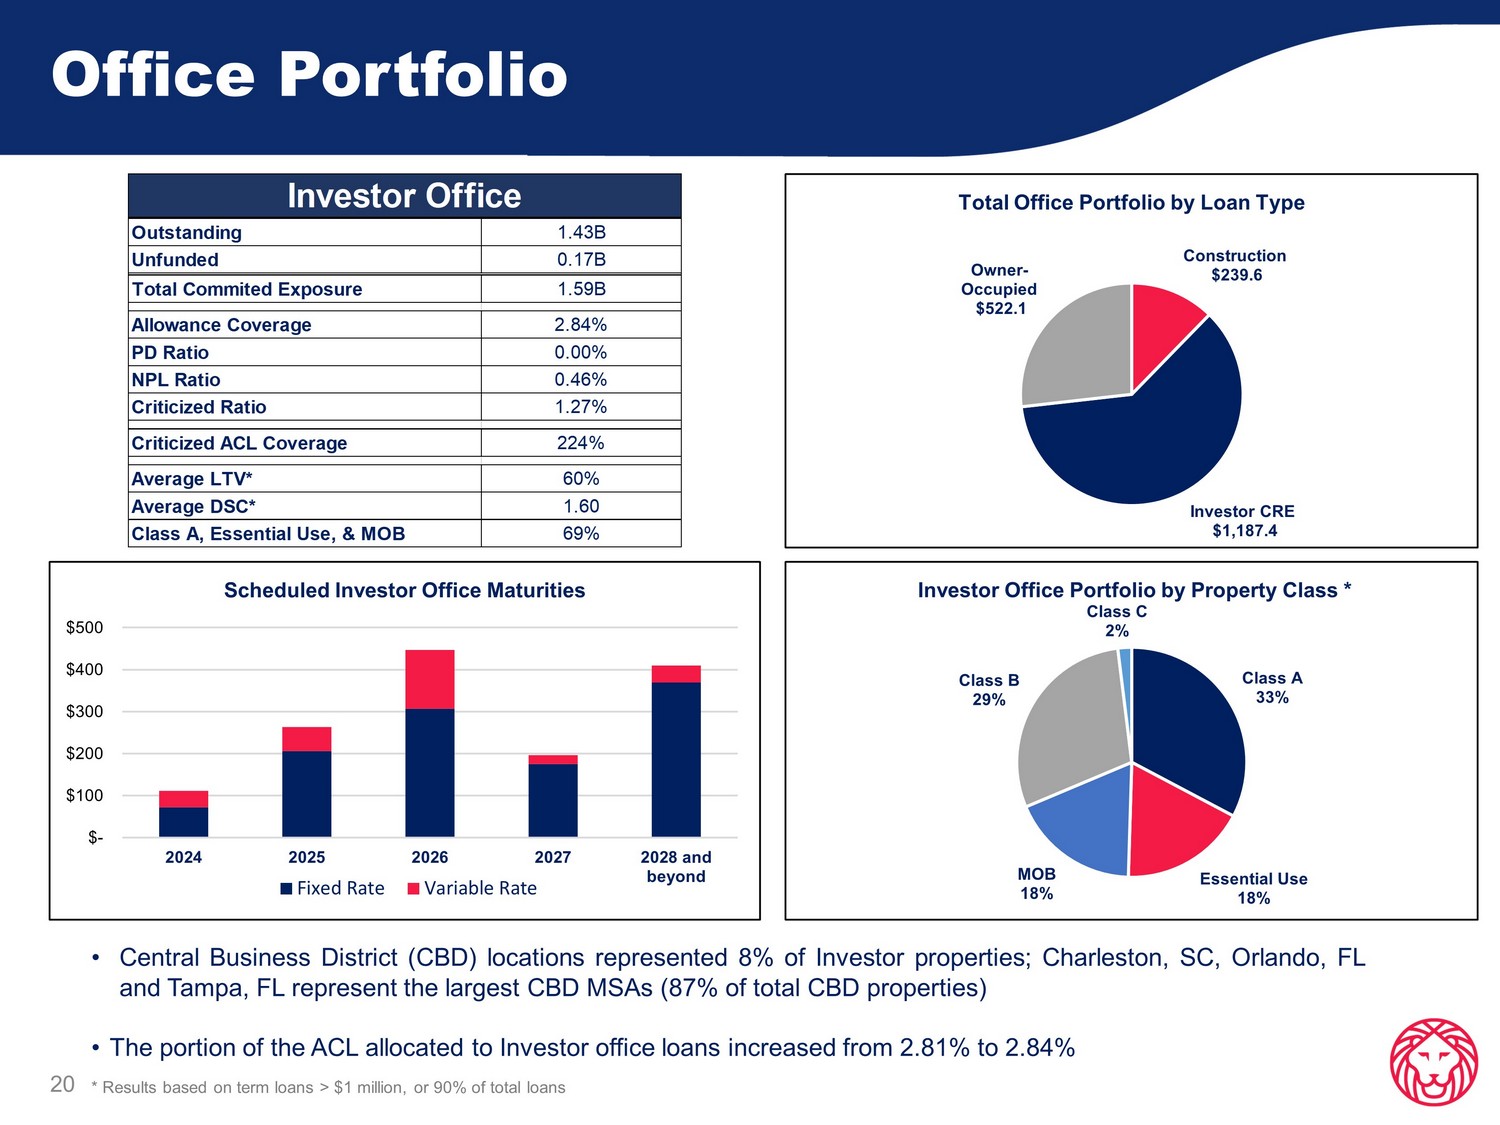
Office Portfolio • Central Business District (CBD) locations represented 8 % of Investor properties ; Charleston, SC, Orlando, FL and Tampa, FL represent the largest CBD MSAs ( 87 % of total CBD properties) • The portion of the ACL allocated to Investor office loans increased from 2 . 81 % to 2 . 84 % * Results based on term loans > $ 1 million, or 90 % of total loans 20 $- $100 $200 $300 $400 $500 2024 2025 2026 2027 2028 and beyond Scheduled Investor Office Maturities Fixed Rate Variable Rate Construction $239.6 Investor CRE $1,187.4 Owner - Occupied $522.1 Total Office Portfolio by Loan Type Class A 33% Essential Use 18% MOB 18% Class B 29% Class C 2% Investor Office Portfolio by Property Class * Outstanding 1.43B Unfunded 0.17B Total Commited Exposure 1.59B Allowance Coverage 2.84% PD Ratio 0.00% NPL Ratio 0.46% Criticized Ratio 1.27% Criticized ACL Coverage 224% Average LTV* 60% Average DSC* 1.60 Class A, Essential Use, & MOB 69% Investor Office
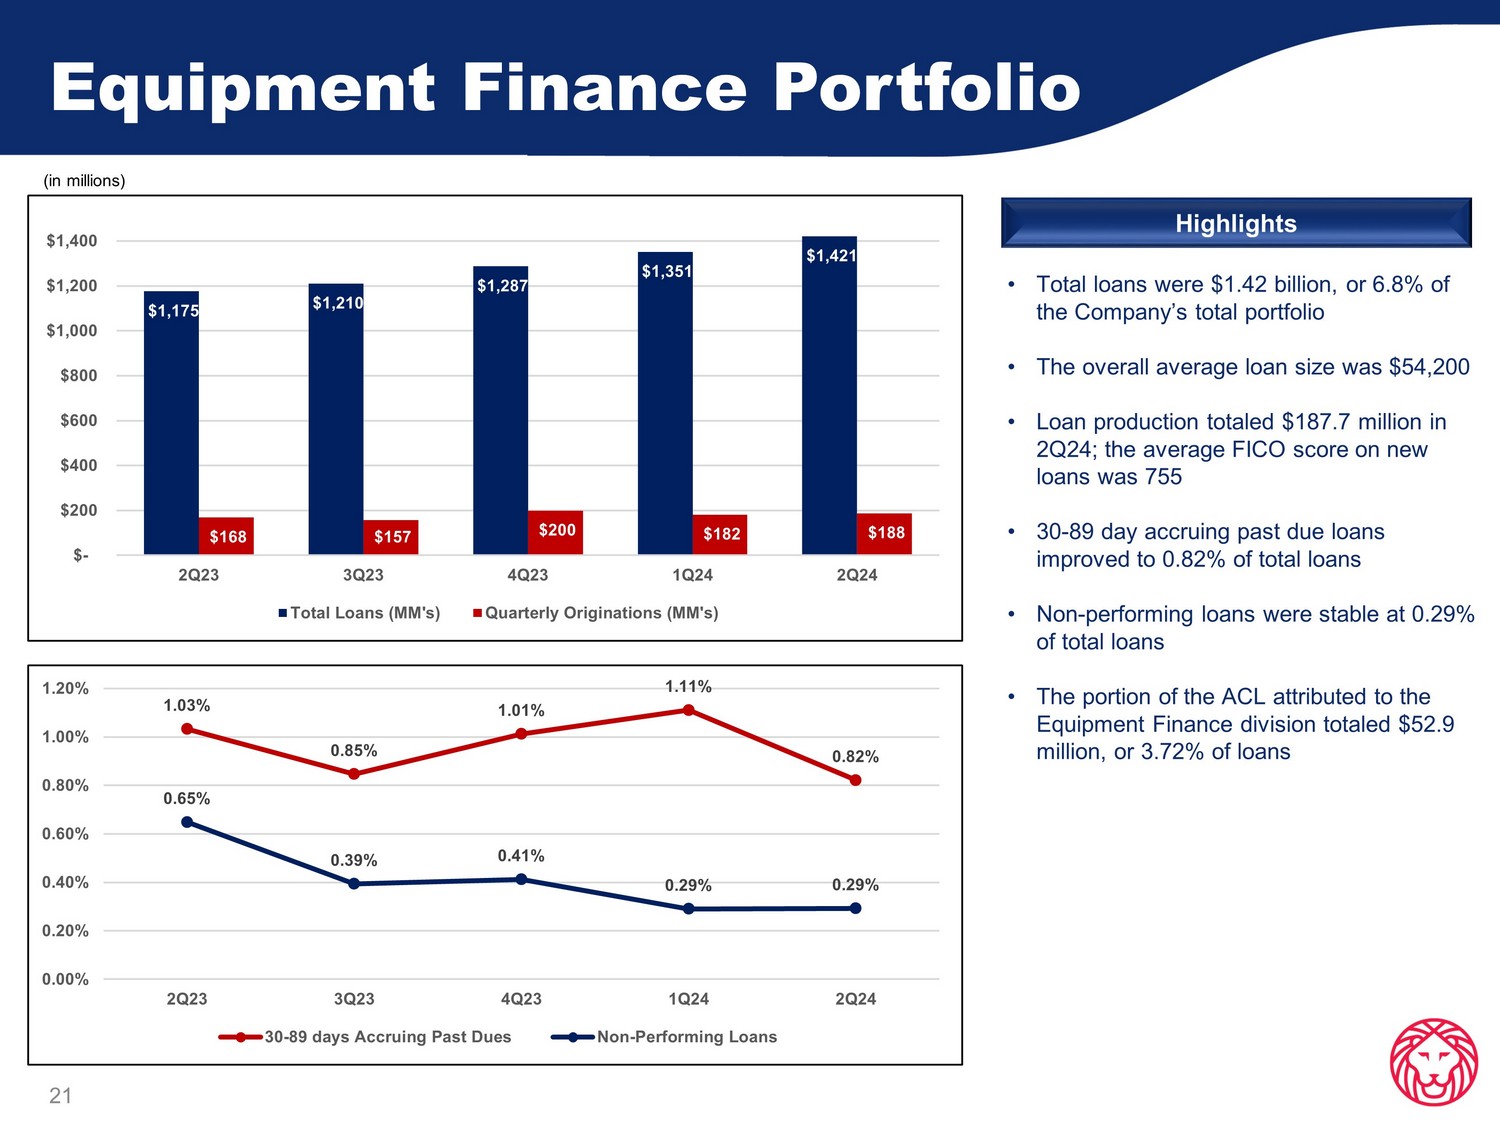
Equipment Finance Portfolio 21 • Total loans were $1.42 billion, or 6.8% of the Company’s total portfolio • The overall average loan size was $54,200 • Loan production totaled $187.7 million in 2Q24; the average FICO score on new loans was 755 • 30 - 89 day accruing past due loans improved to 0.82% of total loans • Non - performing loans were stable at 0.29% of total loans • The portion of the ACL attributed to the Equipment Finance division totaled $52.9 million, or 3.72% of loans Highlights (in millions) 1.03% 0.85% 1.01% 1.11% 0.82% 0.65% 0.39% 0.41% 0.29% 0.29% 0.00% 0.20% 0.40% 0.60% 0.80% 1.00% 1.20% 2Q23 3Q23 4Q23 1Q24 2Q24 30-89 days Accruing Past Dues Non-Performing Loans $1,175 $1,210 $1,287 $1,351 $1,421 $168 $157 $200 $182 $188 $- $200 $400 $600 $800 $1,000 $1,200 $1,400 2Q23 3Q23 4Q23 1Q24 2Q24 Total Loans (MM's) Quarterly Originations (MM's)

Appendix
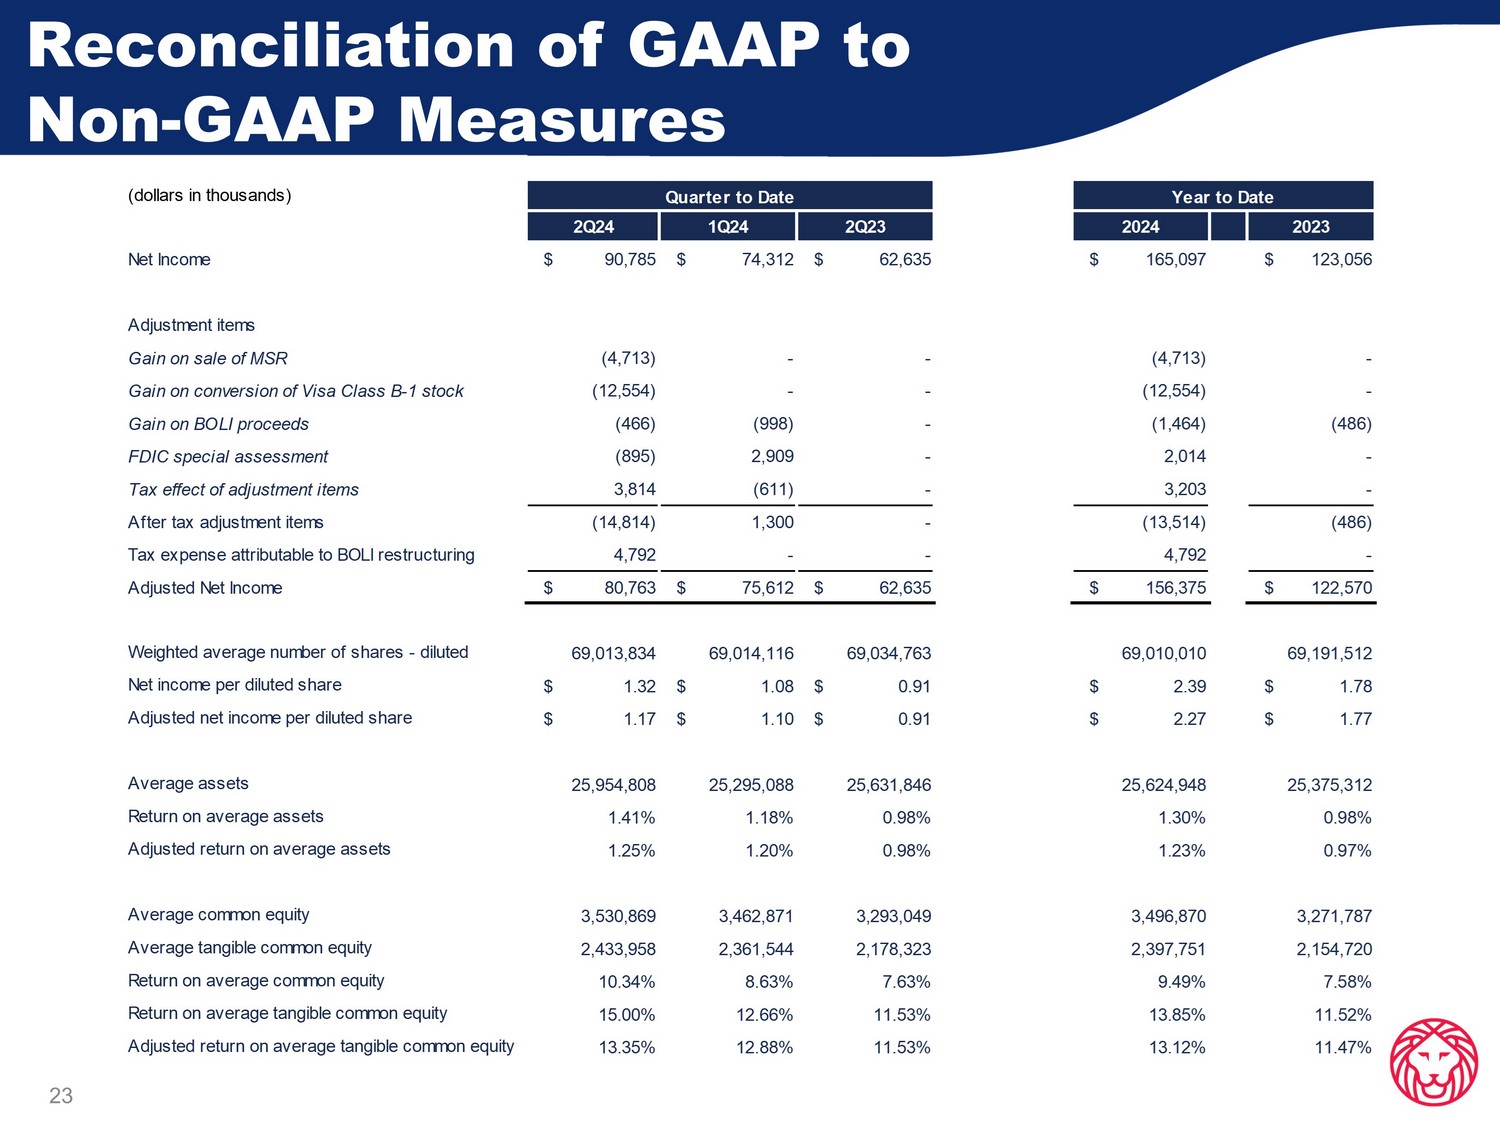
23 Reconciliation of GAAP to Non - GAAP Measures (dollars in thousands) 2Q24 1Q24 2Q23 2024 2023 Net Income $ 90,785 $ 74,312 $ 62,635 $ 165,097 $ 123,056 Adjustment items Gain on sale of MSR (4,713) - - (4,713) - Gain on conversion of Visa Class B-1 stock (12,554) - - (12,554) - Gain on BOLI proceeds (466) (998) - (1,464) (486) FDIC special assessment (895) 2,909 - 2,014 - Tax effect of adjustment items 3,814 (611) - 3,203 - After tax adjustment items (14,814) 1,300 - (13,514) (486) Tax expense attributable to BOLI restructuring 4,792 - - 4,792 - Adjusted Net Income $ 80,763 $ 75,612 $ 62,635 $ 156,375 $ 122,570 Weighted average number of shares - diluted 69,013,834 69,014,116 69,034,763 69,010,010 69,191,512 Net income per diluted share $ 1.32 $ 1.08 $ 0.91 $ 2.39 $ 1.78 Adjusted net income per diluted share $ 1.17 $ 1.10 $ 0.91 $ 2.27 $ 1.77 Average assets 25,954,808 25,295,088 25,631,846 25,624,948 25,375,312 Return on average assets 1.41% 1.18% 0.98% 1.30% 0.98% Adjusted return on average assets 1.25% 1.20% 0.98% 1.23% 0.97% Average common equity 3,530,869 3,462,871 3,293,049 3,496,870 3,271,787 Average tangible common equity 2,433,958 2,361,544 2,178,323 2,397,751 2,154,720 Return on average common equity 10.34% 8.63% 7.63% 9.49% 7.58% Return on average tangible common equity 15.00% 12.66% 11.53% 13.85% 11.52% Adjusted return on average tangible common equity 13.35% 12.88% 11.53% 13.12% 11.47% Quarter to Date Year to Date
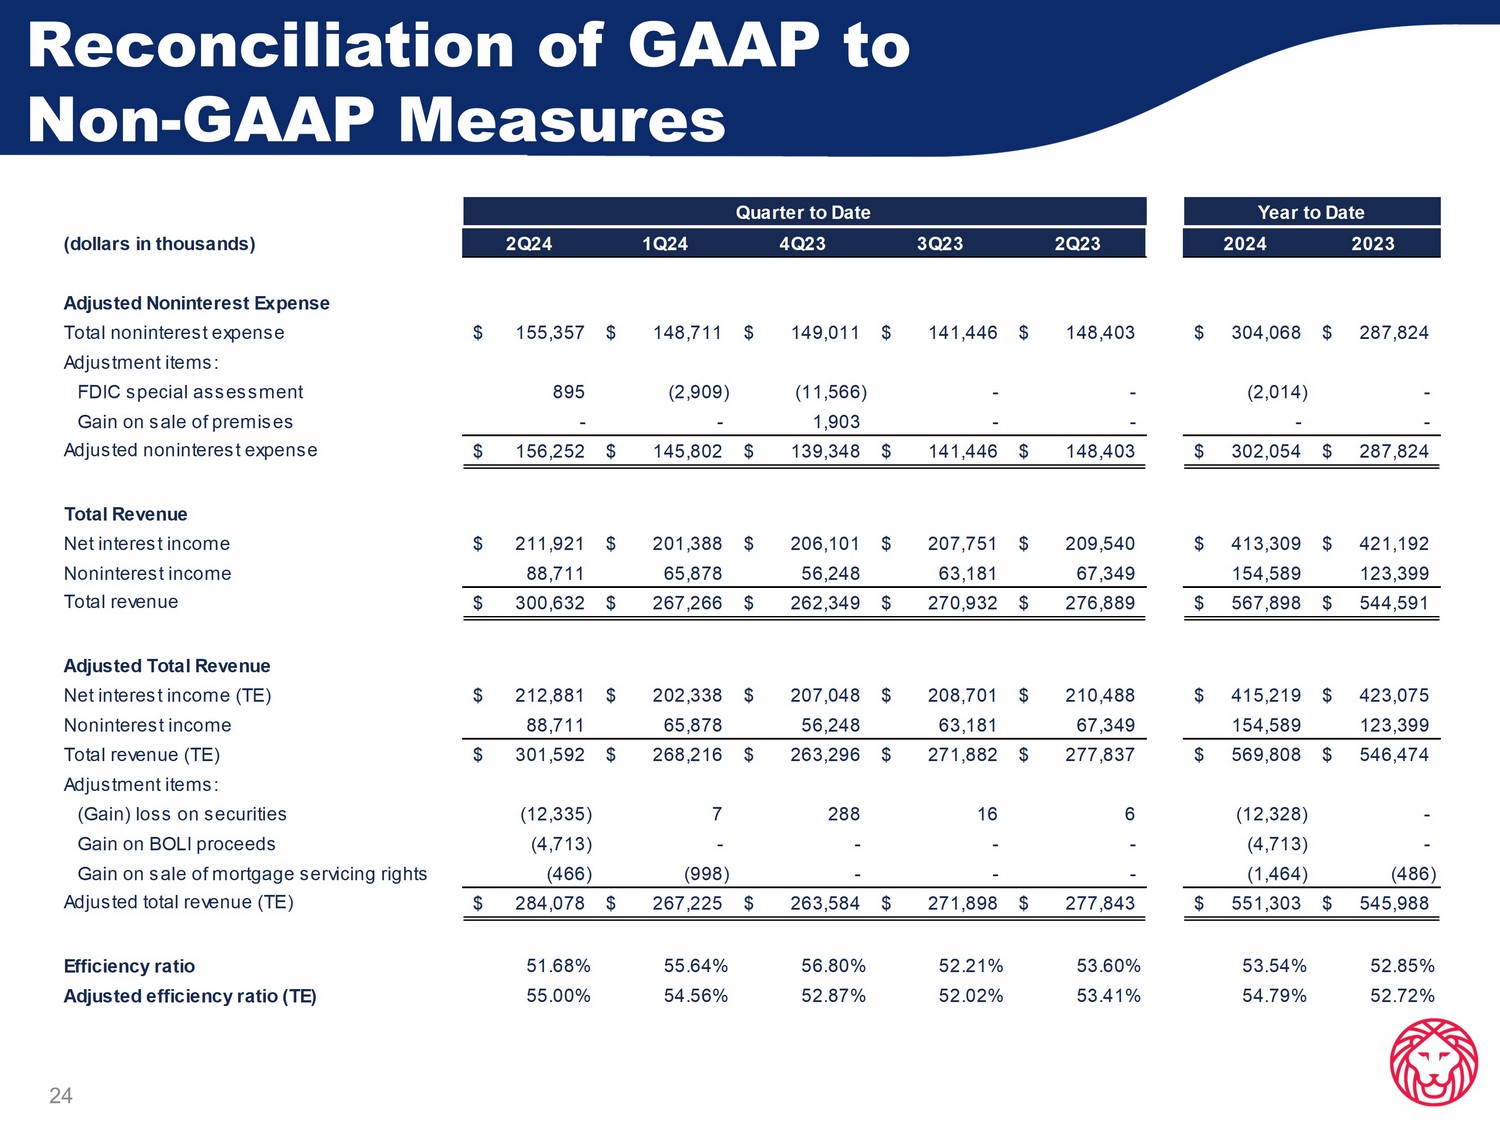
24 Reconciliation of GAAP to Non - GAAP Measures (dollars in thousands) 2Q24 1Q24 4Q23 3Q23 2Q23 2024 2023 Adjusted Noninterest Expense Total noninterest expense 155,357$ 148,711$ 149,011$ 141,446$ 148,403$ 304,068$ 287,824$ Adjustment items: FDIC special assessment 895 (2,909) (11,566) - - (2,014) - Gain on sale of premises - - 1,903 - - - - Adjusted noninterest expense 156,252$ 145,802$ 139,348$ 141,446$ 148,403$ 302,054$ 287,824$ Total Revenue Net interest income 211,921$ 201,388$ 206,101$ 207,751$ 209,540$ 413,309$ 421,192$ Noninterest income 88,711 65,878 56,248 63,181 67,349 154,589 123,399 Total revenue 300,632$ 267,266$ 262,349$ 270,932$ 276,889$ 567,898$ 544,591$ Adjusted Total Revenue Net interest income (TE) 212,881$ 202,338$ 207,048$ 208,701$ 210,488$ 415,219$ 423,075$ Noninterest income 88,711 65,878 56,248 63,181 67,349 154,589 123,399 Total revenue (TE) 301,592$ 268,216$ 263,296$ 271,882$ 277,837$ 569,808$ 546,474$ Adjustment items: (Gain) loss on securities (12,335) 7 288 16 6 (12,328) - Gain on BOLI proceeds (4,713) - - - - (4,713) - Gain on sale of mortgage servicing rights (466) (998) - - - (1,464) (486) Adjusted total revenue (TE) 284,078$ 267,225$ 263,584$ 271,898$ 277,843$ 551,303$ 545,988$ Efficiency ratio 51.68% 55.64% 56.80% 52.21% 53.60% 53.54% 52.85% Adjusted efficiency ratio (TE) 55.00% 54.56% 52.87% 52.02% 53.41% 54.79% 52.72% Year to DateQuarter to Date
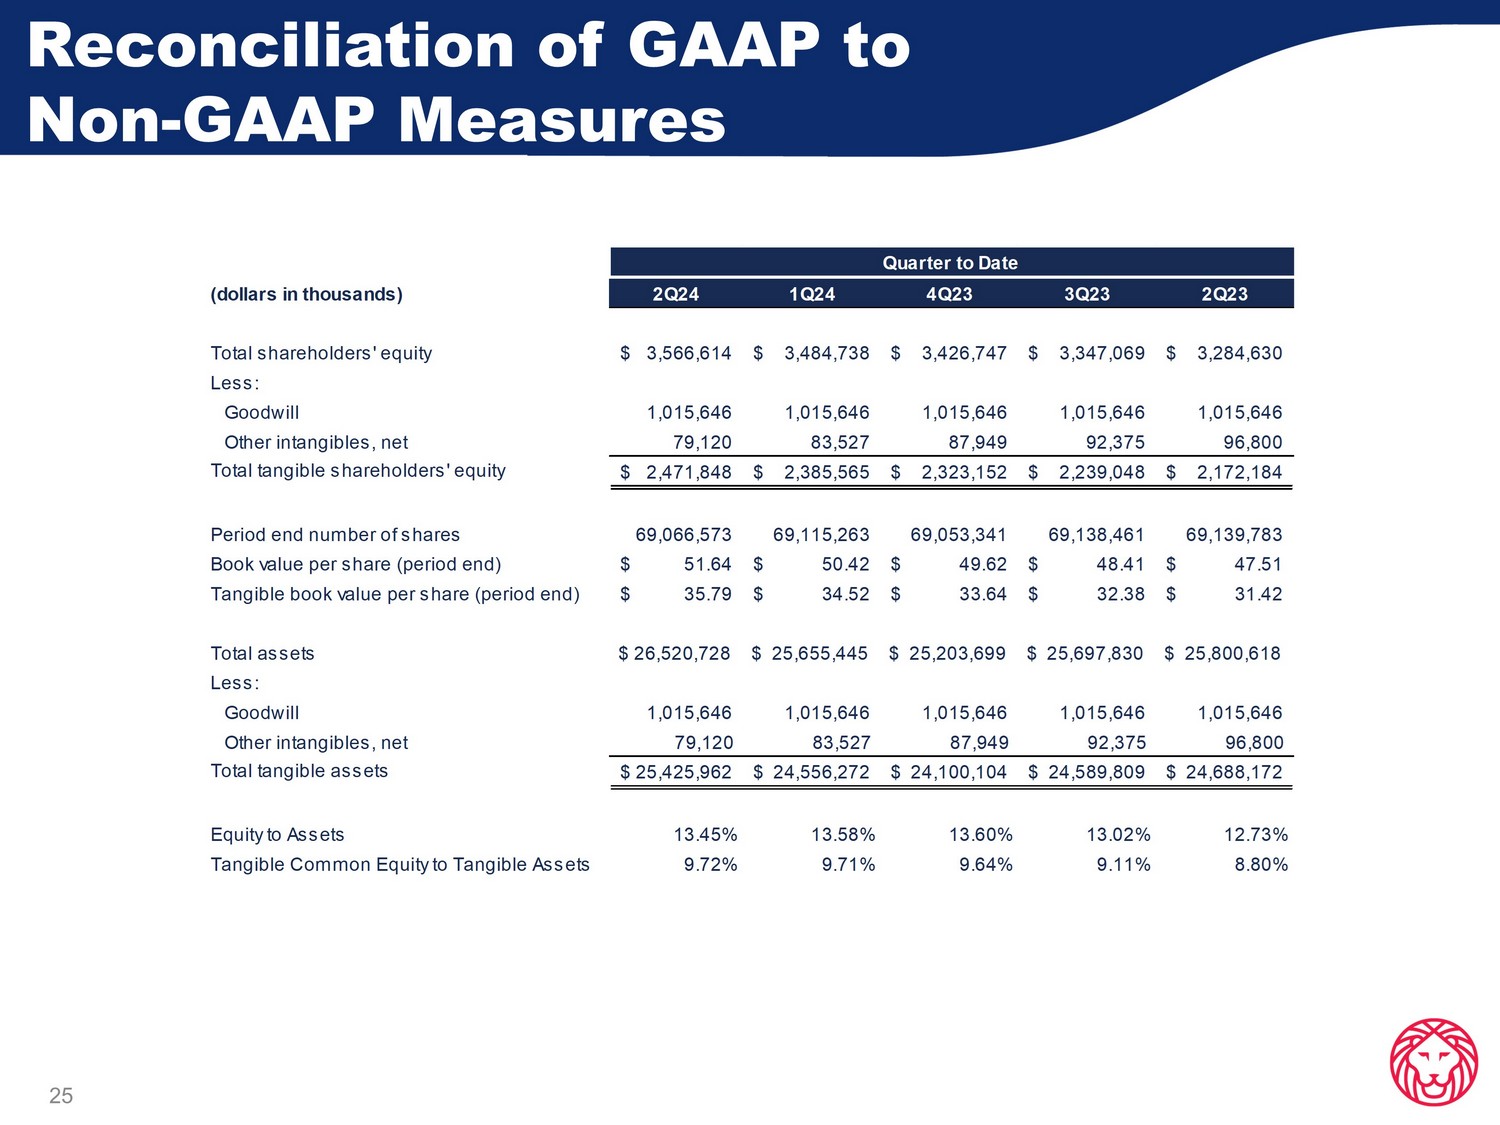
25 Reconciliation of GAAP to Non - GAAP Measures (dollars in thousands) 2Q24 1Q24 4Q23 3Q23 2Q23 Total shareholders' equity 3,566,614$ 3,484,738$ 3,426,747$ 3,347,069$ 3,284,630$ Less: Goodwill 1,015,646 1,015,646 1,015,646 1,015,646 1,015,646 Other intangibles, net 79,120 83,527 87,949 92,375 96,800 Total tangible shareholders' equity 2,471,848$ 2,385,565$ 2,323,152$ 2,239,048$ 2,172,184$ Period end number of shares 69,066,573 69,115,263 69,053,341 69,138,461 69,139,783 Book value per share (period end) 51.64$ 50.42$ 49.62$ 48.41$ 47.51$ Tangible book value per share (period end) 35.79$ 34.52$ 33.64$ 32.38$ 31.42$ Total assets $ 26,520,728 $ 25,655,445 $ 25,203,699 $ 25,697,830 $ 25,800,618 Less: Goodwill 1,015,646 1,015,646 1,015,646 1,015,646 1,015,646 Other intangibles, net 79,120 83,527 87,949 92,375 96,800 Total tangible assets 25,425,962$ 24,556,272$ 24,100,104$ 24,589,809$ 24,688,172$ Equity to Assets 13.45% 13.58% 13.60% 13.02% 12.73% Tangible Common Equity to Tangible Assets 9.72% 9.71% 9.64% 9.11% 8.80% Quarter to Date
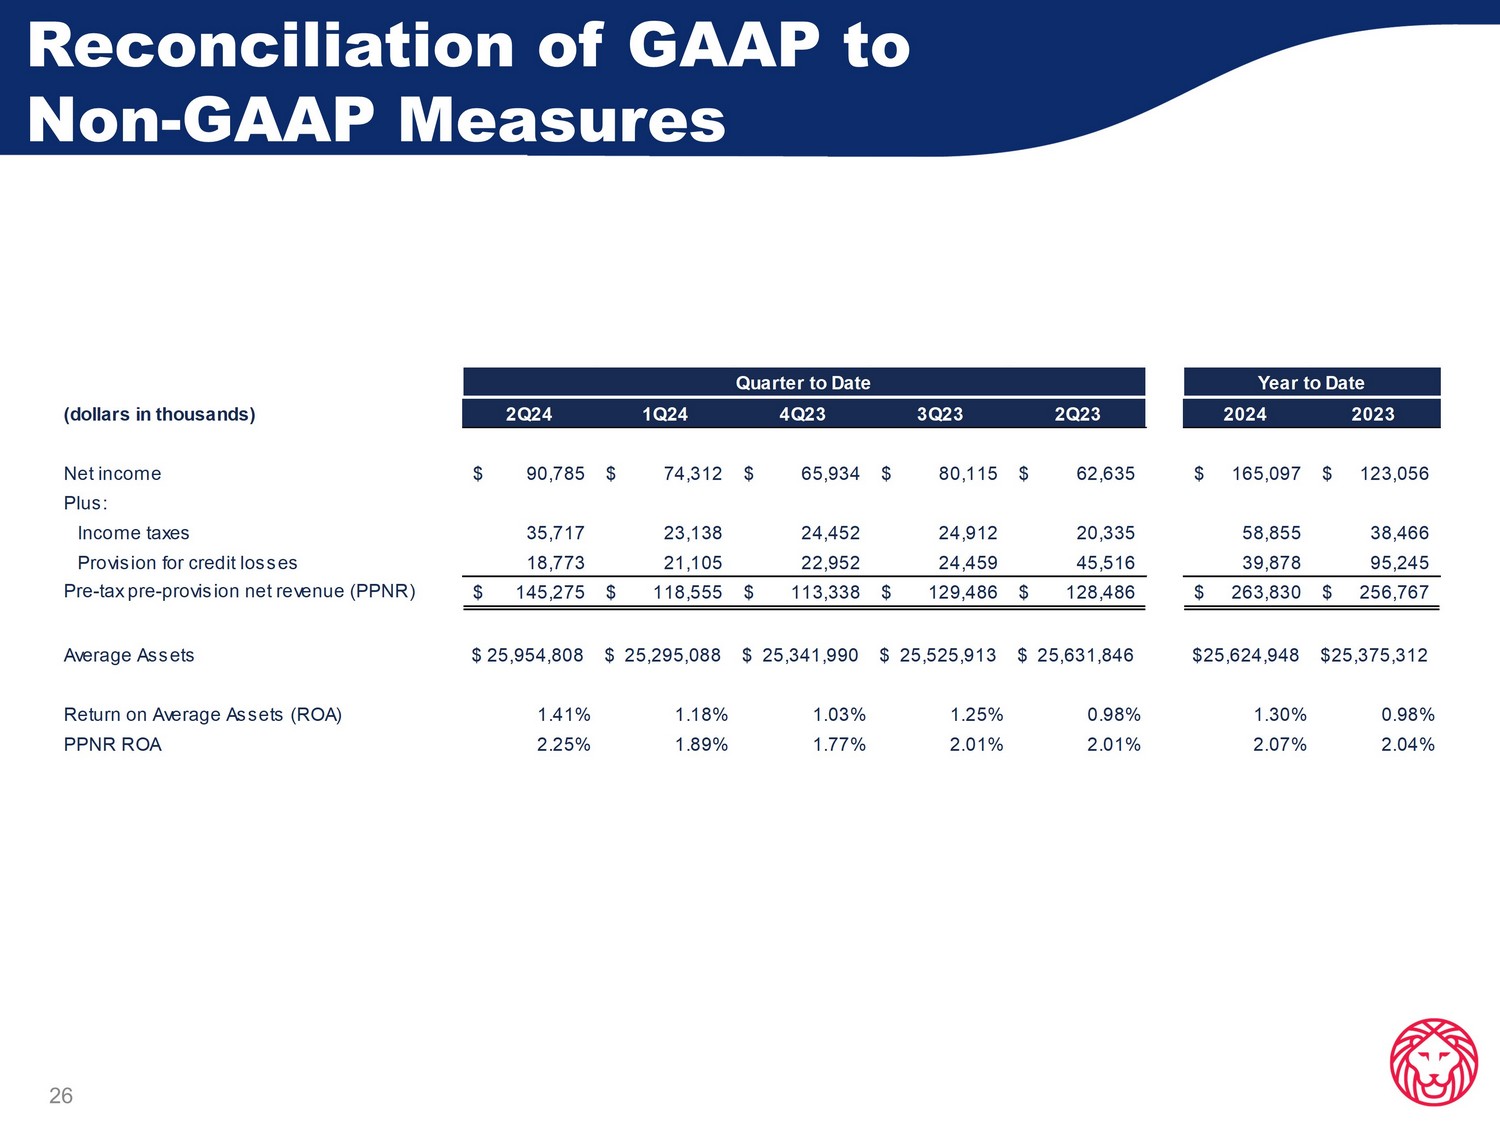
26 Reconciliation of GAAP to Non - GAAP Measures (dollars in thousands) 2Q24 1Q24 4Q23 3Q23 2Q23 2024 2023 Net income 90,785$ 74,312$ 65,934$ 80,115$ 62,635$ 165,097$ 123,056$ Plus: Income taxes 35,717 23,138 24,452 24,912 20,335 58,855 38,466 Provision for credit losses 18,773 21,105 22,952 24,459 45,516 39,878 95,245 Pre-tax pre-provision net revenue (PPNR) 145,275$ 118,555$ 113,338$ 129,486$ 128,486$ 263,830$ 256,767$ Average Assets $ 25,954,808 $ 25,295,088 $ 25,341,990 $ 25,525,913 $ 25,631,846 $25,624,948 $25,375,312 Return on Average Assets (ROA) 1.41% 1.18% 1.03% 1.25% 0.98% 1.30% 0.98% PPNR ROA 2.25% 1.89% 1.77% 2.01% 2.01% 2.07% 2.04% Quarter to Date Year to Date
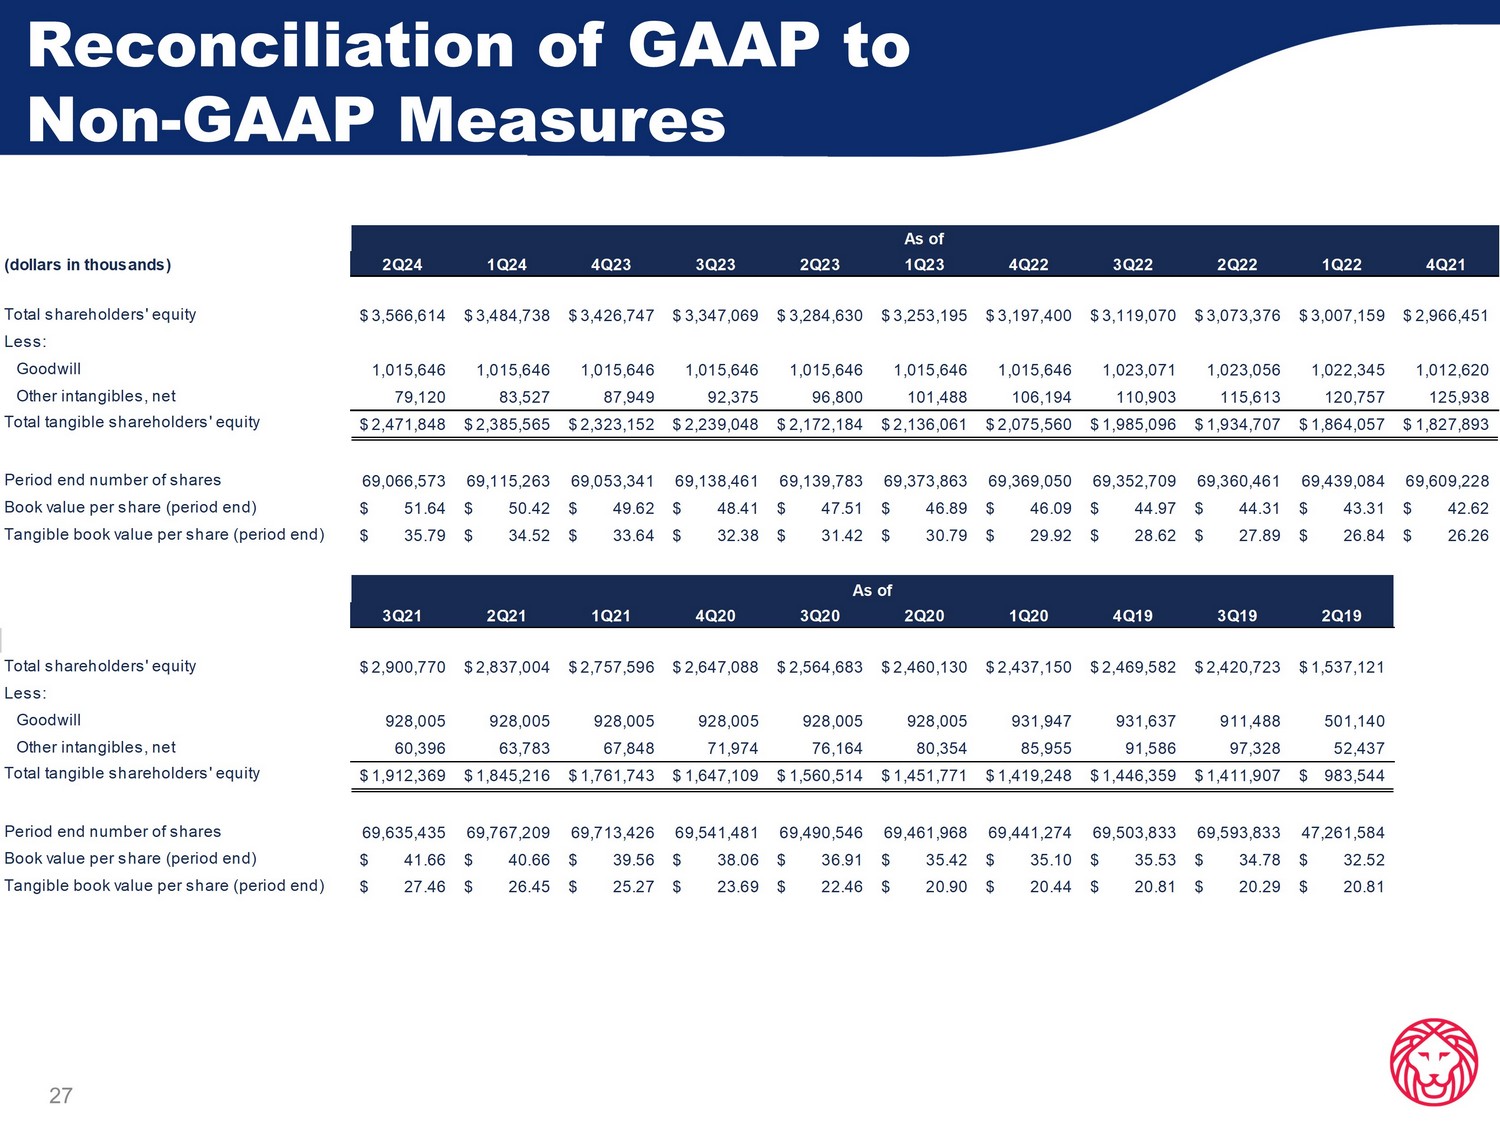
27 Reconciliation of GAAP to Non - GAAP Measures (dollars in thousands) 2Q24 1Q24 4Q23 3Q23 2Q23 1Q23 4Q22 3Q22 2Q22 1Q22 4Q21 Total shareholders' equity 3,566,614$ 3,484,738$ 3,426,747$ 3,347,069$ 3,284,630$ 3,253,195$ 3,197,400$ 3,119,070$ 3,073,376$ 3,007,159$ 2,966,451$ Less: Goodwill 1,015,646 1,015,646 1,015,646 1,015,646 1,015,646 1,015,646 1,015,646 1,023,071 1,023,056 1,022,345 1,012,620 Other intangibles, net 79,120 83,527 87,949 92,375 96,800 101,488 106,194 110,903 115,613 120,757 125,938 Total tangible shareholders' equity 2,471,848$ 2,385,565$ 2,323,152$ 2,239,048$ 2,172,184$ 2,136,061$ 2,075,560$ 1,985,096$ 1,934,707$ 1,864,057$ 1,827,893$ Period end number of shares 69,066,573 69,115,263 69,053,341 69,138,461 69,139,783 69,373,863 69,369,050 69,352,709 69,360,461 69,439,084 69,609,228 Book value per share (period end) 51.64$ 50.42$ 49.62$ 48.41$ 47.51$ 46.89$ 46.09$ 44.97$ 44.31$ 43.31$ 42.62$ Tangible book value per share (period end) 35.79$ 34.52$ 33.64$ 32.38$ 31.42$ 30.79$ 29.92$ 28.62$ 27.89$ 26.84$ 26.26$ 3Q21 2Q21 1Q21 4Q20 3Q20 2Q20 1Q20 4Q19 3Q19 2Q19 Total shareholders' equity 2,900,770$ 2,837,004$ 2,757,596$ 2,647,088$ 2,564,683$ 2,460,130$ 2,437,150$ 2,469,582$ 2,420,723$ 1,537,121$ Less: Goodwill 928,005 928,005 928,005 928,005 928,005 928,005 931,947 931,637 911,488 501,140 Other intangibles, net 60,396 63,783 67,848 71,974 76,164 80,354 85,955 91,586 97,328 52,437 Total tangible shareholders' equity 1,912,369$ 1,845,216$ 1,761,743$ 1,647,109$ 1,560,514$ 1,451,771$ 1,419,248$ 1,446,359$ 1,411,907$ 983,544$ Period end number of shares 69,635,435 69,767,209 69,713,426 69,541,481 69,490,546 69,461,968 69,441,274 69,503,833 69,593,833 47,261,584 Book value per share (period end) 41.66$ 40.66$ 39.56$ 38.06$ 36.91$ 35.42$ 35.10$ 35.53$ 34.78$ 32.52$ Tangible book value per share (period end) 27.46$ 26.45$ 25.27$ 23.69$ 22.46$ 20.90$ 20.44$ 20.81$ 20.29$ 20.81$ As of As of

Ameris Bancorp Press Release & Financial Highlights June 30, 2024
v3.24.2
| X |
- DefinitionBoolean flag that is true when the XBRL content amends previously-filed or accepted submission.
| Name: |
dei_AmendmentFlag |
| Namespace Prefix: |
dei_ |
| Data Type: |
xbrli:booleanItemType |
| Balance Type: |
na |
| Period Type: |
duration |
|
| X |
- DefinitionFor the EDGAR submission types of Form 8-K: the date of the report, the date of the earliest event reported; for the EDGAR submission types of Form N-1A: the filing date; for all other submission types: the end of the reporting or transition period. The format of the date is YYYY-MM-DD.
| Name: |
dei_DocumentPeriodEndDate |
| Namespace Prefix: |
dei_ |
| Data Type: |
xbrli:dateItemType |
| Balance Type: |
na |
| Period Type: |
duration |
|
| X |
- DefinitionThe type of document being provided (such as 10-K, 10-Q, 485BPOS, etc). The document type is limited to the same value as the supporting SEC submission type, or the word 'Other'.
| Name: |
dei_DocumentType |
| Namespace Prefix: |
dei_ |
| Data Type: |
dei:submissionTypeItemType |
| Balance Type: |
na |
| Period Type: |
duration |
|
| X |
- DefinitionAddress Line 1 such as Attn, Building Name, Street Name
| Name: |
dei_EntityAddressAddressLine1 |
| Namespace Prefix: |
dei_ |
| Data Type: |
xbrli:normalizedStringItemType |
| Balance Type: |
na |
| Period Type: |
duration |
|
| X |
- DefinitionAddress Line 2 such as Street or Suite number
| Name: |
dei_EntityAddressAddressLine2 |
| Namespace Prefix: |
dei_ |
| Data Type: |
xbrli:normalizedStringItemType |
| Balance Type: |
na |
| Period Type: |
duration |
|
| X |
- Definition
+ References
+ Details
| Name: |
dei_EntityAddressCityOrTown |
| Namespace Prefix: |
dei_ |
| Data Type: |
xbrli:normalizedStringItemType |
| Balance Type: |
na |
| Period Type: |
duration |
|
| X |
- DefinitionCode for the postal or zip code
| Name: |
dei_EntityAddressPostalZipCode |
| Namespace Prefix: |
dei_ |
| Data Type: |
xbrli:normalizedStringItemType |
| Balance Type: |
na |
| Period Type: |
duration |
|
| X |
- DefinitionName of the state or province.
| Name: |
dei_EntityAddressStateOrProvince |
| Namespace Prefix: |
dei_ |
| Data Type: |
dei:stateOrProvinceItemType |
| Balance Type: |
na |
| Period Type: |
duration |
|
| X |
- DefinitionA unique 10-digit SEC-issued value to identify entities that have filed disclosures with the SEC. It is commonly abbreviated as CIK. Reference 1: http://www.xbrl.org/2003/role/presentationRef
-Publisher SEC
-Name Exchange Act
-Number 240
-Section 12
-Subsection b-2
| Name: |
dei_EntityCentralIndexKey |
| Namespace Prefix: |
dei_ |
| Data Type: |
dei:centralIndexKeyItemType |
| Balance Type: |
na |
| Period Type: |
duration |
|
| X |
- DefinitionIndicate if registrant meets the emerging growth company criteria. Reference 1: http://www.xbrl.org/2003/role/presentationRef
-Publisher SEC
-Name Exchange Act
-Number 240
-Section 12
-Subsection b-2
| Name: |
dei_EntityEmergingGrowthCompany |
| Namespace Prefix: |
dei_ |
| Data Type: |
xbrli:booleanItemType |
| Balance Type: |
na |
| Period Type: |
duration |
|
| X |
- DefinitionCommission file number. The field allows up to 17 characters. The prefix may contain 1-3 digits, the sequence number may contain 1-8 digits, the optional suffix may contain 1-4 characters, and the fields are separated with a hyphen.
| Name: |
dei_EntityFileNumber |
| Namespace Prefix: |
dei_ |
| Data Type: |
dei:fileNumberItemType |
| Balance Type: |
na |
| Period Type: |
duration |
|
| X |
- DefinitionTwo-character EDGAR code representing the state or country of incorporation.
| Name: |
dei_EntityIncorporationStateCountryCode |
| Namespace Prefix: |
dei_ |
| Data Type: |
dei:edgarStateCountryItemType |
| Balance Type: |
na |
| Period Type: |
duration |
|
| X |
- DefinitionThe exact name of the entity filing the report as specified in its charter, which is required by forms filed with the SEC. Reference 1: http://www.xbrl.org/2003/role/presentationRef
-Publisher SEC
-Name Exchange Act
-Number 240
-Section 12
-Subsection b-2
| Name: |
dei_EntityRegistrantName |
| Namespace Prefix: |
dei_ |
| Data Type: |
xbrli:normalizedStringItemType |
| Balance Type: |
na |
| Period Type: |
duration |
|
| X |
- DefinitionThe Tax Identification Number (TIN), also known as an Employer Identification Number (EIN), is a unique 9-digit value assigned by the IRS. Reference 1: http://www.xbrl.org/2003/role/presentationRef
-Publisher SEC
-Name Exchange Act
-Number 240
-Section 12
-Subsection b-2
| Name: |
dei_EntityTaxIdentificationNumber |
| Namespace Prefix: |
dei_ |
| Data Type: |
dei:employerIdItemType |
| Balance Type: |
na |
| Period Type: |
duration |
|
| X |
- DefinitionLocal phone number for entity.
| Name: |
dei_LocalPhoneNumber |
| Namespace Prefix: |
dei_ |
| Data Type: |
xbrli:normalizedStringItemType |
| Balance Type: |
na |
| Period Type: |
duration |
|
| X |
- DefinitionBoolean flag that is true when the Form 8-K filing is intended to satisfy the filing obligation of the registrant as pre-commencement communications pursuant to Rule 13e-4(c) under the Exchange Act. Reference 1: http://www.xbrl.org/2003/role/presentationRef
-Publisher SEC
-Name Exchange Act
-Number 240
-Section 13e
-Subsection 4c
| Name: |
dei_PreCommencementIssuerTenderOffer |
| Namespace Prefix: |
dei_ |
| Data Type: |
xbrli:booleanItemType |
| Balance Type: |
na |
| Period Type: |
duration |
|
| X |
- DefinitionBoolean flag that is true when the Form 8-K filing is intended to satisfy the filing obligation of the registrant as pre-commencement communications pursuant to Rule 14d-2(b) under the Exchange Act. Reference 1: http://www.xbrl.org/2003/role/presentationRef
-Publisher SEC
-Name Exchange Act
-Number 240
-Section 14d
-Subsection 2b
| Name: |
dei_PreCommencementTenderOffer |
| Namespace Prefix: |
dei_ |
| Data Type: |
xbrli:booleanItemType |
| Balance Type: |
na |
| Period Type: |
duration |
|
| X |
- DefinitionTitle of a 12(b) registered security. Reference 1: http://www.xbrl.org/2003/role/presentationRef
-Publisher SEC
-Name Exchange Act
-Number 240
-Section 12
-Subsection b
| Name: |
dei_Security12bTitle |
| Namespace Prefix: |
dei_ |
| Data Type: |
dei:securityTitleItemType |
| Balance Type: |
na |
| Period Type: |
duration |
|
| X |
- DefinitionName of the Exchange on which a security is registered. Reference 1: http://www.xbrl.org/2003/role/presentationRef
-Publisher SEC
-Name Exchange Act
-Number 240
-Section 12
-Subsection d1-1
| Name: |
dei_SecurityExchangeName |
| Namespace Prefix: |
dei_ |
| Data Type: |
dei:edgarExchangeCodeItemType |
| Balance Type: |
na |
| Period Type: |
duration |
|
| X |
- DefinitionBoolean flag that is true when the Form 8-K filing is intended to satisfy the filing obligation of the registrant as soliciting material pursuant to Rule 14a-12 under the Exchange Act. Reference 1: http://www.xbrl.org/2003/role/presentationRef
-Publisher SEC
-Name Exchange Act
-Section 14a
-Number 240
-Subsection 12
| Name: |
dei_SolicitingMaterial |
| Namespace Prefix: |
dei_ |
| Data Type: |
xbrli:booleanItemType |
| Balance Type: |
na |
| Period Type: |
duration |
|
| X |
- DefinitionTrading symbol of an instrument as listed on an exchange.
| Name: |
dei_TradingSymbol |
| Namespace Prefix: |
dei_ |
| Data Type: |
dei:tradingSymbolItemType |
| Balance Type: |
na |
| Period Type: |
duration |
|
| X |
- DefinitionBoolean flag that is true when the Form 8-K filing is intended to satisfy the filing obligation of the registrant as written communications pursuant to Rule 425 under the Securities Act. Reference 1: http://www.xbrl.org/2003/role/presentationRef
-Publisher SEC
-Name Securities Act
-Number 230
-Section 425
| Name: |
dei_WrittenCommunications |
| Namespace Prefix: |
dei_ |
| Data Type: |
xbrli:booleanItemType |
| Balance Type: |
na |
| Period Type: |
duration |
|
Ameris Bancorp (NYSE:ABCB)
Historical Stock Chart
From Jun 2024 to Jul 2024

Ameris Bancorp (NYSE:ABCB)
Historical Stock Chart
From Jul 2023 to Jul 2024
