UNITED STATES
SECURITIES AND EXCHANGE COMMISSION
Washington, D.C. 20549
FORM 6-K
REPORT OF FOREIGN PRIVATE ISSUER
PURSUANT TO RULE 13a-16 OR 15d-16 OF
THE SECURITIES EXCHANGE ACT OF 1934
For the month of November 2023
Commission File Number 001-36903
KORNIT DIGITAL
LTD.
(Translation of Registrant’s name into English)
12 Ha’Amal Street
Park Afek
Rosh Ha’Ayin 4824096 Israel
(Address of Principal Executive Office)
Indicate by check mark whether the registrant
files or will file annual reports under cover of Form 20-F or Form 40-F.
Form 20-F ☒
Form 40-F ☐
CONTENTS
Results of Operations and Financial Condition- Quarter and Nine
Months Ended September 30, 2023
On November 8, 2023, Kornit Digital Ltd. (“Kornit”)
issued a press release entitled “Kornit Digital Reports Third Quarter 2023 Results,” in which Kornit reported its results
of operations for the third quarter and nine months ended September 30, 2023. A copy of that press release is furnished as Exhibit
99.1 to this Report of Foreign Private Issuer on Form 6-K (this “Form 6-K”).
Kornit is holding a conference call on November
8, 2023 to discuss its results for the quarter and nine months ended September 30, 2023, and, in connection with that call, will make
available to its investors a slide presentation to provide additional information regarding its business and its financial results. That
slide presentation is attached as Exhibit 99.2 to this Form 6-K and is incorporated herein by reference.
Incorporation by Reference
The U.S. GAAP financial information contained
in the (i) consolidated balance sheets, (ii) consolidated statements of operations and (iii) consolidated statements of cash flows included
in the press release attached as Exhibit 99.1 to this Report of Foreign Private Issuer on Form 6-K is hereby incorporated by reference
into Kornit’s Registration Statements on Form S-8 (File No.’s 333-203970, 333-214015, 333-217039, 333-223794, 333-230567,
333-237346, 333-254749, and 333-263975).
Exhibits
SIGNATURES
Pursuant to the requirements of the Securities
Exchange Act of 1934, the registrant has duly caused this report to be signed on its behalf by the undersigned, thereunto duly authorized.
| |
KORNIT DIGITAL LTD. |
| |
|
|
| Date: November 8, 2023 |
By: |
/s/ Lauri Hanover |
| |
Name: |
Lauri Hanover |
| |
Title: |
Chief Financial Officer |
2
Exhibit 99.1
Investor Contact:
Jared Maymon
Global Head of Investor Relations
jared.maymon@kornit.com

Kornit Digital Reports Third Quarter 2023 Results
| ● | Third quarter revenues of $59.2 million, in line with previous guidance |
| ● | Third quarter GAAP net loss of $8.2 million; non-GAAP net loss of $3.4 million |
| ● | Impressions and consumables revenues both continued to grow year-over-year |
| ● | System sales increased quarter-over-quarter on continued conversion of ITMA
orders |
| ● | Company operations have not been materially impacted by the security situation
in Israel |
Rosh-Ha`Ayin, Israel – November 8, 2023 – Kornit
Digital Ltd. (“Kornit” or the “Company”) (Nasdaq: KRNT), a worldwide market leader in sustainable, on-demand,
digital fashionX and textile production technologies, reported today its results for the third quarter ended September 30,
2023.
“We delivered third quarter revenues within our guidance range,
despite a challenging macroeconomic environment. Our consumables sales grew year-over-year, while system sales improved sequentially as
we continued to convert orders from ITMA,” said Ronen Samuel, Kornit’s Chief Executive Officer. “We also saw further
growth in our direct-to-fabric solutions, resulting in one of the strongest quarters for Presto system sales. Interest in our Atlas MAX
Poly system has also been robust, especially in the sports and athleisure market.”
“During the quarter, we successfully installed our initial Apollo
beta systems, which have received highly encouraging feedback and demonstrated solid uptime, yield, and unit economics. We continue to
target general availability for Apollo in the first quarter of 2024 and are building a strong pipeline of both existing and new customers.”
Mr. Samuel concluded, “Looking ahead, we are taking proactive measures to further diversify our customer base, expand into key textile-producing
regions, and resume overall sales growth, while also focusing on enhancing operating efficiencies across the entire company. Our plan
includes approaching breakeven on an adjusted EBITDA basis during the fourth quarter and achieving profitable growth for the full year
in 2024.”
Third Quarter 2023 Results of Operations
| ● | Total revenue for the third quarter of 2023 was $59.2 million compared with
$66.8 million in the prior year period, due primarily to lower systems revenues. |
| ● | GAAP gross profit margin for the third quarter of 2023 was 34.8% compared
with 32.1% in the prior year period. On a non-GAAP basis, gross profit margin was 37.4% compared with 35.5% in the prior year period. |
| ● | GAAP operating expenses for the third quarter of 2023 decreased by 17.6%
to $35.3 million compared with the prior year period. On a non-GAAP basis, operating expenses decreased by 15.3% to $31.1 million compared
with the prior year period. |
| ● | GAAP net loss for the third quarter of 2023 was $8.2 million, or ($0.17)
per basic share, compared with net loss of $19.0 million, or ($0.38) per basic share, for the third quarter of 2022. |
| ● | Non-GAAP net loss for the third quarter of 2023 was $3.4 million, or ($0.07)
per basic share, compared with non-GAAP net loss of $10.7 million, or ($0.21) per basic share, for the third quarter of 2022. |
| ● | Adjusted EBITDA loss for the third quarter of 2023 was $5.6 million compared
with adjusted EBITDA loss of $10.5 million for the third quarter of 2022. Adjusted EBITDA margin for the third quarter of 2023 was -9.5%
compared with -15.7% for the third quarter of 2022. |
Fourth Quarter 2023 Guidance
For the fourth quarter of 2023, the Company expects revenues to be
in the range of $55 million to $60 million and adjusted EBITDA margin between -6% to 0% of revenue. The guidance for revenue and adjusted
EBITDA margin includes the impact of the non-cash expense associated with the fair value of the Company’s warrants.
Third Quarter Earnings Conference Call Information
The Company will host a conference call today at 8:30 a.m. ET, or 3:30
p.m. Israel time, to discuss the results, followed by a question-and-answer session with the investor community.
A live webcast of the call can be accessed at ir.kornit.com.
To access the call, participants may dial toll-free at 1-877-407-0792 or 1-201-689-8263. The toll-free Israeli number is 1 809 406 247.
The conference confirmation code is 13741274.
To listen to a replay of the conference call, dial toll-free 1-844-512-2921
or 1-412-317-6671 (international) and enter confirmation code 13741274. The telephonic replay will be available approximately three hours
after the completion of the live call until 11:59 pm ET on November 22, 2023. The call will also be available for replay via the webcast
link on Kornit’s Investor Relations website.
About Kornit Digital
Kornit Digital (NASDAQ: KRNT) is a worldwide market leader in sustainable,
on-demand, digital fashionx and textile production technologies. The Company is writing the operating system for fashion with
end-to-end solutions including digital printing systems, inks, consumables, and an entire global ecosystem that manages workflows and
fulfillment. Headquartered in Israel with offices in the USA, Europe, and Asia Pacific, Kornit Digital serves customers in more than 100
countries and states worldwide. To learn more about how Kornit Digital is boldly transforming the world of fashion and textiles, visit
www.kornit.com.
Forward Looking Statements
Certain statements in this press release are “forward-looking
statements” within the meaning of the Private Securities Litigation Reform Act of 1995 and other U.S. securities laws. Forward-looking
statements are characterized by the use of forward-looking terminology such as “will,” “expects,” “anticipates,”
“continue,” “believes,” “should,” “intended,” “guidance,” “preliminary,”
“future,” “planned,” or other words. These forward-looking statements include, but are not limited to, statements
relating to the Company’s objectives, plans and strategies, statements of preliminary or projected results of operations or of financial
condition and all statements that address activities, events, or developments that the Company intends, expects, projects, believes or
anticipates will or may occur in the future. Forward-looking statements are not guarantees of future performance and are subject to risks
and uncertainties. The Company has based these forward-looking statements on assumptions and assessments made by its management in light
of their experience and their perception of historical trends, current conditions, expected future developments and other factors they
believe to be appropriate. Important factors that could cause actual results, developments and business decisions to differ materially
from those anticipated in these forward-looking statements include, among other things: the duration and severity of current adverse macro-economic
headwinds being caused by inflationary pressures and higher interest rates, which have been impacting, and may continue to impact, in
an adverse manner, the Company’s operations, financial position and cash flows, in part due to the adverse impact on the Company’s
customers and suppliers; the Company’s degree of success in developing, introducing and selling new or improved products and product
enhancements including specifically the Company’s Poly Pro and Presto products; the extent of the Company’s ability to consummate
sales to large accounts with multi-system delivery plans; the degree of the Company’s ability to fill orders for its systems; the
extent of the Company’s ability to increase sales of its systems, ink and consumables; the extent of the Company’s ability
to leverage its global infrastructure build-out; the development of the market for digital textile printing; the availability of alternative
ink; competition; sales concentration; changes to the Company’s relationships with suppliers; the extent of the Company’s
success in marketing; and those additional factors referred to under “Risk Factors” in Item 3.D of the Company’s Annual
Report on Form 20-F for the year ended December 31, 2022, filed with the SEC on March 30, 2023. Any forward-looking statements in this
press release are made as of the date hereof, whether as a result of new information, future events or otherwise, except as required by
law.
Non-GAAP Discussion Disclosure
The Company presents certain non-GAAP financial measures, in this press
release and in the accompanying conference call to discuss the Company’s quarterly results. These non-GAAP financial measures reflect
adjustments to corresponding GAAP financial measures in order to exclude the impact of the following: share-based compensation expenses;
amortization of intangible assets; acquisition related expenses; restructuring expenses; foreign exchange differences associated with
ASC 842; and non-cash deferred tax income.
The Company defines “Adjusted EBITDA” as non-GAAP operating
income (loss), which reflects the adjustments described in the preceding paragraph, as further adjusted to exclude depreciation expense.
The purpose of the foregoing non-GAAP financial measures is to convey
the Company’s performance exclusive of non-cash charges and other items that are considered by management to be outside of the Company’s
core operating results. These non-GAAP measures are among the primary factors management uses in planning for and forecasting future periods.
Furthermore, the non-GAAP measures are regularly used internally to understand, manage, and evaluate the Company’s business and
make operating decisions, and the Company believes that they are useful to investors as a consistent and comparable measure of the ongoing
performance of the Company’s business. The Company’s non-GAAP financial measures are not meant to be considered in isolation
or as a substitute for comparable GAAP measures and should be read only in conjunction with the Company’s consolidated financial
statements prepared in accordance with GAAP. Additionally, these non-GAAP financial measures may differ materially from the non-GAAP financial
measures used by other companies.
The reconciliation tables included below present a reconciliation of
our non-GAAP financial measures to the most directly comparable GAAP financial measures.
KORNIT DIGITAL LTD.
AND ITS SUBSIDIARIES
CONSOLIDATED BALANCE SHEETS
(U.S. dollars in thousands)
| | |
September 30, | | |
December 31, | |
| | |
2023 | | |
2022 | |
| | |
(Unaudited) | | |
(Audited) | |
| ASSETS | |
| | |
| |
| CURRENT ASSETS: | |
| | |
| |
| Cash and cash equivalents | |
$ | 76,288 | | |
$ | 104,597 | |
| Short-term bank deposit | |
| 220,095 | | |
| 275,033 | |
| Marketable securities | |
| 49,974 | | |
| 20,380 | |
| Trade receivables, net | |
| 93,137 | | |
| 67,360 | |
| Inventory | |
| 83,111 | | |
| 89,415 | |
| Other accounts receivable and prepaid expenses | |
| 23,506 | | |
| 22,054 | |
| Total current assets | |
| 546,111 | | |
| 578,839 | |
| | |
| | | |
| | |
| LONG-TERM ASSETS: | |
| | | |
| | |
| Marketable securities | |
| 222,285 | | |
| 245,970 | |
| Deposits and other long-term assets | |
| 8,106 | | |
| 5,927 | |
| Severance pay fund | |
| 262 | | |
| 274 | |
| Property, plant and equipment, net | |
| 55,026 | | |
| 60,463 | |
| Operating lease right-of-use assets | |
| 28,988 | | |
| 27,139 | |
| Intangible assets, net | |
| 8,165 | | |
| 9,890 | |
| Goodwill | |
| 29,164 | | |
| 29,164 | |
| Total long-term assets | |
| 351,996 | | |
| 378,827 | |
| | |
| | | |
| | |
| Total assets | |
| 898,107 | | |
| 957,666 | |
| | |
| | | |
| | |
| LIABILITIES AND SHAREHOLDERS’ EQUITY | |
| | | |
| | |
| CURRENT LIABILITIES: | |
| | | |
| | |
| Trade payables | |
| 9,626 | | |
| 14,833 | |
| Employees and payroll accruals | |
| 15,023 | | |
| 14,255 | |
| Deferred revenues and advances from customers | |
| 2,050 | | |
| 5,701 | |
| Operating lease liabilities | |
| 4,543 | | |
| 4,989 | |
| Other payables and accrued expenses | |
| 23,216 | | |
| 25,592 | |
| Total current liabilities | |
| 54,458 | | |
| 65,370 | |
| | |
| | | |
| | |
| LONG-TERM LIABILITIES: | |
| | | |
| | |
| Accrued severance pay | |
| 1,073 | | |
| 1,223 | |
| Operating lease liabilities | |
| 21,607 | | |
| 21,035 | |
| Other long-term liabilities | |
| 272 | | |
| 1,216 | |
| Total long-term liabilities | |
| 22,952 | | |
| 23,474 | |
| | |
| | | |
| | |
| SHAREHOLDERS’ EQUITY | |
| 820,697 | | |
| 868,822 | |
| | |
| | | |
| | |
| Total liabilities and shareholders’ equity | |
$ | 898,107 | | |
$ | 957,666 | |
KORNIT DIGITAL LTD.
AND ITS SUBSIDIARIES
CONSOLIDATED STATEMENTS OF OPERATIONS
(U.S. dollars in thousands, except share and per
share data)
| | |
Three Months Ended | | |
Nine Months Ended | |
| | |
September 30, | | |
September 30, | |
| | |
2023 | | |
2022 | | |
2023 | | |
2022 | |
| | |
(Unaudited) | | |
(Unaudited) | |
| | |
| | |
| | |
| | |
| |
| Revenues | |
| | |
| | |
| | |
| |
| Products | |
$ | 45,486 | | |
$ | 52,627 | | |
$ | 117,472 | | |
$ | 172,707 | |
| Services | |
| 13,738 | | |
| 14,164 | | |
| 45,729 | | |
| 35,513 | |
| Total revenues | |
| 59,224 | | |
| 66,791 | | |
| 163,201 | | |
| 208,220 | |
| | |
| | | |
| | | |
| | | |
| | |
| Cost of revenues | |
| | | |
| | | |
| | | |
| | |
| Products | |
| 25,392 | | |
| 31,789 | | |
| 68,391 | | |
| 96,909 | |
| Services | |
| 13,212 | | |
| 13,569 | | |
| 42,425 | | |
| 36,160 | |
| Total cost of revenues | |
| 38,604 | | |
| 45,358 | | |
| 110,816 | | |
| 133,069 | |
| | |
| | | |
| | | |
| | | |
| | |
| Gross profit | |
| 20,620 | | |
| 21,433 | | |
| 52,385 | | |
| 75,151 | |
| | |
| | | |
| | | |
| | | |
| | |
| Operating expenses: | |
| | | |
| | | |
| | | |
| | |
| Research and development, net | |
| 12,038 | | |
| 14,684 | | |
| 38,027 | | |
| 42,775 | |
| Sales and marketing | |
| 15,586 | | |
| 17,502 | | |
| 48,927 | | |
| 54,917 | |
| General and administrative | |
| 7,654 | | |
| 10,616 | | |
| 25,143 | | |
| 30,632 | |
| Total operating expenses | |
| 35,278 | | |
| 42,802 | | |
| 112,097 | | |
| 128,324 | |
| | |
| | | |
| | | |
| | | |
| | |
| Operating loss | |
| (14,658 | ) | |
| (21,369 | ) | |
| (59,712 | ) | |
| (53,173 | ) |
| | |
| | | |
| | | |
| | | |
| | |
| Financial income, net | |
| 6,304 | | |
| 2,207 | | |
| 18,726 | | |
| 8,330 | |
| Loss before taxes on income | |
| (8,354 | ) | |
| (19,162 | ) | |
| (40,986 | ) | |
| (44,843 | ) |
| | |
| | | |
| | | |
| | | |
| | |
| Taxes on income (tax benefit) | |
| (193 | ) | |
| (130 | ) | |
| 431 | | |
| (1,138 | ) |
| Net loss | |
$ | (8,161 | ) | |
$ | (19,032 | ) | |
$ | (41,417 | ) | |
$ | (43,705 | ) |
| | |
| | | |
| | | |
| | | |
| | |
| Basic loss per share | |
$ | (0.17 | ) | |
$ | (0.38 | ) | |
$ | (0.84 | ) | |
$ | (0.88 | ) |
| | |
| | | |
| | | |
| | | |
| | |
| Weighted average number of shares
used in computing basic net loss per share | |
| 48,968,244 | | |
| 49,834,417 | | |
| 49,469,717 | | |
| 49,750,458 | |
| | |
| | | |
| | | |
| | | |
| | |
| Diluted net loss per share | |
$ | (0.17 | ) | |
$ | (0.38 | ) | |
$ | (0.84 | ) | |
$ | (0.88 | ) |
| | |
| | | |
| | | |
| | | |
| | |
| Weighted average number of shares
used in computing diluted net loss per share | |
| 48,968,244 | | |
| 49,834,417 | | |
| 49,469,717 | | |
| 49,750,458 | |
KORNIT DIGITAL LTD.
AND ITS SUBSIDIARIES
RECONCILIATION OF GAAP TO NON-GAAP CONSOLIDATED
STATEMENTS OF OPERATIONS
(U.S. dollars in thousands, except share and per
share data)
| | |
Three Months Ended | | |
Nine Months Ended | |
| | |
September 30, | | |
September 30, | |
| | |
2023 | | |
2022 | | |
2023 | | |
2022 | |
| | |
(Unaudited) | | |
(Unaudited) | |
| | |
| | |
| | |
| | |
| |
| Revenues | |
$ | 59,224 | | |
$ | 66,791 | | |
$ | 163,201 | | |
$ | 208,220 | |
| | |
| | | |
| | | |
| | | |
| | |
| GAAP cost of revenues | |
$ | 38,604 | | |
$ | 45,358 | | |
$ | 110,816 | | |
$ | 133,069 | |
| Cost of product recorded for share-based compensation (1) | |
| (632 | ) | |
| (587 | ) | |
| (1,811 | ) | |
| (1,642 | ) |
| Cost of service recorded for share-based compensation (1) | |
| (467 | ) | |
| (422 | ) | |
| (1,311 | ) | |
| (1,268 | ) |
| Intangible assets amortization on cost of product (3) | |
| (267 | ) | |
| (744 | ) | |
| (793 | ) | |
| (1,799 | ) |
| Intangible assets amortization on cost of service (3) | |
| (160 | ) | |
| (160 | ) | |
| (480 | ) | |
| (480 | ) |
| Restructuring expenses (4) | |
| - | | |
| (396 | ) | |
| (89 | ) | |
| (396 | ) |
| Non-GAAP cost of revenues | |
$ | 37,078 | | |
$ | 43,049 | | |
$ | 106,332 | | |
$ | 127,484 | |
| | |
| | | |
| | | |
| | | |
| | |
| GAAP gross profit | |
$ | 20,620 | | |
$ | 21,433 | | |
$ | 52,385 | | |
$ | 75,151 | |
| Gross profit adjustments | |
| 1,526 | | |
| 2,309 | | |
| 4,484 | | |
| 5,585 | |
| Non-GAAP gross profit | |
$ | 22,146 | | |
$ | 23,742 | | |
$ | 56,869 | | |
$ | 80,736 | |
| | |
| | | |
| | | |
| | | |
| | |
| GAAP operating expenses | |
$ | 35,278 | | |
$ | 42,802 | | |
$ | 112,097 | | |
$ | 128,324 | |
| Share-based compensation (1) | |
| (4,050 | ) | |
| (5,646 | ) | |
| (13,822 | ) | |
| (14,524 | ) |
| Acquisition related expenses (2) | |
| - | | |
| - | | |
| - | | |
| (512 | ) |
| Intangible assets amortization (3) | |
| (117 | ) | |
| (160 | ) | |
| (457 | ) | |
| (363 | ) |
| Restructuring expenses (4) | |
| - | | |
| (281 | ) | |
| (206 | ) | |
| (281 | ) |
| Non-GAAP operating expenses | |
$ | 31,111 | | |
$ | 36,715 | | |
$ | 97,612 | | |
$ | 112,644 | |
| | |
| | | |
| | | |
| | | |
| | |
| GAAP Financial income, net | |
$ | 6,304 | | |
$ | 2,207 | | |
$ | 18,726 | | |
$ | 8,330 | |
| Foreign exchange losses associated with ASC 842 | |
| (704 | ) | |
| (279 | ) | |
| (1,201 | ) | |
| (3,408 | ) |
| Non-GAAP Financial income , net | |
$ | 5,600 | | |
$ | 1,928 | | |
$ | 17,525 | | |
$ | 4,922 | |
| | |
| | | |
| | | |
| | | |
| | |
| GAAP Taxes on income (tax benefit) | |
$ | (193 | ) | |
$ | (130 | ) | |
$ | 431 | | |
$ | (1,138 | ) |
| Non-cash deferred tax income | |
$ | 255 | | |
$ | (247 | ) | |
$ | 578 | | |
$ | 220 | |
| Non-GAAP Taxes on income (tax benefit) | |
$ | 62 | | |
$ | (377 | ) | |
$ | 1,009 | | |
$ | (918 | ) |
| | |
| | | |
| | | |
| | | |
| | |
| GAAP net loss | |
$ | (8,161 | ) | |
$ | (19,032 | ) | |
$ | (41,417 | ) | |
$ | (43,705 | ) |
| Share-based compensation (1) | |
| 5,149 | | |
| 6,655 | | |
| 16,944 | | |
| 17,434 | |
| Acquisition related expenses (2) | |
| - | | |
| - | | |
| - | | |
| 512 | |
| Intangible assets amortization (3) | |
| 544 | | |
| 1,064 | | |
| 1,730 | | |
| 2,642 | |
| Restructuring expenses (4) | |
| - | | |
| 677 | | |
| 295 | | |
| 677 | |
| Foreign exchange losses associated with ASC 842 | |
| (704 | ) | |
| (279 | ) | |
| (1,201 | ) | |
| (3,408 | ) |
| Non-cash deferred tax income | |
| (255 | ) | |
| 247 | | |
| (578 | ) | |
| (220 | ) |
| Non-GAAP net loss | |
$ | (3,427 | ) | |
$ | (10,668 | ) | |
$ | (24,227 | ) | |
$ | (26,068 | ) |
| | |
| | | |
| | | |
| | | |
| | |
| GAAP diluted loss per share | |
$ | (0.17 | ) | |
$ | (0.38 | ) | |
$ | (0.84 | ) | |
$ | (0.88 | ) |
| | |
| | | |
| | | |
| | | |
| | |
| Non-GAAP diluted loss per share | |
$ | (0.07 | ) | |
$ | (0.21 | ) | |
$ | (0.49 | ) | |
$ | (0.52 | ) |
| | |
| | | |
| | | |
| | | |
| | |
| Weighted average number of shares | |
| | | |
| | | |
| | | |
| | |
| | |
| | | |
| | | |
| | | |
| | |
| Shares used in computing GAAP diluted net loss per share | |
| 48,968,244 | | |
| 49,834,417 | | |
| 49,469,717 | | |
| 49,750,458 | |
| | |
| | | |
| | | |
| | | |
| | |
| Shares used in computing Non-GAAP diluted net loss per share | |
| 48,968,244 | | |
| 49,834,417 | | |
| 49,469,717 | | |
| 49,750,458 | |
| | |
| | | |
| | | |
| | | |
| | |
| (1) Share-based compensation | |
| | | |
| | | |
| | | |
| | |
| Cost of product revenues | |
$ | 632 | | |
$ | 587 | | |
$ | 1,811 | | |
$ | 1,642 | |
| Cost of service revenues | |
$ | 467 | | |
| 422 | | |
| 1,311 | | |
| 1,268 | |
| Research and development | |
$ | 1,478 | | |
| 1,515 | | |
| 4,430 | | |
| 3,972 | |
| Sales and marketing | |
$ | 1,747 | | |
| 2,368 | | |
| 5,054 | | |
| 5,668 | |
| General and administrative | |
$ | 825 | | |
| 1,763 | | |
| 4,338 | | |
| 4,884 | |
| | |
$ | 5,149 | | |
$ | 6,655 | | |
$ | 16,944 | | |
$ | 17,434 | |
| (2) Acquisition related expenses | |
| | | |
| | | |
| | | |
| | |
| General and administrative | |
$ | - | | |
$ | - | | |
$ | - | | |
$ | 512 | |
| | |
$ | - | | |
$ | - | | |
$ | - | | |
$ | 512 | |
| (3) Intangible assets amortization | |
| | | |
| | | |
| | | |
| | |
| Cost of product revenues | |
$ | 267 | | |
$ | 744 | | |
$ | 793 | | |
$ | 1,799 | |
| Cost of service revenues | |
$ | 160 | | |
| 160 | | |
| 480 | | |
| 480 | |
| Sales and marketing | |
$ | 117 | | |
| 160 | | |
| 457 | | |
| 363 | |
| | |
$ | 544 | | |
$ | 1,064 | | |
$ | 1,730 | | |
$ | 2,642 | |
| | |
| | | |
| | | |
| | | |
| | |
| (4) Restructuring expenses | |
| | | |
| | | |
| | | |
| | |
| Cost of product revenues | |
$ | - | | |
$ | 384 | | |
$ | 89 | | |
$ | 384 | |
| Cost of service revenues | |
$ | - | | |
$ | 12 | | |
$ | - | | |
$ | 12 | |
| Research and development | |
$ | - | | |
| 64 | | |
| 20 | | |
| 64 | |
| Sales and marketing | |
$ | - | | |
| 188 | | |
| 186 | | |
| 188 | |
| General and administrative | |
$ | - | | |
| 29 | | |
| - | | |
| 29 | |
| | |
$ | - | | |
$ | 677 | | |
$ | 295 | | |
$ | 677 | |
KORNIT DIGITAL LTD.
AND ITS SUBSIDIARIES
CONSOLIDATED STATEMENTS OF CASH FLOWS
(U.S. dollars in thousands)
| | |
Three Months Ended | | |
Nine Months Ended | |
| | |
September 30, | | |
September 30, | |
| | |
2023 | | |
2022 | | |
2023 | | |
2022 | |
| | |
(Unaudited) | | |
(Unaudited) | |
| Cash flows from operating activities: | |
| | |
| | |
| | |
| |
| | |
| | |
| | |
| | |
| |
| Net loss | |
$ | (8,161 | ) | |
$ | (19,032 | ) | |
$ | (41,417 | ) | |
$ | (43,705 | ) |
| Adjustments to reconcile net loss to net cash used in operating activities: | |
| | | |
| | | |
| | | |
| | |
| Depreciation and amortization | |
| 3,886 | | |
| 3,264 | | |
| 11,413 | | |
| 9,166 | |
| Fair value of warrants deducted from revenues | |
| 3,325 | | |
| 5,640 | | |
| 9,001 | | |
| 18,161 | |
| Share-based compensation | |
| 5,149 | | |
| 6,655 | | |
| 16,944 | | |
| 17,434 | |
| Amortization of premium and accretion of discount on marketable securities, net | |
| 148 | | |
| 435 | | |
| 673 | | |
| 1,447 | |
| Realized gain on sale and redemption of marketable securities | |
| 44 | | |
| - | | |
| 41 | | |
| 10 | |
| Change in operating assets and liabilities: | |
| | | |
| | | |
| | | |
| | |
| Trade receivables, net | |
| (8,921 | ) | |
| (3,214 | ) | |
| (25,777 | ) | |
| (12,218 | ) |
| Other accounts receivables and prepaid expenses | |
| (686 | ) | |
| (4,343 | ) | |
| (1,452 | ) | |
| (6,134 | ) |
| Inventory | |
| 4,567 | | |
| (2,715 | ) | |
| 6,507 | | |
| (26,567 | ) |
| Operating leases right-of-use assets and liabilities, net | |
| (711 | ) | |
| (290 | ) | |
| (1,723 | ) | |
| (3,147 | ) |
| Deferred taxes | |
| - | | |
| (577 | ) | |
| - | | |
| (2,993 | ) |
| Deposits and other long term assets | |
| (301 | ) | |
| (1,071 | ) | |
| (2,179 | ) | |
| (2,392 | ) |
| Trade payables | |
| (1,887 | ) | |
| (5,960 | ) | |
| (3,589 | ) | |
| (17,880 | ) |
| Employees and payroll accruals | |
| (1,284 | ) | |
| 1,382 | | |
| 1,205 | | |
| (5,452 | ) |
| Deferred revenues and advances from customers | |
| (414 | ) | |
| 2,581 | | |
| (3,651 | ) | |
| (1,533 | ) |
| Other payables and accrued expenses | |
| (2,152 | ) | |
| 12,623 | | |
| (2,190 | ) | |
| 16,063 | |
| Accrued severance pay, net | |
| (76 | ) | |
| 12 | | |
| (138 | ) | |
| (280 | ) |
| Other long - term liabilities | |
| (254 | ) | |
| (1,046 | ) | |
| (944 | ) | |
| (317 | ) |
| Loss from sale and disposal of property, plant and equipment | |
| - | | |
| 526 | | |
| - | | |
| 567 | |
| Net cash used in operating activities | |
$ | (7,728 | ) | |
$ | (5,130 | ) | |
$ | (37,276 | ) | |
$ | (59,770 | ) |
| | |
| | | |
| | | |
| | | |
| | |
| Cash flows from investing activities: | |
| | | |
| | | |
| | | |
| | |
| | |
| | | |
| | | |
| | | |
| | |
| Purchase of property, plant and equipment | |
$ | (1,003 | ) | |
$ | (2,819 | ) | |
$ | (6,072 | ) | |
$ | (12,266 | ) |
| Investment in equity securities | |
| - | | |
| (273 | ) | |
| - | | |
| (627 | ) |
| Acquisition of intangible assets | |
| - | | |
| (102 | ) | |
| - | | |
| (235 | ) |
| Proceeds from sale of property, plant and equipment | |
| - | | |
| 16 | | |
| - | | |
| 71 | |
| Cash paid in connection with acquisition, net of cash acquired | |
| - | | |
| - | | |
| - | | |
| (14,654 | ) |
| Proceeds from (investment in) short-term bank deposits, net | |
| 3 | | |
| (100,059 | ) | |
| 54,938 | | |
| (350,954 | ) |
| Proceeds from sales and redemption of marketable securities | |
| 1,990 | | |
| - | | |
| 7,240 | | |
| 1,945 | |
| Proceeds from maturities of marketable securities | |
| 2,970 | | |
| 3,976 | | |
| 14,222 | | |
| 21,398 | |
| Investment in marketable securities | |
| (5,516 | ) | |
| (25,468 | ) | |
| (24,451 | ) | |
| (129,365 | ) |
| Net cash provided by (used in) investing activities | |
$ | (1,556 | ) | |
$ | (124,729 | ) | |
$ | 45,877 | | |
$ | (484,687 | ) |
| | |
| | | |
| | | |
| | | |
| | |
| Cash flows from financing activities: | |
| | | |
| | | |
| | | |
| | |
| | |
| | | |
| | | |
| | | |
| | |
| Exercise of employee stock options | |
$ | 198 | | |
$ | 120 | | |
$ | 293 | | |
$ | 460 | |
| Payments related to shares withheld for taxes | |
| - | | |
| (179 | ) | |
| (437 | ) | |
| (861 | ) |
| Repurchase of ordinary shares | |
| (15,948 | ) | |
| - | | |
| (36,766 | ) | |
| - | |
| Net cash used in financing activities | |
$ | (15,750 | ) | |
$ | (59 | ) | |
$ | (36,910 | ) | |
$ | (401 | ) |
| | |
| | | |
| | | |
| | | |
| | |
| Decrease in cash and cash equivalents | |
$ | (25,034 | ) | |
$ | (129,918 | ) | |
$ | (28,309 | ) | |
$ | (544,858 | ) |
| Cash and cash equivalents at the beginning of the period | |
| 101,322 | | |
| 196,611 | | |
| 104,597 | | |
| 611,551 | |
| Cash and cash equivalents at the end of the period | |
$ | 76,288 | | |
$ | 66,693 | | |
$ | 76,288 | | |
$ | 66,693 | |
| | |
| | | |
| | | |
| | | |
| | |
| Non-cash investing and financing activities: | |
| | | |
| | | |
| | | |
| | |
| | |
| | | |
| | | |
| | | |
| | |
| Purchase of property and equipment on credit | |
| 74 | | |
| 1,033 | | |
| 74 | | |
| 1,033 | |
| Inventory transferred to be used as property and equipment | |
| 531 | | |
| 255 | | |
| 531 | | |
| 1,544 | |
| Property, plant and equipment transferred to be used as inventory | |
| - | | |
| 183 | | |
| 734 | | |
| 192 | |
| Lease liabilities arising from obtaining right-of-use assets | |
| 322 | | |
| 790 | | |
| 5,809 | | |
| 7,177 | |
KORNIT DIGITAL LTD.
AND ITS SUBSIDIARIES
RECONCILIATION OF GAAP NET INCOME TO ADJUSTED
EBITDA
(U.S. dollars in thousands, except share and per
share data)
| | |
Three Months Ended | | |
Nine Months Ended | |
| | |
September 30, | | |
September 30, | |
| | |
2023 | | |
2022 | | |
2023 | | |
2022 | |
| | |
(Unaudited) | | |
(Unaudited) | |
| | |
| | |
| | |
| | |
| |
| GAAP Revenues | |
$ | 59,224 | | |
$ | 66,791 | | |
$ | 163,201 | | |
$ | 208,220 | |
| | |
| | | |
| | | |
| | | |
| | |
| GAAP Net Loss | |
| (8,161 | ) | |
| (19,032 | ) | |
| (41,417 | ) | |
| (43,705 | ) |
| Taxes on income | |
| (193 | ) | |
| (130 | ) | |
| 431 | | |
| (1,138 | ) |
| Financial income | |
| (6,304 | ) | |
| (2,207 | ) | |
| (18,726 | ) | |
| (8,330 | ) |
| Share-based compensation | |
| 5,149 | | |
| 6,655 | | |
| 16,944 | | |
| 17,434 | |
| Intangible assets amortization | |
| 544 | | |
| 770 | | |
| 1,730 | | |
| 1,979 | |
| Acquisition related expenses | |
| - | | |
| - | | |
| - | | |
| 512 | |
| Excess cost of product on acquired inventory | |
| - | | |
| 294 | | |
| - | | |
| 663 | |
| Restructuring expenses | |
| - | | |
| 677 | | |
| 295 | | |
| 677 | |
| Non-GAAP Operating Loss | |
| (8,965 | ) | |
| (12,973 | ) | |
| (40,743 | ) | |
| (31,908 | ) |
| Depreciation | |
| 3,342 | | |
| 2,494 | | |
| 9,683 | | |
| 7,187 | |
| Adjusted EBITDA | |
$ | (5,623 | ) | |
$ | (10,479 | ) | |
$ | (31,060 | ) | |
$ | (24,721 | ) |
8
Exhibit 99.2

©2023 Kornit Digital. All rights reserved. KORNIT DIGITAL (NASDAQ: KRNT) Third Quarter 2023 Earnings Conference Call Supporting Slides November 8, 2023

ON TODAY’S CALL Ronen Samuel CEO Lauri Hanover CFO Amir Shaked Mandel EVP Corp Dev Jared Maymon Global Head of IR 2 ©2023 Kornit Digital. All rights reserved.

SAFE HARBOR 3 ©2023 Kornit Digital. All rights reserved. This presentation contains “forward - looking statements” within the meaning of the Private Securities Litigation Reform Act of 1995 and other U . S . securities laws . Forward - looking statements are characterized by the use of forward - looking terminology such as “will,” “expects,” “anticipates,” “continue,” “believes,” “should,” “intended,” “guidance,” “preliminary,” “future,” “planned,” or other words . These forward - looking statements include, but are not limited to, statements relating to the Company’s objectives, plans and strategies, statements of preliminary or projected results of operations or of financial condition and all statements that address activities, events, or developments that the Company intends, expects, projects, believes or anticipates will or may occur in the future . Forward - looking statements are not guarantees of future performance and are subject to risks and uncertainties . The Company has based these forward - looking statements on assumptions and assessments made by its management in light of their experience and their perception of historical trends, current conditions, expected future developments and other factors they believe to be appropriate . Important factors that could cause actual results, developments and business decisions to differ materially from those anticipated in these forward - looking statements include, among other things : the duration and severity of current adverse macro - economic headwinds being caused by inflationary pressures and higher interest rates, which have been impacting, and may continue to impact, in an adverse manner, the Company’s operations, financial position and cash flows, in part due to the adverse impact on the Company’s customers and suppliers ; the Company’s degree of success in developing, introducing and selling new or improved products and product enhancements including specifically the Company’s Poly Pro and Presto products ; the extent of the Company’s ability to consummate sales to large accounts with multi - system delivery plans ; the degree of the Company’s ability to fill orders for its systems ; the extent of the Company’s ability to increase sales of its systems, ink and consumables ; the extent of the Company’s ability to leverage its global infrastructure build - out ; the development of the market for digital textile printing ; the availability of alternative ink ; competition ; sales concentration ; changes to the Company’s relationships with suppliers ; the extent of the Company’s success in marketing ; and those additional factors referred to under “Risk Factors” in Item 3 . D of the Company’s Annual Report on Form 20 - F for the year ended December 31 , 2022 , filed with the SEC on March 30 , 2023 . Any forward - looking statements in this press release are made as of the date hereof, whether as a result of new information, future events or otherwise, except as required by law . In addition to U . S . GAAP financials, this presentation includes certain non - GAAP financial measures . These non - GAAP financial measures are in addition to, and not a substitute for or superior to, measures of financial performance prepared in accordance with U . S . GAAP . Please see the reconciliation table that appears among the financial tables in our earnings release being issued today, which earnings release is attached as Exhibit 99 . 1 to our report of foreign private issuer on Form 6 - K being furnished to the SEC today, which reconciliation table is incorporated by reference in this presentation . This presentation contains statistical data that we obtained from industry publications and reports generated by third parties . Although we believe that the publications and reports are reliable, we have not independently verified this statistical data . Kornit, Kornit Digital, the K logo, and NeoPigment are trademarks of Kornit Digital Ltd . All other trademarks are the property of their respective owners and are used for reference purposes only . Such use should not be construed as an endorsement of our products or services .

BUSINESS HIGHLIGHTS 4 ©2023 Kornit Digital. All rights reserved. Ronen Samuel Chief Executive Officer

UPDATE ON SITUATION IN ISRAEL 5 ©2023 Kornit Digital. All rights reserved. • Committed to the safety, security, and wellbeing of our teams in Israel • Emphasized to customers our commitment to continuity and to expect no disruption in interactions with us • As of today, the situation in Israel has not materially impacted our business • Strategically bolstered our regional inventories to meet customer demands, not just for the upcoming peak season, but also for the first quarter of 2024

THIRD QUARTER - RECAP 6 ©2023 Kornit Digital. All rights reserved. • Total third quarter revenues of $59.2 million, within guidance range provided in August • As a reminder, revenues include the impact from the fair value of issued warrants • We continued to see consumables sales growth • Impressions also increased year - over - year, marking our third consecutive quarter of growth • We anticipate continued growth in both impressions and consumables sales in the fourth quarter of 2023 and in 2024 • Macroeconomic challenges have continued into the second half of 2023, constraining system sales as expected • System sales improved sequentially as we continued to convert orders from ITMA
BUSINESS DYNAMICS & TRENDS 7 ©2023 Kornit Digital. All rights reserved. • Continued to focus on: • Diversifying customer base • Selling to new customers in key growth regions, including LATAM & APAC • Accelerating growth into market segments like screen replacement and retail • Encouraged to see new key customers leverage our technology in emerging applications, which we believe can generate meaningful growth for our systems and ink • Continue to see growth in our direct - to - fabric technology; the third quarter was one of the strongest for Presto sales • Saw additional MAX upgrades in the third quarter, and we anticipate upgrade momentum to resume in 2024 • Seeing strong interest for the Atlas MAX Poly system in the sports and athleisure market; built additional momentum for this solution in October at the PRINTING United Expo in Atlanta
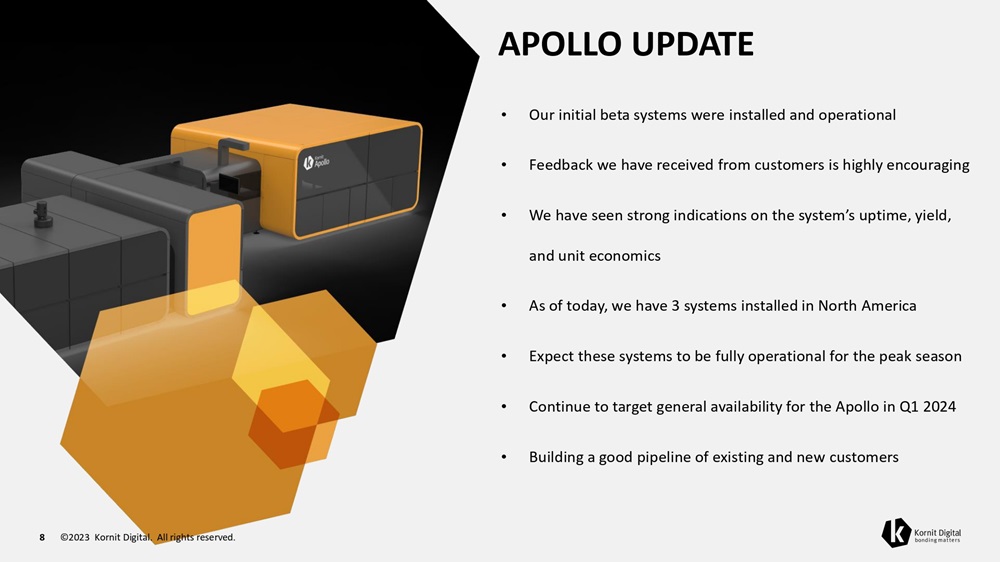
APOLLO UPDATE 8 ©2023 Kornit Digital. All rights reserved. • Our initial beta systems were installed and operational • Feedback we have received from customers is highly encouraging • We have seen strong indications on the system’s uptime, yield, and unit economics • As of today, we have 3 systems installed in North America • Expect these systems to be fully operational for the peak season • Continue to target general availability for the Apollo in Q1 2024 • Building a good pipeline of existing and new customers

CONTINUED PROGRESS TOWARDS APPROACHING BREAKEVEN 9 ©2023 Kornit Digital. All rights reserved. • In Q3, we saw a continuation of macroeconomic headwinds, despite this we were able to: • Further diversify our customer base • Expand into key textile producing regions • Pursue growth opportunities in new applications • Continue to take proactive measure to resume sales growth • Focusing on enhancing operating efficiencies across the entire company • Plan to approach breakeven on an adjusted EBITDA basis during Q4 2023 and profitable growth for the full year in 2024

FINANCIAL HIGHLIGHTS 10 ©2023 Kornit Digital. All rights reserved. Lauri Hanover Chief Financial Officer

REVENUES • Q3 2023 revenues of $59.2 million in line with the guidance range of $58 million to $62 million provided in August • Consumables revenues grew both year - over - year and sequentially • Services revenue declined slightly year - over - year • System sales drove the year - over - year decline in total revenues, but were much improved sequentially 11 ©2023 Kornit Digital. All rights reserved.

REGIONAL OVERVIEW • Americas: • Growth was driven by strong system sales in Latin America following ITMA • EMEA: • Consumables revenue grew as utilization rose, and upgrades to MAX continued • Asia Pacific: • Revenues were flat compared to the same period last year • Continue to develop a meaningful pipeline of long - term growth opportunities in this region 12 ©2023 Kornit Digital. All rights reserved.
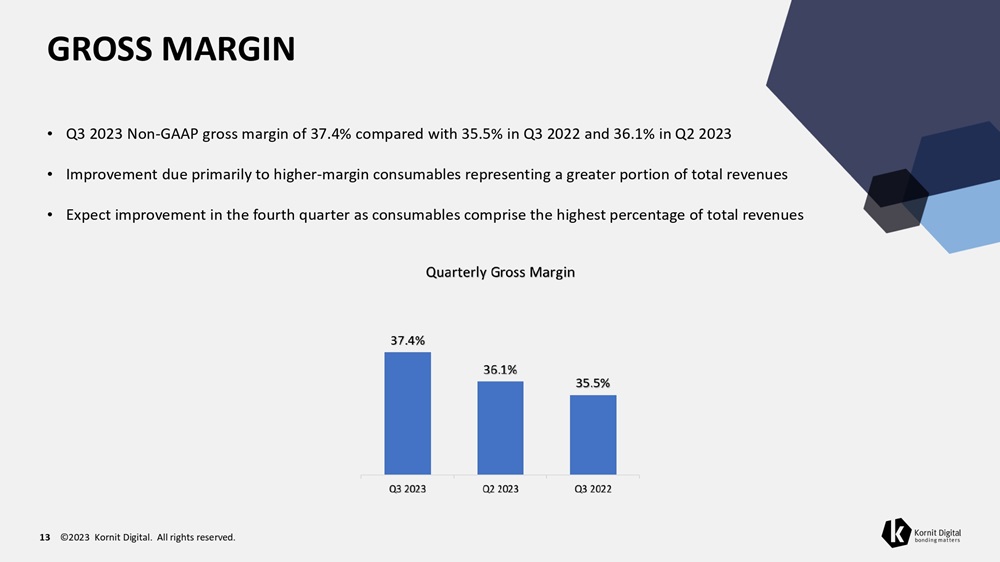
GROSS MARGIN • Q3 2023 Non - GAAP gross margin of 37.4% compared with 35.5% in Q3 2022 and 36.1% in Q2 2023 • Improvement due primarily to higher - margin consumables representing a greater portion of total revenues • Expect improvement in the fourth quarter as consumables comprise the highest percentage of total revenues 13 ©2023 Kornit Digital. All rights reserved.

OPERATING EXPENSES 14 ©2023 Kornit Digital. All rights reserved. • Q3 2023 Non - GAAP Operating Expenses: $31.1 million, down from $36.7 million in Q3 2022 • The year - over - year decrease of ~15% primarily reflects: • Savings realized from our previously completed workforce reductions • Reduced marketing spend Non - GAAP Operating Expenses $ in millions Q3 2022 Q3 2023 $13.1 $10.6 Research & Development $14.8 $13.7 Sales & Marketing $8.8 $6.8 General & Administrative $36.7 $31.1 Total Operating Expenses
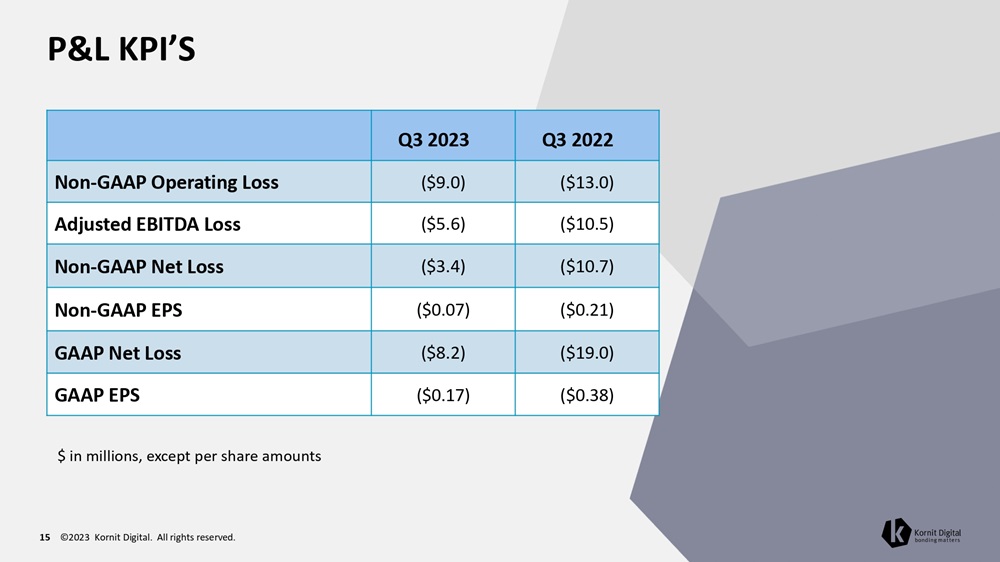
P&L KPI’S 15 ©2023 Kornit Digital. All rights reserved. Q3 2022 Q3 2023 ($13.0) ($9.0) Non - GAAP Operating Loss ($10.5) ($5.6) Adjusted EBITDA Loss ($10.7) ($3.4) Non - GAAP Net Loss ($0.21) ($0.07) Non - GAAP EPS ($19.0) ($8.2) GAAP Net Loss ($0.38) ($0.17) GAAP EPS $ in millions, except per share amounts
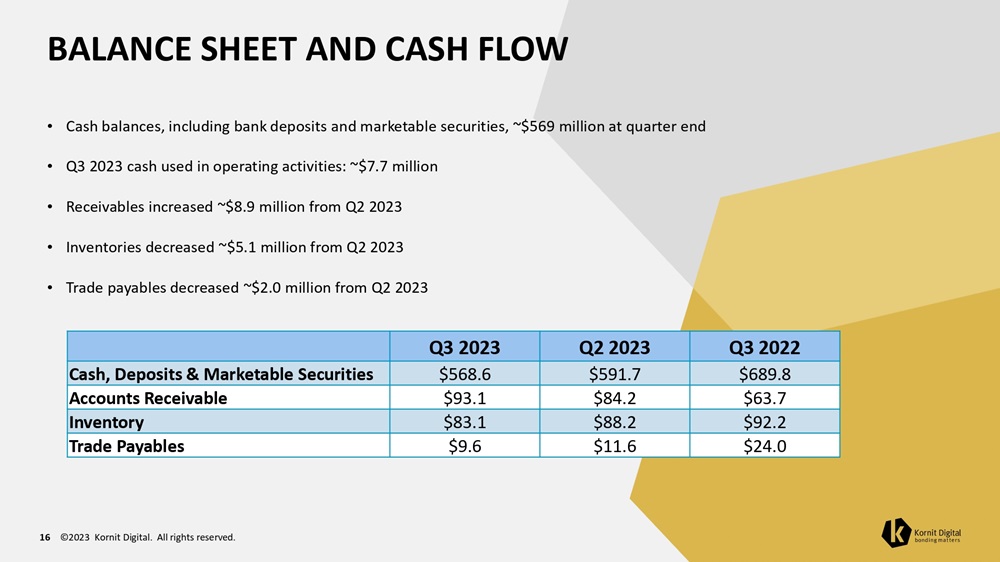
BALANCE SHEET AND CASH FLOW 16 ©2023 Kornit Digital. All rights reserved. • Cash balances, including bank deposits and marketable securities, ~$569 million at quarter end • Q3 2023 cash used in operating activities: ~$7.7 million • Receivables increased ~$8.9 million from Q2 2023 • Inventories decreased ~$5.1 million from Q2 2023 • Trade payables decreased ~$2.0 million from Q2 2023 Q3 2022 Q2 2023 Q3 2023 $689.8 $591.7 $568.6 Cash, Deposits & Marketable Securities $63.7 $84.2 $93.1 Accounts Receivable $92.2 $88.2 $83.1 Inventory $24.0 $11.6 $9.6 Trade Payables
SHARE REPURCHASE PROGRAM UPDATE 17 ©2023 Kornit Digital. All rights reserved. • Repurchased a total of ~1.6 million shares for ~$36.8 million since the beginning of 2023 • Average price of ~$22.97 per share • Unused balance of our previously announced share repurchase program is ~$38 million • Plan to be more aggressive in repurchasing efforts given our current enterprise value

FOURTH QUARTER 2023 GUIDANCE 18 ©2023 Kornit Digital. All rights reserved. • Revenues: • Expect fourth quarter revenues to be in range of $55 million to $60 million, net of warrants impact • Adjusted EBITDA Margins: • Expect fourth quarter adjusted EBITDA margin in range of negative 6% to 0% of revenue, net of warrants impact
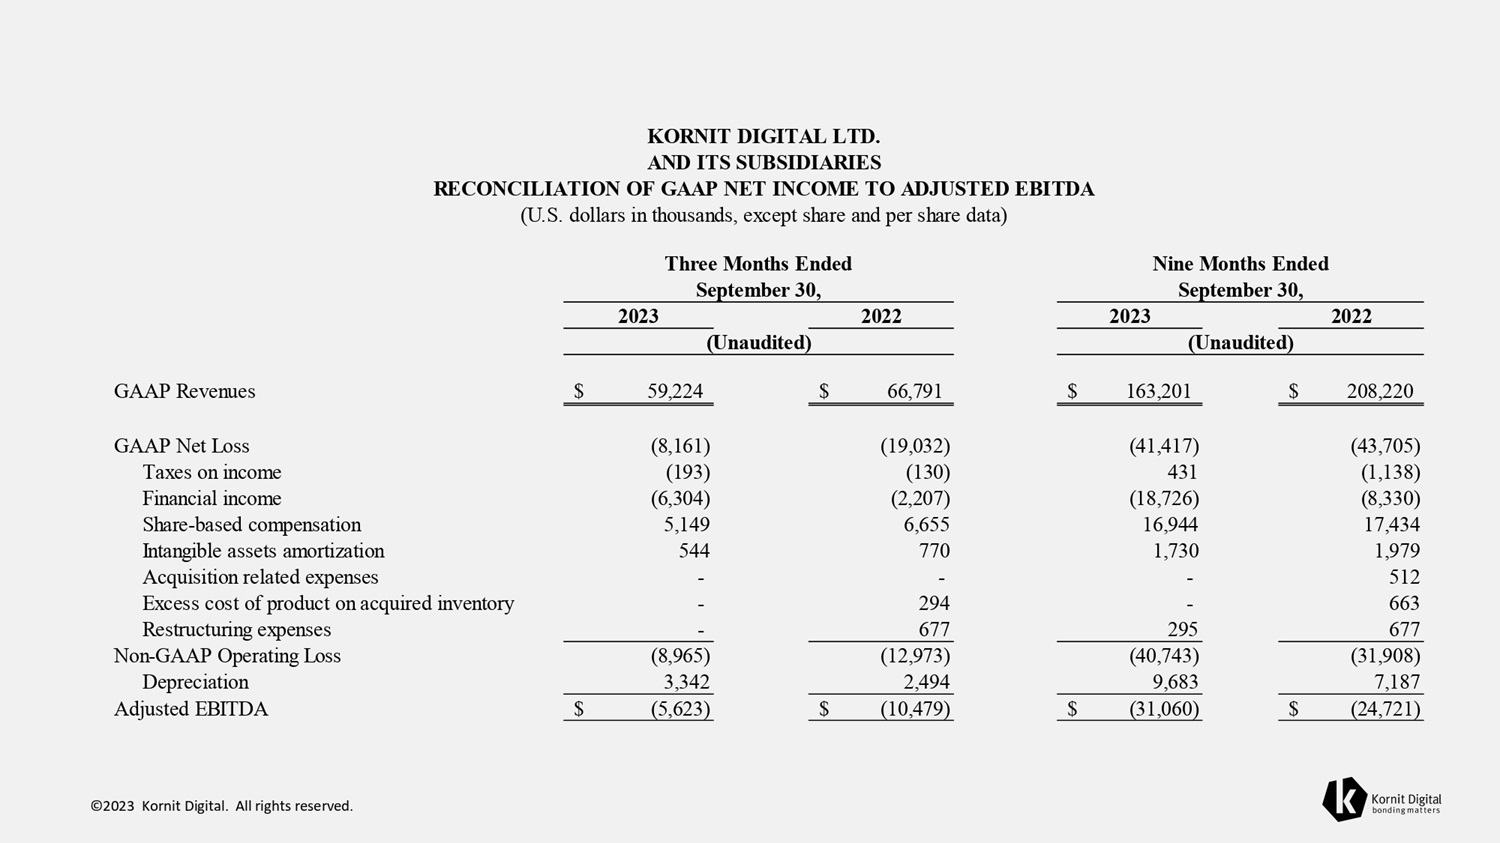
©2023 Kornit Digital. All rights reserved. $ 208,220 $ 163,201 $ 66,791 $ 59,224 GAAP Revenues (43,705) (41,417) (19,032) (8,161) GAAP Net Loss (1,138) 431 (130) (193) Taxes on income (8,330) (18,726) (2,207) (6,304) Financial income 17,434 16,944 6,655 5,149 Share - based compensation 1,979 1,730 770 544 Intangible assets amortization 512 - - - Acquisition related expenses 663 - 294 - Excess cost of product on acquired inventory 677 295 677 - Restructuring expenses (31,908) (40,743) (12,973) (8,965) Non - GAAP Operating Loss 7,187 9,683 2,494 3,342 Depreciation $ (24,721) $ (31,060) $ (10,479) $ (5,623) Adjusted EBITDA KORNIT DIGITAL LTD. AND ITS SUBSIDIARIES RECONCILIATION OF GAAP NET INCOME TO ADJUSTED EBITDA (U.S. dollars in thousands, except share and per share data) Three Months Ended September 30, 2023 2022 (Unaudited) Nine Months Ended September 30, 2023 2022 (Unaudited)

©2023 Kornit Digital. All rights reserved. TNX
Kornit Digital (NASDAQ:KRNT)
Historical Stock Chart
From Aug 2024 to Sep 2024

Kornit Digital (NASDAQ:KRNT)
Historical Stock Chart
From Sep 2023 to Sep 2024
