ICOP Digital, Inc. (NASDAQ: ICOP), an industry-leading company
engaged in advancing digital surveillance technology solutions,
announced today its financial and operational results for the three
months ended September 30, 2010. The Company will host a conference
call today at 4:15 PM EST to discuss the results, and plans to file
its 10-Q on Friday, November 12, 2010. The call can be accessed
through the Company's website, www.ICOP.com. The live audio
presentation can be accessed by dialing toll free at 877-315-9024.
Key Operational
Highlights
- ICOP recorded the second highest revenues in more than 12
months, for the third quarter of 2010.
- Domestic sales increased 18% over the same nine (9) month
period in 2009.
- The Company recently participated in the 117th Annual
International Association of Chiefs of Police (IACP) Conference in
Orlando, Florida where new products and features were showcased
including a .0004 lux night vision camera, ICOP's "DP2 Integration"
product, to manage backend video for legacy units (vendor no longer
in business), new industry-leading high-speed wireless upload
capabilities and solid state hard drives.
- ICOP received an initial order to deploy ICOP Model 20/20-W®
mobile video systems to 11 Air Force Bases in the Southern US,
stretching from Arizona to Florida.
- Purchasing contracts were announced for the State of Montana,
and a cooperative purchasing contract in New Jersey.
- The Company announced an initial order for 104 ICOP Model
20/20-W systems from the US Department of Homeland Security that
have been deployed at all land-based points of entry on the
Southwest border between the United States and Mexico, including at
the US Border Patrol driver training school for use in training
pursuit officers.
- In July, ICOP was notified by The Nasdaq Stock Market LLC that
the Company met the requirements of the March 24, 2010 decision of
the Listing Qualifications Panel of The NASDAQ Stock Market LLC
(the "Panel"), and that the Panel has determined to continue the
listing of the Company's securities on The NASDAQ Stock
Market.
- As a result of the resignation of one of the independent
directors on September 23, 2010, the Company needs to appoint one
additional independent director no later than our 2011 shareholder
meeting in order to comply with NASDAQ Listing rules. The Company
is interviewing candidates and expects to meet this schedule.
- On November 1, 2010, the Company agreed to settle the
litigation brought against it by two institutional investors. The
terms of the non- cash settlement include the surrender of the
investors' Series 1 Warrants, the Company's issuance of an
aggregate of 600,000 shares of unregistered common stock to the
investors, and a mutual release of all claims. The common stock is
being issued in reliance on the exemption from registration in
Section 3(a)(10) of the Securities Act. The settlement is subject
to the approval of the Court. A $1 million non-cash settlement
expense was recorded in the third quarter of 2010.
Financial highlights for
the three months ended September 30, 2010:
- Revenues increased to $2.6 million, a 31% increase compared to
third quarter revenues of $1.9 million reported in 2009.
- Gross margin for the third quarter of 2010 was 42.3%, compared
to 39.7%, for the same period in 2009, primarily due to higher cost
of goods sold for 2009 due to our summer special program which
offered promotional items that were expensed to cost of goods
sold.
- Operating expenses in the third quarter 2010 totaled $1.9
million compared to $2.1 million for 2009, a decrease of 10%. The
decrease is mainly due to the decline in depreciation, stock based
compensation and promotional expenses. Overall operating expenses
as a percentage of sales decreased from 110.4% in 2009 to 75.4% for
the three months ended September 30, 2010.
- Operating loss for the three month period year over year
increased $557 thousand, approximately 40%, primarily due to the $1
million recorded for potential non-cash settlement in the Financing
Transaction Litigation.
Financial highlights for
the nine months ended September 30, 2010:
- Revenues increased to $6.3 million, a 9% increase compared to
$5.8 million reported in 2009.
- Gross margin for 2010 was 42.1%, compared to 46.8%, for the
same period in 2009, primarily due to higher cost of goods sold for
2010 which is attributable to increased sales for certain products
having a lower margin. The decline is also due to higher margins in
2009 for certain markets along with the result of the cost of
inventory being higher in 2010 as a result of unfavorable foreign
currency movements in the U.S. Dollar compared to the Japanese
Yen.
- Operating expenses were $6.3 million and $6.4 million for the
nine months ended September 30, 2010 and 2009, respectively, a
decrease of $91 thousand (1%). Overall operating expenses as a
percentage of sales decreased from 110.0% in 2009 to 99.9% for the
nine months ended September 30, 2010. This decrease is mainly due
to lower stock based compensation, research and development, and
depreciation expense offset by increased travel costs. The increase
in travel costs is attributed to trade events, activities relating
to a recently formed client services team and greater focus on
direct sales.
- Operating loss for the nine month period year over year
increased $1.1 million, approximately 30%, primarily due to the $1
million recorded for potential non-cash settlement in the Financing
Transaction Litigation.
On September 30, 2010, we had $192 thousand in cash, $2.2
million in accounts receivable, $2.5 million in inventory, $410
thousand in prepaid expenses and other current assets and $2.9
million in current liabilities, for a net working capital of $2.4
million.
About ICOP Digital, Inc.
ICOP Digital, Inc. (NASDAQ: ICOP) is a leading provider of
mobile video solutions (i.e. in-car video) for Law Enforcement,
Military, and Homeland Security markets, worldwide. ICOP solutions
help the public and private sectors mitigate risks, reduce losses,
and improve security through the live streaming, capture and secure
management of high quality video and audio. www.ICOP.com
                            ICOP Digital, Inc.
                   Condensed Balance Sheets - Unaudited

                                              September 30,  December 31,
                                                  2010           2009
                                              -------------  -------------
Assets
Current assets:
 Cash and cash equivalents                    $     191,778  $   1,171,943
 Accounts receivable, net of allowances of
  $100,457 at September 30, 2010
  and December 31, 2009                           2,210,761      2,009,591
 Inventory, at lower of cost or market            2,502,183      2,094,168
 Prepaid Expenses                                   112,086         98,351
 Other Assets                                       297,820      1,759,004
                                              -------------  -------------
   Total current assets                           5,314,628      7,133,057


Property and equipment, net of accumulated
 depreciation $1,614,010 and $1,411,988 at
 September 30, 2010 and December 31, 2009,
 respectively                                     1,242,093      1,463,765

Other assets:
 Deferred patent costs                              102,362         95,906
 Investment, at cost                                 25,000         25,000
 Security deposit                                    17,500         18,258
                                              -------------  -------------
Total other assets                                  144,862        139,164

                                              -------------  -------------
Total assets                                  $   6,701,583  $   8,735,986
                                              =============  =============


Liabilities and Shareholders' Equity
Current liabilities:
 Accounts payable                             $     400,311  $     370,998
 Accrued liabilities                                524,396        476,761
 Notes payable                                      479,985        629,985
 Due to factor                                    1,269,588        686,965
 Unearned revenue - current portion                 256,807        233,175
                                              -------------  -------------
  Total current liabilities                       2,931,087      2,397,884

Other liabilities:
 Unearned revenue - long term portion               382,420        420,009

 Contingency                                      1,038,000              -

Shareholders' equity:
 Preferred stock, no par value; 5,000,000
  shares authorized, no shares issued
  and outstanding at September 30, 2010 and
  December 31, 2009                                       -              -
 Common stock, no par value; 50,000,000
  shares authorized, 2,722,795 and  2,360,294
  issued and outstanding at September 30,
  2010 and December 31, 2009, respectively       37,755,171     36,469,313
 Accumulated other comprehensive income               3,465          3,465
 Retained deficit                               (35,408,560)   (30,554,685)
                                              -------------  -------------
  Total shareholders' equity                      2,350,076      5,918,093

                                              -------------  -------------
Total liabilities and shareholders' equity    $   6,701,583  $   8,735,986
                                              =============  =============


                            ICOP Digital, Inc.
              Condensed Statement of Operations - Unaudited

                           Three Months Ended         Nine Months Ended
                              September 30,             September 30,
                        ------------------------  ------------------------
                            2010         2009         2010         2009
                        -----------  -----------  -----------  -----------
Sales, net of returns
 and allowances         $ 2,555,114  $ 1,945,231  $ 6,291,336  $ 5,795,227
Cost of sales             1,475,112    1,173,137    3,644,259    3,084,130
                        -----------  -----------  -----------  -----------
      Gross profit        1,080,002      772,094    2,647,077    2,711,097
Operating expenses:
   Selling, general and
    administrative        1,724,032    1,950,190    5,729,731    5,776,993
   Research and
    development             203,714      196,641      553,443      597,539
                        -----------  -----------  -----------  -----------
      Total operating
       expenses           1,927,746    2,146,831    6,283,174    6,374,532
                        -----------  -----------  -----------  -----------
Operating loss             (847,744)  (1,374,737)  (3,636,097)  (3,663,435)
Other income (expense):
 Contingency settlement  (1,038,000)           -   (1,038,000)           -
 Gain on derecognition
  of liabilities                  -            -            -       52,765
 Gain/(Loss) on
  disposal of property
  and equipment              (2,875)       4,537       (2,472)      (2,109)
 Interest income                 18           25           65           61
 Loss on extended
  warranties                      -         (599)           -       (1,944)
 Interest expense           (70,666)     (43,555)    (184,300)    (140,908)
 Other income                 1,400       13,878        6,929       22,574
                        -----------  -----------  -----------  -----------
  Loss before income
   taxes                 (1,957,867)  (1,400,451)  (4,853,875)  (3,732,996)
Income tax provision              -            -            -            -
                        -----------  -----------  -----------  -----------
  Net Loss              $(1,957,867) $(1,400,451) $(4,853,875) $(3,732,996)
                        ===========  ===========  ===========  ===========
Basic and diluted net
 loss per share         $     (0.83) $     (0.85) $     (1.81) $     (3.35)
                        ===========  ===========  ===========  ===========
Basic and diluted
 weighted average
 common shares
 outstanding              2,362,180    1,641,430    2,674,941    1,114,656
Forward-Looking Statements
This document contains forward-looking statements. You should
not rely on forward-looking statements because they are subject to
uncertainties and factors relating to our operations and business
environment, all of which are difficult to predict and many of
which are beyond our control. The Company may experience
significant fluctuations in future operating results due to a
number of economic, competitive, and other factors, including,
among other things, our ability to continue as a going concern, our
history of losses and negative cash flow, our need for additional
capital to acquire inventory, support operations, and capitalize on
opportunities and our reliance on third-party manufacturers and
suppliers, government agency budgetary and political constraints,
new or increased competition, changes in market demand, and the
performance or reliability of our products. This, plus other
uncertainties and factors described in our most-recent annual
report and our most-recent prospectus filed with the Securities and
Exchange Commission, could materially affect the Company and our
operations. These documents are available electronically without
charge at www.sec.gov.
Add to Digg Bookmark with del.icio.us Add to Newsvine
For more information, contact: Melissa K. Owen Dir. of
Communications 16801 West 116th Street Lenexa, KS 66219 USA Phone:
(913) 338-5550 Fax: (913) 312-0264 Email Contact www.ICOP.com For
Investor Relations: DC Consulting, LLC Daniel Conway Chief
Executive Officer Phone: (407) 792-3332 Email Contact Email
Contact
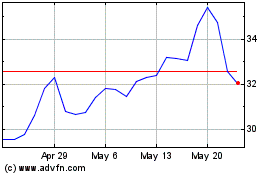
iShares Copper and Metal... (NASDAQ:ICOP)
Historical Stock Chart
From Feb 2025 to Mar 2025

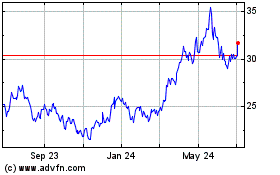
iShares Copper and Metal... (NASDAQ:ICOP)
Historical Stock Chart
From Mar 2024 to Mar 2025
