Forward Industries, Inc. (NASDAQ:FORD), a designer and
distributor of custom carry and protective solutions, today
announced financial results for its fiscal year ended September 30,
2011.
Fiscal 2011 Financial Results – Compared to fiscal
2010:
- Net sales increased $3.8 million, or
20%, to $22.8 million in fiscal 2011 due to higher sales of
diabetic products, which increased $2.5 million, or 18%, and higher
sales of Other Products, which increased $1.2 million, or 26%.
- Gross profit increased $0.8 million, or
20%, to $5.1 million in fiscal 2011 primarily due to the increase
in net sales, and to a lesser extent, decreases in certain
components of costs of goods sold as a percentage of sales. These
improvements to costs of goods sold were offset, in part, by higher
materials costs.
- Sales and marketing expenses increased
$1.2 million, or 56%, to $3.4 million in fiscal 2011 primarily due
to investments we made in personnel and the incurrence of related
travel and entertainment costs. To a lesser extent, additional
investments made with regard to office and telecommunication,
product development, and sampling and promotion also contributed to
the increase. Such investments were made in Fiscal 2011 in order to
expand our business, the beginnings of which we expect to see in
the first quarter of our 2012 fiscal year, with continued growth
thereafter.
- General and administrative expenses
increased $1.1 million, or 29%, to $4.7 million in fiscal 2011
primarily due to investments we made in personnel including the
payment of retention and inducement bonuses and the incurrence of
related travel and entertainment costs, which, in part, was related
to the relocation of our executive offices. To a lesser extent,
additional investments made with regard to telecommunication,
general office, and professional services also contributed to the
increase. Such investments are related to the anticipated growth
referred to in the preceding paragraph.
- Other income (expense) increased to $58
thousand of income in fiscal 2011 from $10 thousand of income in
fiscal 2010, due primarily to higher interest income resulting from
a note receivable.
- Net loss was $2.9 million, or ($0.36)
per share, in 2011 compared to net loss of $1.7 million, or ($0.21)
per share, in fiscal 2010. The increase in net loss was due
primarily to the investments in operating expenses made in respect
of fiscal 2011 and in anticipation of the growth we expect for our
fiscal 2012 year (primarily sales and marketing as well as general
and administrative expenses), which were offset, in part, by higher
gross profit and other income.
Brett M. Johnson, Forward’s President and Chief Executive
Officer, commented: “We are pleased with the growth in sales and
gross profit that we achieved in our OEM business for fiscal 2011,
which, on a standalone basis, would have been profitable in fiscal
2011. Our net loss in fiscal 2011 directly reflects the ongoing
investments we are making in diversifying our selling channels and
expanding our product portfolio.”
Mr. Johnson continued: “In our OEM business, we have recently
been awarded several large programs by two major customers. We
anticipate that these programs will begin to contribute
meaningfully to revenues in the second half of fiscal 2012. In
addition, we have experienced increased interest from several
existing customers in both diabetic and consumer electronics
products. We are committed to growing our OEM business and we are
encouraged by the momentum we are experiencing in this channel. At
the same time, there are also headwinds in this market, as we
continue to face a very price-constrained environment and are
looking at increases in supplier prices.”
“As previously announced, our strategy is to leverage our
design, logistics, and sourcing expertise to build a global,
multi-channel (retail, corporate, online and OEM) consumer
electronics accessory brand that defines itself through leading
edge technology. We have invested significantly in product
development and sales resources in order to launch a “Forward”
branded line of cases and accessories into the retail and corporate
marketplace. This product range will include an extensive
collection of cases for smartphones, tablets and portable
computers, incorporating our exclusive license of G-Form’s
revolutionary and patented protection technology.”
“We believe the investments we have made in experienced sales,
design, product development, operations, and administrative
personnel, will bear fruit in fiscal 2012 with the expansion of our
product range, customer base and geographic coverage. As a result,
we hope to achieve our goal of transitioning Forward from a
predominantly “in-box” medical OEM case company, to a
multi-channel, multi-product, geographically diverse business that
differentiates itself through cutting-edge technology, design and
innovation.”
The tables below are derived from the Company’s audited,
consolidated financial statements included in its Annual Report on
Form 10-K filed today with the Securities and Exchange Commission.
Please refer to the Form 10-K for complete financial statements and
further information regarding the Company’s results of operations
and financial condition relating to the fiscal years ended
September 30, 2011 and 2010. Please also refer to the Form 10-K for
a discussion of risk factors applicable to the Company and its
business.
Note Regarding Forward-Looking Statements
In addition to the historical information contained herein, this
press release contains certain “forward-looking statements” within
the meaning of Section 27A of the Securities Act of 1933, as
amended, and Section 21E of the Securities Exchange Act of 1934, as
amended, that reflect Forward’s current expectations and
projections about its future results, performance, prospects and
opportunities. Forward has tried to identify these forward-looking
statements by using words such as “may”, “should,” “expect,”
“hope,” “anticipate,” “believe,” “intend,” “plan,” “estimate” and
similar expressions. These forward-looking statements are based on
information currently available to the Company and are subject to a
number of risks, uncertainties and other factors that could cause
its actual results, performance, prospects or opportunities in
fiscal 2012 and beyond to differ materially from those expressed
in, or implied by, these forward-looking statements. No assurance
can be given that the actual results will be consistent with the
forward-looking statements. Investors should read carefully the
factors described in the “Risk Factors” section of the Company’s
filings with the SEC, including the Company’s Form 10-K for the
year ended September 31, 2011 for information regarding risk
factors that could affect the Company’s results. Except as
otherwise required by Federal securities laws, Forward undertakes
no obligation to publicly update or revise any forward-looking
statements, whether as a result of new information, future events,
changed circumstances or any other reason.
About Forward Industries
Forward Industries, Inc. a designer and distributor of custom
carrying case solutions for hand held electronic devices, is
expanding into a multi- faceted product-focused company
specializing in power, protection and peripherals, is expert at
identifying new products that aim to make life more efficient with
superior function and smart design that enhance daily life.
Forward’s products, including those incorporating G-Form’s extreme
protection technology, can be viewed online at
www.forwardindustries.com.
FORWARD INDUSTRIES, INC.
CONSOLIDATED STATEMENTS OF
OPERATIONS
For the Fiscal Years
EndedSeptember 30,
2011 2010 Net sales $ 22,777,040 $
18,996,827
Cost of goods sold 17,712,425
14,764,840
Gross profit 5,064,615
4,231,987
Operating expenses:
Sales and marketing 3,391,396 2,166,542 General and administrative
4,688,236 3,636,309
Total operating
expenses 8,079,632 5,802,851
Loss from operations (3,015,017 ) (1,570,864 )
Other income (expense): Interest income 107,686
42,941 Other expense, net (49,258 ) (32,868 )
Total other income 58,428 10,073
Loss before income tax (benefit) expense
(2,956,589
)
(1,560,791
)
Income tax (benefit) expense (56,050 ) 124,032
Net loss $ (2,900,539 ) $ (1,684,823 )
Net
loss per common and common equivalent share Basic $ (0.36 ) $
(0.21 ) Diluted $ (0.36 ) $ (0.21 )
Weighted average
number of common and common equivalent shares outstanding
Basic 8,080,344 7,983,257 Diluted
8,080,344 7,983,257
FORWARD INDUSTRIES, INC.
CONSOLIDATED BALANCE SHEETS
September 30, September 30, 2011
2010
Assets
Current assets: Cash and cash equivalents $ 14,911,844 $
18,471,520 Accounts receivable, net 3,894,118 4,621,181 Inventories
1,045,219 1,036,386 Prepaid expenses and other current assets
1,018,227 240,651 Note receivable 1,000,000 --
Total current assets 21,869,408 24,369,738
Property and equipment, net 302,158 115,205 Other assets
88,716 46,032
Total assets $ 22,260,282
$ 24,530,975
Liabilities and
shareholders’ equity
Current liabilities: Accounts payable $ 2,947,562 $ 2,439,273
Accrued expenses and other current liabilities 630,031
885,332
Total current liabilities
3,577,593 3,324,605
Commitments and contingencies Shareholders’
equity:
Preferred stock, par value $0.01 per
share; 4,000,000 shares authorized;
no shares issued
-- --
Common stock, par value $0.01 per share;
40,000,000 shares authorized,
8,794,296 and 8,761,629 shares issued
(including 706,410 held in
treasury at both dates)
87,943 87,616 Capital in excess of par value 16,845,673 16,469,142
Treasury stock, 706,410 shares at cost (1,260,057 ) (1,260,057 )
Retained earnings 3,009,130 5,909,669
Total shareholders' equity 18,682,689
21,206,370
Total liabilities and shareholders’ equity
$ 22,260,282 $ 24,530,975
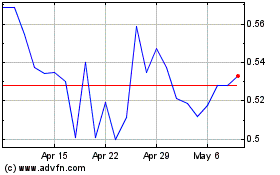
Forward Industries (NASDAQ:FORD)
Historical Stock Chart
From Jun 2024 to Jul 2024

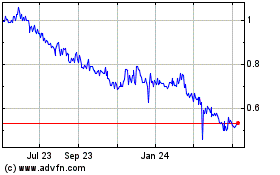
Forward Industries (NASDAQ:FORD)
Historical Stock Chart
From Jul 2023 to Jul 2024
