/C O R R E C T I O N -- CNinsure Inc./
August 26 2008 - 7:48PM
PR Newswire (US)
In the news release, "CNinsure (NASDAQ:CISG) Reports Second Quarter
2008 Unaudited Financial Results", issued earlier today by CNinsure
Inc. over Xinhua PR Newswire, we are advised by the company that in
the last financial table, "CNINSURE INC. Unaudited Condensed
Consolidated Statements of Operations", the item, Net income for
"For The Three Months Ended June 30, 2008" in RMB should be
"60,639", instead of "60,309", as originally issued inadvertently.
The correct financial table follows. CNINSURE INC. Unaudited
Condensed Consolidated Statements of Operations For The Three
Months Ended June 30, 2007 2008 2008 RMB RMB USD (In thousands,
except for shares and per share data) Net revenues: Commissions and
fees 101,729 214,698 31,301 Other service fees 117 150 22 Total net
revenues 101,846 214,848 31,323 Operating costs and expenses:
Commissions and fees (54,296) (109,337) (15,940) Selling expenses
(1,998) (2,829) (412) General and administrative expenses (14,577)
(31,946) (4,657) Total operating costs and expenses (70,871)
(144,112) (21,009) Income from operations 30,975 70,736 10,314
Other income (expense), net: Investment income -- 85 12 Interest
income 953 10,670 1,556 Interest expense (44) (30) (4) Others, net
4 (10) (1) Income before income taxes 31,888 81,451 11,877 Income
tax benefit (expense) 186 (19,165) (2,794) Net income before
minority interest 32,074 62,286 9,083 Minority interest 848 (1,647)
(240) Net income 32,922 60,639 8,843 Net Income per share: Basic
0.051 0.066 0.010 Diluted 0.049 0.066 0.010 Net Income per ADS:
Basic 1.013 1.329 0.194 Diluted 0.979 1.329(3) 0.194 Shares used in
calculating Net income per share Basic 650,000,000 912,497,726
912,497,726 Diluted 672,841,565 912,497,726 912,497,726 (3) There
is no dilutive effect for the three months end June 30, 2008 as the
stock options were anti-dilutive. CNINSURE INC. Unaudited Condensed
Consolidated Statements of Operations For The Six Months Ended June
30, 2007 2008 2008 RMB RMB USD Net revenues: Commissions and fees
172,323 351,180 51,199 Other service fees 238 286 42 Total net
revenues 172,561 351,466 51,241 Operating costs and expenses:
Commissions and fees (87,275) (180,405) (26,302) Selling expenses
(4,196) (6,964) (1,015) General and administrative expenses
(25,915) (60,710) (8,851) Total operating costs and expenses
(117,386) (248,079) (36,168) Income from operations 55,175 103,387
15,073 Other income (expense), net: Investment income -- 85 12
Interest income 1,980 23,702 3,456 Interest expense (66) (37) (5)
Others, net 15 (8) (1) Income before income taxes 57,104 127,129
18,535 Income tax benefit (expense) (176) (30,370) (4,428) Net
income before minority interest 56,928 96,759 14,107 Minority
interest 1,762 (1,087) (158) Net income 58,690 95,672 13,949 Net
Income per share: Basic 0.090 0.105 0.015 Diluted 0.089 0.105 0.015
Net Income per ADS: Basic 1.806 2.097 0.306 Diluted 1.782 2.097(4)
0.306 Shares used in calculating Net income per share Basic
650,000,000 912,497,726 912,497,726 Diluted 658,927,355 912,497,726
912,497,726 (4) There is no dilutive effect for the six months end
June 30, 2008 as the stock options were anti-dilutive. DATASOURCE:
CNinsure Inc.
Copyright
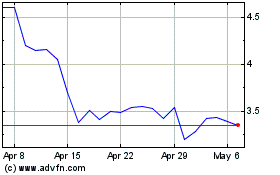
Fanhua (NASDAQ:FANH)
Historical Stock Chart
From Jun 2024 to Jul 2024

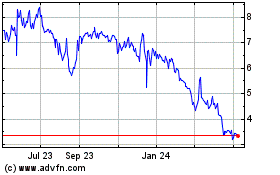
Fanhua (NASDAQ:FANH)
Historical Stock Chart
From Jul 2023 to Jul 2024
