FINBA INVERSIONES SICAV Key Figures
|
FINBA INVERSIONES SICAV Balance Sheet| %1$s Balance Sheet | | Sorry No Data Available |
|
 Share Price Performance| Share Price Performance | | Sample Period † | High | Low | | 1 week | 18,434.31 | 18,434.31 |
| 4 weeks | 18,434.31 | 18,434.31 |
| 12 weeks | 18,434.31 | 18,434.31 |
| 1 year | 18,639.83 | 12,574.85 |
Share Price Chart (5 years)| Share Price Chart (5 years) | 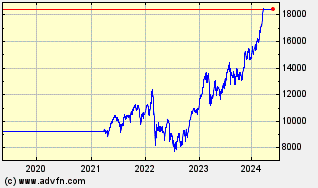 |
|
FINBA INVERSIONES SICAV Historic Returns| %1$s Historic Returns | | Giorni da oggi † | Open | Change | % | Open Avg. | Avg. Daily Vol [m] | Total Vol [m] | VWAP | | 1 week | 18,434.31 | - | - | 18,434.31 | - | | - |
| 4 weeks | 18,434.31 | - | - | 18,434.31 | - | | - |
| 12 weeks | 18,434.31 | - | - | 18,434.31 | - | | - |
| 26 weeks | 15,592.50 | 2,841.81 | 18.23 | 15,229.32 | - | | - |
| 1 year | 13,985.04 | 4,449.27 | 31.81 | 12,574.85 | - | | - |
| 3 years | 9,581.16 | 8,853.15 | 92.40 | 7,548.91 | - | | - |
| 5 years | 9,237.04 | 9,197.27 | 99.57 | 7,548.91 | - | | - |
| † periods calculated are whole weeks rather than calendar months | |
|