Vopak reports strong Q1 2024 results and increases FY 2024 outlook
April 24 2024 - 1:00AM

Vopak reports strong Q1 2024 results and increases FY 2024 outlook
The Netherlands, 24 April 2024
Vopak reports strong Q1 2024 results and increases FY
2024 outlook
Key highlights Q1 2024
Improve
- Increased net profit -including exceptional items1- in Q1 2024
to EUR 106 million, an improvement of 3% year-on-year, driven by
favorable storage demand across different geographies and
markets
- Increased proportional EBITDA -excluding exceptional items1- in
Q1 2024 to EUR 298 million, an improvement of 9% year-on-year when
adjusted for divestment impacts of EUR 21 million
- Further strengthened balance sheet, good progress on share
buyback program
- Increased FY 2024 outlook for proportional EBITDA and
EBITDA
Grow
- Strengthened our leading position in India with the acquisition
of a new terminal in Mangalore
- Good progress in developing a greenfield LPG-export terminal
project in Western-Canada
Accelerate
- Commissioned repurposed infrastructure in Singapore for
low-carbon transportation fuels, good progress in repurposing
existing capacity in Alemoa, Brazil and Vlaardingen, the
Netherlands
|
In EUR millions |
Q1 2024 |
Q4 2023 |
Q1 2023 |
| |
|
|
|
|
IFRS Measures -including exceptional items- |
|
|
|
|
Revenues |
328.2 |
352.8 |
361.8 |
|
Net profit / (loss) attributable to holders of ordinary shares |
105.8 |
87.4 |
103.1 |
|
Earnings per ordinary share (in EUR) |
0.85 |
0.69 |
0.82 |
|
Cash flows from operating activities (gross) |
278.8 |
219.7 |
227.0 |
|
Cash flows from investing activities (including derivatives) |
-111.1 |
247.4 |
-103.1 |
| |
|
|
|
| Alternative
performance measures -excluding exceptional items-
1,2 |
|
|
|
|
Group operating profit / (loss) before depreciation and
amortization (EBITDA) |
235.0 |
228.8 |
249.0 |
|
Net profit / (loss) attributable to holders of ordinary shares |
105.8 |
109.0 |
103.1 |
|
Earnings per ordinary share (in EUR) |
0.85 |
0.87 |
0.82 |
|
Proportional revenues |
477.9 |
494.1 |
486.1 |
|
Proportional group operating profit / (Loss) before depreciation
and amortization (EBITDA) |
297.8 |
282.3 |
294.1 |
|
|
|
|
|
|
Business KPIs |
|
|
|
|
Storage capacity end of period (in million cbm) |
34.8 |
35.2 |
36.6 |
|
Proportional storage capacity end of period (in million cbm) |
20.2 |
20.6 |
22.1 |
|
Subsidiary occupancy rate |
92% |
91% |
92% |
|
Proportional occupancy rate |
93% |
91% |
92% |
|
|
|
|
|
|
Financial KPIs 2 |
|
|
|
|
Proportional operating cash return |
17.0% |
12.8% |
15.4% |
|
Net interest-bearing debt |
2,223.4 |
2,286.4 |
2,946.5 |
|
Total net debt : EBITDA |
1.76 |
1.99 |
2.69 |
1 No exceptional items were recorded in Q1 2024 and Q1 20232 See
enclosure 2 of the press release for reconciliation to the most
directly comparable subtotal or total specified by IFRS Accounting
Standards
CEO statement
“In the first quarter of 2024, we continued to deliver on our
strategy to improve our financial and sustainability performance,
to grow our business in industrial and gas terminals, and to
accelerate towards new energies and sustainable feedstocks. The
demand for our infrastructure services remained robust, resulting
in an increased proportional occupancy of 93%. Oil and gas markets
were strong, driven by a higher demand for energy, and rerouting of
supply chains. Chemical markets remain under pressure, having a
limited impact on our chemical distribution terminals so far, while
industrial terminals maintained solid results, backed by long-term
take-or-pay contracts. We continue to grow our footprint in India
and acquired a new terminal in Mangalore. Our strong performance
and strategy execution coupled with favorable market conditions
positions us well to revise our outlook for FY 2024 upwards. We are
committed to grow our business in industrial and gas infrastructure
and accelerate towards new energies and sustainable
feedstocks.”
Financial Highlights for Q1 2024
IFRS Measures -including exceptional items-
- Revenues were EUR
328 million (Q1 2023: EUR 362 million), adjusted for divestment
impacts of EUR 44 million revenues increased by 3% year-on-year.
The positive performance was driven by favorable storage demand
across different geographies and markets.
- Demand for our services continued
to be robust during the first quarter of 2024. In the hub
locations, storage demand was strong, primarily driven by the
continued rise in demand for oil and the rerouting of trade flows.
Demand in the distribution oil terminals remained firm as well.
Chemical markets continued to be characterized by oversupply which
put pressure on end-product prices and production margins. In
chemical distribution terminals, the impact on demand for storage
infrastructure was limited, but remains uncertain for the rest of
the year. Throughput levels in our industrial terminals were solid.
Gas terminals showed firm throughput levels, backed by growing
energy demand and energy security considerations.
- Operating expenses
were EUR 155 million in Q1 2024 (Q1 2023: EUR 175 million),
adjusted for divestment impacts of EUR 24 million these expenses
increased by EUR 4 million mainly due to an increase in personnel
expenses.
- Cash flows from operating
activities increased by EUR 52 million to EUR 279
million compared to Q1 2023 EUR 227 million, a 23% increase
year-on-year, mainly related to increased dividends received from
joint ventures (EUR 80 million) partly offset by lower EBITDA due
to divestment impacts and negative working capital
movements.
- Net profit attributable to
holders of ordinary shares increased to EUR 106 million
(Q1 2023: EUR 103 million). Earnings per share (EPS) continued to
improve, Q1 2024 EPS were EUR 0.85 (4% year-on-year) compared to
EUR 0.82 in Q1 2023.
- Share buyback
program of up to EUR 300 million announced on 14 February
2024, is progressing well. Since the start, around 30% of the
program has been executed per April 19th, and will run until the
end of 2024, barring unforeseen circumstances. For the progress of
our share buyback program please visit our website.
Alternative performance measures -excluding exceptional
items-1
- Proportional
EBITDA increased to EUR 298 million (Q1 2023: EUR 294
million). Adjusted for divestment impacts of EUR 21 million,
proportional EBITDA increased by EUR 25 million (9% year-on-year).
Proportional EBITDA margin in Q1 2024 was 60% (Q1 2023: 58%)
reflecting good business conditions and our commercial ability to
pass on inflationary and exceptional energy costs.
- EBITDA was EUR 235
million (Q1 2023: EUR 249 million) adjusted for divestment impacts
of EUR 21 million. EBITDA increased by EUR 7 million (3%
year-on-year) as a result of favorable storage demand across the
various markets and geographies. Compared to Q4 2023 (EUR 229
million), EBITDA increased due to the lower operating expenses and
slightly higher results from joint ventures which more than offset
divestment impacts of EUR 12 million.
- Growth capex in
the first quarter was EUR 64 million (Q1 2023: EUR 54 million)
reflecting growth investments in India, Belgium, the United States,
and Canada, among others. Proportional growth investments in Q1
2024 were EUR 83 million (Q1 2023: EUR 64 million).
- Operating capex,
which includes sustaining and IT capex, decreased to EUR 40 million
(Q1 2023: EUR 50 million) due to divestment impacts.
- Proportional operating cash
flow in Q1 2024 increased by EUR 6 million (3%
year-on-year) to EUR 228 million (Q1 2023 EUR 222 million) driven
mainly by improved proportional EBITDA performance. Proportional
operating cash flow per share in Q1 2024 increased to EUR 1.83 per
share from EUR 1.77 in Q1 2023.
Business KPIs
- Proportional
occupancy rate at Q1 2024 increased to 93% (Q1 2023: 92%)
mainly related to increased occupancy in the Netherlands Business
Unit due to reduced available capacity. In Europoort, we have
reduced the base capacity by ~380 thousand cbm in line with our
previously announced ambition to gradually reduce oil capacity in
Europoort, to accelerate towards new energies and sustainable
feedstocks.
Financial KPIs
- Proportional operating cash
return in Q1 2024 was 17% compared to 15% in Q1 2023. The
increase was mainly due to a lower average capital employed due
to divestments and positive contribution from new growth
projects.
- Total net debt :
EBITDA ratio is 1.76x at the end of Q1 2024 compared to
2.69x at the end of Q1 2023 and 1.99x at the end of Q4 2023. Our
ambition is to keep Total net debt to EBITDA in the range of around
2.50-3.00x.
For more information please contact:
Vopak Press: Liesbeth Lans - Manager External Communication,
e-mail: global.communication@vopak.comVopak Analysts and Investors:
Fatjona Topciu - Head of Investor Relations, e-mail:
investor.relations@vopak.com
The analysts’ presentation will be given via an on-demand audio
webcast on Vopak’s corporate website, starting at 08:45 AM CEST on
24 April 2024.
This press release contains inside information as meant in
clause 7 of the Market Abuse Regulation. The content of this report
has not been audited or reviewed by an external auditor.
1. To supplement Vopak’s financial information presented
in accordance with IFRS, management periodically uses certain
alternative performance measures to clarify and enhance
understanding of past performance and future outlook. For further
information please refer to page 7of the press release.
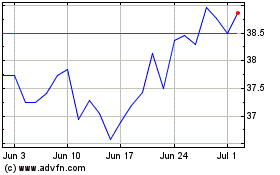
Koninklijke Vopak (EU:VPK)
Historical Stock Chart
From Nov 2024 to Dec 2024

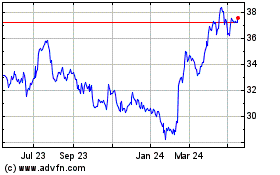
Koninklijke Vopak (EU:VPK)
Historical Stock Chart
From Dec 2023 to Dec 2024
