For many, cost is not the only determinant in making an
investment in an ETF and for good reason. There are many other
issues to consider besides the expense ratio including
diversification, commission-free trading availability, structure,
and liquidity. Yet in some cases, cost is really what separates two
funds far and above any of the other issues touched upon above.
This can especially be true when two funds track similar—or even
exactly the same—indexes but charge very different expense ratios.
Generally speaking, when cost is really the only big difference
between two funds, one would expect that over time the lower cost
product would slowly overtake the lead in AUM. This has been the
case in a few products as of late, most famously in the emerging
market space with VWO and EEM. Both funds track the MSCI Emerging
Markets Index but VWO only charges 22 basis points a year in
expenses while EEM asks for 0.69% a year in fees. Until recently,
EEM had far more in assets than its counterpart from Vanguard but
the gap has slowly closed in the past few months until finally, VWO
took the lead in total assets (see Top Three BRIC ETFs).
However, while this trend may be playing out in a number of
asset classes across the space, the more expensive option is
actually still the more popular one in a number of cases. Below we
have highlighted five instances in which this is the case and the
only major difference—beyond trading volume—is the expense ratio.
Thanks to this reality, many investors may be better served by
expanding their horizons and taking a look more closely at all of
the options in a particular class of funds but especially so in the
following five product types:
Gold ETFs
Thanks to concerns about the health of Europe and the long-term
strength of the U.S. dollar, gold investing has surged in
popularity in recent months. Many investors continue to flow into
the SPDR Gold Trust (GLD) as a way to play this trend although
there are several other products in the space that could also offer
great exposure to gold bullion. Chief among them is the iShares
COMEX Gold Trust (IAU) which also holds physical gold in secure
vaults (read Three Best Gold ETFs).
While both funds hold gold, the main difference between the two
is the expense ratio as IAU charges investors just 25 basis points
compared to a fee of 0.40% for GLD. While some might assume that
trading volumes play a role in this differential, IAU trades close
to 10 million shares a day suggesting ample volume for even the
biggest traders. Nevertheless, the iShares fund has close to $8
billion in assets while GLD has close to $65 billion, a sizable
lead that will take quite some time to eat into.
Small Cap ETFs
For investors seeking a play on the often volatile small cap
sector, there are numerous options available. Beyond micro cap
funds and products that target various corners of the space—such as
value or growth—investors also have multiple options when it comes
to broad funds as well. In this space, the iShares Russell 2000 ETF
(IWM) dominates the field, having amassed nearly $14 billion in AUM
while trading close to 76.5 million shares a day. This comes
despite the fact that the upstart in the sector, the Vanguard
Russell 2000 ETF (VTWO) charges far less in expenses but tracks the
same Russell 2000 Index (see Three Micro Cap ETFs TO Play The
January Effect).
In fact, VWTO has amassed just $53 million in assets and trades
just 13,700 shares a day, small figures compared to the gigantic
levels seen in IWM. However, while the volume may be weak, it
should be noted that VTWO chares just 15 basis points a year in
fees compared to 26 for IWM. While this might not sound like a huge
difference, it is nearly half the cost for pretty much identical
exposure, a factor that should cause most investors to pause before
they choose which product to invest in next time.
Japanese Yen Funds
Although the Japanese economy was rocked by the earthquake and
Tsunami in March of 2011, the nation has rebounded quite well and
has seen inflows in recent months. This has largely been due to
repatriation of assets as well as foreign investors looking to
scoop up beaten down assets in a low risk country. Thanks to this,
interest in the yen has been strong and most investors continue to
choose the CurrencyShares Japanese Yen Trust (FXY) for their
exposure. This is despite the fact that another product, the
WisdomTree Dreyfus Japanese Yen Fund (JYF) also gives investors
exposure to the yen but does so at a slightly cheaper rate (also
read Ten Best New ETFs Of 2011).
JYF charges investors 35 basis points compared to the 40 charged
by FXY for its services, suggesting that cost conscious yen
investors may be better served by the WisdomTree product. However,
this hasn’t really been the case so far as JYF has a paltry $13
million in assets compared to a nearly $726 million haul for FXY.
This has also produced a huge trading volume discrepancy as just
10,500 shares change hands a day in JYF compared to nearly 310,000
for FXY. Probably due to this heavy difference, the popularity of
FXY over JYF looks likely to continue well into the future.
EAFE Region ETFs
While heavy exposure to the regions of Europe, Australasia, and
the Far East (EAFE) may not be a great idea for risk adverse
investors at this time, a small allocation to these important parts
of the world seems necessary no matter what the broad economy is
doing. That is because this region includes five of the ten largest
economies in the world as well as several more that are in the top
twenty overall. For access to this region, many investors still
look to the iShares MSCI EAFE Fund (EFA) for their exposure, as the
fund has $37 billion in assets and over 26 million shares a day in
volume (see EUFN: The Best ETF For The Euro Crisis).
Yet, despite these impressive figures, investors have another
quality choice in the space that could also offer robust volume;
the Vanguard MSCI EAFE ETF (VEA). This fund has a comparatively
small amount of assets at $6 billion and trades about 2.4 million
shares a day, still respectable figures no matter how you slice it.
However, it seems as though most have looked over the fact that
both VEA and EFA track the MSCI EAFE Index and that VEA charges
just 15 basis points a year compared to 35 basis points for EFA.
This represents a cost that is more than double for pretty much the
exact same exposure, suggesting that pretty much all types of
investors—be they traders or long-term buy-and-holders—would be
better off taking a closer look at VEA for their exposure to the
region.
Broad Bond Funds
With bonds outperforming stocks in 2011, the sector looks to
attract considerable interest from a wide range of investors.
Luckily, there is no shortage of options in the space including
three products that track the same Barclays Capital U.S. Aggregate
Index; AGG, LAG, and SCHZ. Yet while all three have the same
underlying benchmark, their fees are quite different.
AGG is currently the leader in the space with $14 billion in AUM
and volume of 1.1 million shares a day. This is in sharp contrast
to both of the other products in the space, LAG and SCHZ, which
together barely combine for one-tenth of the figure on the volume
side and less than 3.5% of the AUM of the iShares fund. This is
especially surprising as AGG charges investors 22 basis points a
year while LAG has expenses of 13 basis points and SCHZ has a cost
of just 10 basis points a year (read The Best Bond ETF You Have
Never Heard Of).
In other words, investors have two options in order to get
exposure to the same index for half the cost in the bond space, but
for whatever reason many are choosing not to do so. While the low
trading volumes are undoubtedly one of the reasons, for long term
investors it would seem to make more sense to have an allocation to
LAG or SCHZ, despite the wider bid ask spreads, rather than paying
double every year for AGG.
Want the latest recommendations from Zacks Investment Research?
Today, you can download 7 Best Stocks for the Next 30
Days. Click to get this free report >>
Author is long VWO, IAU.
To read this article on Zacks.com click here.
Zacks Investment Research
Want the latest recommendations from Zacks Investment Research?
Today, you can download 7 Best Stocks for the Next 30 Days. Click
to get this free report
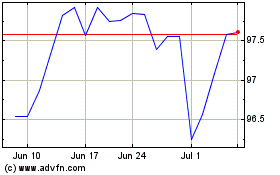
US Aggregate (AMEX:AGG)
Historical Stock Chart
From Dec 2024 to Jan 2025

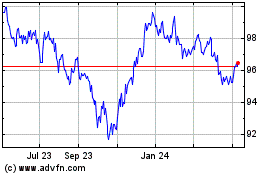
US Aggregate (AMEX:AGG)
Historical Stock Chart
From Jan 2024 to Jan 2025
