The agricultural commodity market experienced quite the volatile
2012, thanks to the massive drought in the Midwest growing region
last summer that resulted in lower yield and steeper price
increases for grains like corn and soybean.
With a majority of agricultural land affected by drought, total
crop production was the least in several years, hampering not only
crops, but livestock as well (See: Beyond Corn: Three Commodity
ETFs Surging this Summer).
In short, the highly volatile agricultural commodity market is
largely a function of weather and thus subject to extreme
volatility. Below is what we see in store for corn, wheat, and
soybean in 2013:
Imbalance May Drive Prices, But….
The persisting drought condition in some top corn-harvesting
states will affect this year’s production and should raise prices
in early 2013. Per the USDA, retail food price inflation has
averaged 2.5%–3% each year on average for the past 20 years. But
the Department has warned of a slight increase from the historical
averages in 2013.
For the 2012/13 year, USDA forecasted total corn supplies at
around 11.8 billion bushels, 13% lower year over year and soybean
meal prices in the range of $455––$485 per short ton, up from an
estimated $394 per ton for the 2011/12 marketing year. In such a
backdrop, the global demand for grains will keep the prices firm in
the near term, but this is just one side of the coin.
Prices to Calm Down as the Year Moves
This scenario should reverse as the year progresses with easing
supply concerns and favorable weather conditions. Crops have
already seen its peak last year and could see a decline this year.
Further, anemic growth in the global economy and lingering concerns
over macro uncertainty, which might drag down overall agricultural
consumption in 2013.
There are also some external factors to regulate pricing like
the recent cancellation of a big U.S. soybean order by China, one
of the biggest importers of soybeans.
Now, industry sources are saying that China booked the soybeans
at a price well above current levels and called off the contract
watching the softening trend of prices. Soybean futures fell 2.0%
to a one-month low following the cancellation. In fact, the prices
began to simmer in September last year (See: Can the Soybean ETF
Continue its Bull Run?).
Corn and wheat prices are also trending lower with weak export
demand. The competitive scenario is also heating up.
Argentina, the second-largest corn exporter in the highest
number of years and currently enjoying relatively uninterrupted
weather conditions, remains a key exporter to world economies.
Coming to wheat, the product will likely see a supply surplus in
2013 as suggested by the report of USDA that says U.S. wheat ending
stocks for 2012/13 is anticipated to rise 50 million bushels mainly
due to a shrinkage in exports.
Higher global supplies stemming from China, Australia (see:
Australia ETF Investing 101) and Canada will pull down demand for
U.S. wheat and its prices. Relatively good harvest weather is
supporting foreign countries. Further, the recent rains in most
states could boost the supply/demand balance in favor of
production.
With this backdrop, some of the agricultural commodity ETNs
might very well be weak picks for investors in 2013. These are
Teucrium Soybean (SOYB), Teucrium
Corn (CORN), Teucrium Wheat
(WEAT), IPath DOW Jones UBS Grains Sub index (JJG)
and IPath DOW Jones UBS Grains Sub index (JJA).
But before considering selling these ETNs, let’s take a look at
each:
Ebbing Fourth Quarter 2012 Returns
While SOYB seeks to gain exposure in Soybean by investing in
futures contract of the underlying commodity, CORN invests in corn
futures contracts. Returns for both the products declined a
respective of 7.8% and 8.4% in the fourth quarter of 2012.
Most other funds are also on a downhill ride since New
Year’s Eve with a respective negative year-to-date return of 0.91%
and 1.99%. Meanwhile, WEAT has registered a sharp fall of 11.1% in
the fourth quarter while this year, it receded
3.14%.
Higher total expenses for these ETNs (including expense ratio
and bid/ask spread) also add to the woes, potentially making these
funds less attractive in the sector for play. The expense ratio for
SOYB is 2.08%, CORN is 1.49% and WEAT is 2.34% while bid-ask
spreads are average but can sometimes spike (currently they
are 0.11%, 0.06%, and 0.15%, respectively) (see Buy the Ultimate
Commodity with These Water ETFs).
Returns for one of the largest products in the agricultural
commodity space ─ JJG investing in three futures contracts on
grains ─ fell 10.6% in the fourth quarter and the uncertainty has
continued this year with modest losses.
Another high-asset ETN ─ JJA –– following the same trend which
is mainly exposed to Soybeans, corn and wheat collapsed 9.8% in the
year-end quarter with another round of losses noticed
year-to-date.
The market is abuzz with reports of short selling of corn crops
in 2013 with the purpose of repurchasing them at a lower price
afterwards. We believe, the time has come when the
agricultural commodity futures will begin to deteriorate and
chances for these products to gain is less (see Is USCI the Best
Commodity ETF?).
SOYB, CORN, JJG, JJA currently carry a Zacks #5 Rank (Strong
Sell rating) while WEAT retains a Zacks #4 Rank (short-term Sell
rating).
Want the latest recommendations from Zacks Investment Research?
Today, you can download 7 Best Stocks for the Next 30
Days. Click to get this free report >>
TEUCRM-CORN FD (CORN): ETF Research Reports
IPATH-DJ-A AGG (JJA): ETF Research Reports
IPATH-DJ-A GRNS (JJG): ETF Research Reports
TEUCRM-SOYBEAN (SOYB): ETF Research Reports
TEUCRM-WHEAT FD (WEAT): ETF Research Reports
To read this article on Zacks.com click here.
Zacks Investment Research
Want the latest recommendations from Zacks Investment Research?
Today, you can download 7 Best Stocks for the Next 30 Days. Click
to get this free report
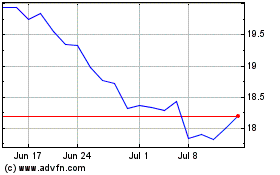
Teucrium Corn (AMEX:CORN)
Historical Stock Chart
From Nov 2024 to Dec 2024

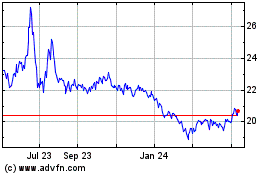
Teucrium Corn (AMEX:CORN)
Historical Stock Chart
From Dec 2023 to Dec 2024
