| CONFIDENTIAL
- PRELIMINARY DRAFT
- SUBJECT TO FURTHER REVIEW
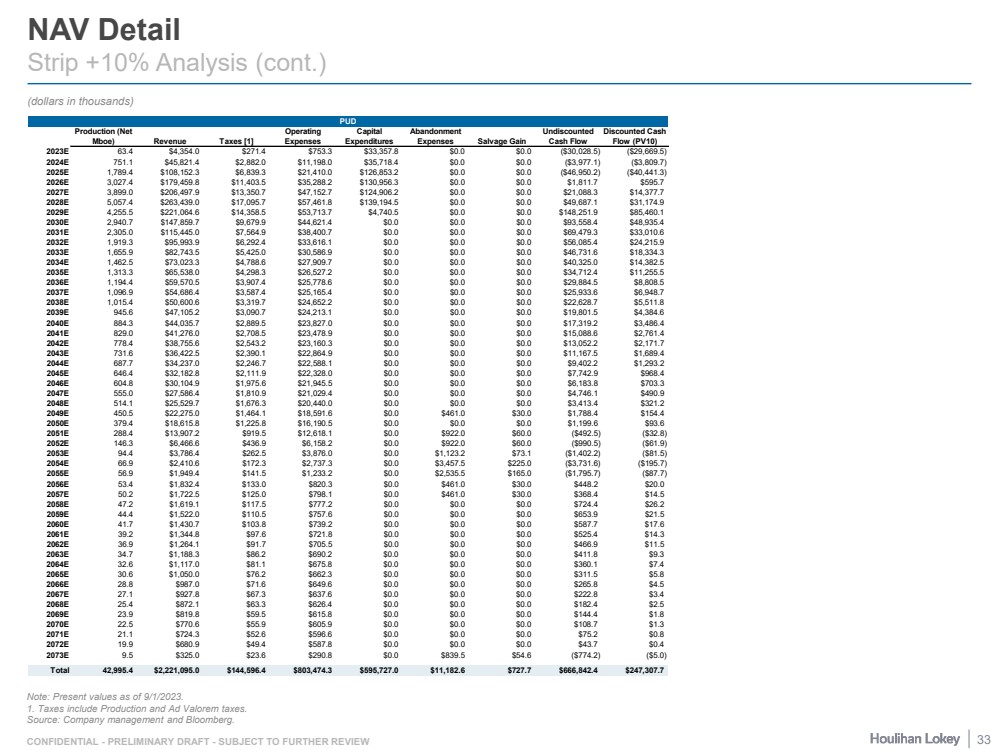
NAV Detail
Strip +10% Analysis (cont.)
(dollars in thousands)
Note: Present values as of 9/1/2023.
1. Taxes include Production and Ad Valorem taxes.
Source: Company management and Bloomberg.
Production (Net
Mboe) Revenue Taxes [1]
Operating
Expenses
Capital
Expenditures
Abandonment
Expenses Salvage Gain
Undiscounted
Cash Flow
Discounted Cash
Flow (PV10)
2023E 63.4 $4,354.0 $271.4 $753.3 $33,357.8 $0.0 $0.0 ($30,028.5) ($29,669.5)
2024E 751.1 $45,821.4 $2,882.0 $11,198.0 $35,718.4 $0.0 $0.0 ($3,977.1) ($3,809.7)
2025E 1,789.4 $108,152.3 $6,839.3 $21,410.0 $126,853.2 $0.0 $0.0 ($46,950.2) ($40,441.3)
2026E 3,027.4 $179,459.8 $11,403.5 $35,288.2 $130,956.3 $0.0 $0.0 $1,811.7 $595.7
2027E 3,899.0 $206,497.9 $13,350.7 $47,152.7 $124,906.2 $0.0 $0.0 $21,088.3 $14,377.7
2028E 5,057.4 $263,439.0 $17,095.7 $57,461.8 $139,194.5 $0.0 $0.0 $49,687.1 $31,174.9
2029E 4,255.5 $221,064.6 $14,358.5 $53,713.7 $4,740.5 $0.0 $0.0 $148,251.9 $85,460.1
2030E 2,940.7 $147,859.7 $9,679.9 $44,621.4 $0.0 $0.0 $0.0 $93,558.4 $48,935.4
2031E 2,305.0 $115,445.0 $7,564.9 $38,400.7 $0.0 $0.0 $0.0 $69,479.3 $33,010.6
2032E 1,919.3 $95,993.9 $6,292.4 $33,616.1 $0.0 $0.0 $0.0 $56,085.4 $24,215.9
2033E 1,655.9 $82,743.5 $5,425.0 $30,586.9 $0.0 $0.0 $0.0 $46,731.6 $18,334.3
2034E 1,462.5 $73,023.3 $4,788.6 $27,909.7 $0.0 $0.0 $0.0 $40,325.0 $14,382.5
2035E 1,313.3 $65,538.0 $4,298.3 $26,527.2 $0.0 $0.0 $0.0 $34,712.4 $11,255.5
2036E 1,194.4 $59,570.5 $3,907.4 $25,778.6 $0.0 $0.0 $0.0 $29,884.5 $8,808.5
2037E 1,096.9 $54,686.4 $3,587.4 $25,165.4 $0.0 $0.0 $0.0 $25,933.6 $6,948.7
2038E 1,015.4 $50,600.6 $3,319.7 $24,652.2 $0.0 $0.0 $0.0 $22,628.7 $5,511.8
2039E 945.6 $47,105.2 $3,090.7 $24,213.1 $0.0 $0.0 $0.0 $19,801.5 $4,384.6
2040E 884.3 $44,035.7 $2,889.5 $23,827.0 $0.0 $0.0 $0.0 $17,319.2 $3,486.4
2041E 829.0 $41,276.0 $2,708.5 $23,478.9 $0.0 $0.0 $0.0 $15,088.6 $2,761.4
2042E 778.4 $38,755.6 $2,543.2 $23,160.3 $0.0 $0.0 $0.0 $13,052.2 $2,171.7
2043E 731.6 $36,422.5 $2,390.1 $22,864.9 $0.0 $0.0 $0.0 $11,167.5 $1,689.4
2044E 687.7 $34,237.0 $2,246.7 $22,588.1 $0.0 $0.0 $0.0 $9,402.2 $1,293.2
2045E 646.4 $32,182.8 $2,111.9 $22,328.0 $0.0 $0.0 $0.0 $7,742.9 $968.4
2046E 604.8 $30,104.9 $1,975.6 $21,945.5 $0.0 $0.0 $0.0 $6,183.8 $703.3
2047E 555.0 $27,586.4 $1,810.9 $21,029.4 $0.0 $0.0 $0.0 $4,746.1 $490.9
2048E 514.1 $25,529.7 $1,676.3 $20,440.0 $0.0 $0.0 $0.0 $3,413.4 $321.2
2049E 450.5 $22,275.0 $1,464.1 $18,591.6 $0.0 $461.0 $30.0 $1,788.4 $154.4
2050E 379.4 $18,615.8 $1,225.8 $16,190.5 $0.0 $0.0 $0.0 $1,199.6 $93.6
2051E 288.4 $13,907.2 $919.5 $12,618.1 $0.0 $922.0 $60.0 ($492.5) ($32.8)
2052E 146.3 $6,466.6 $436.9 $6,158.2 $0.0 $922.0 $60.0 ($990.5) ($61.9)
2053E 94.4 $3,786.4 $262.5 $3,876.0 $0.0 $1,123.2 $73.1 ($1,402.2) ($81.5)
2054E 66.9 $2,410.6 $172.3 $2,737.3 $0.0 $3,457.5 $225.0 ($3,731.6) ($195.7)
2055E 56.9 $1,949.4 $141.5 $1,233.2 $0.0 $2,535.5 $165.0 ($1,795.7) ($87.7)
2056E 53.4 $1,832.4 $133.0 $820.3 $0.0 $461.0 $30.0 $448.2 $20.0
2057E 50.2 $1,722.5 $125.0 $798.1 $0.0 $461.0 $30.0 $368.4 $14.5
2058E 47.2 $1,619.1 $117.5 $777.2 $0.0 $0.0 $0.0 $724.4 $26.2
2059E 44.4 $1,522.0 $110.5 $757.6 $0.0 $0.0 $0.0 $653.9 $21.5
2060E 41.7 $1,430.7 $103.8 $739.2 $0.0 $0.0 $0.0 $587.7 $17.6
2061E 39.2 $1,344.8 $97.6 $721.8 $0.0 $0.0 $0.0 $525.4 $14.3
2062E 36.9 $1,264.1 $91.7 $705.5 $0.0 $0.0 $0.0 $466.9 $11.5
2063E 34.7 $1,188.3 $86.2 $690.2 $0.0 $0.0 $0.0 $411.8 $9.3
2064E 32.6 $1,117.0 $81.1 $675.8 $0.0 $0.0 $0.0 $360.1 $7.4
2065E 30.6 $1,050.0 $76.2 $662.3 $0.0 $0.0 $0.0 $311.5 $5.8
2066E 28.8 $987.0 $71.6 $649.6 $0.0 $0.0 $0.0 $265.8 $4.5
2067E 27.1 $927.8 $67.3 $637.6 $0.0 $0.0 $0.0 $222.8 $3.4
2068E 25.4 $872.1 $63.3 $626.4 $0.0 $0.0 $0.0 $182.4 $2.5
2069E 23.9 $819.8 $59.5 $615.8 $0.0 $0.0 $0.0 $144.4 $1.8
2070E 22.5 $770.6 $55.9 $605.9 $0.0 $0.0 $0.0 $108.7 $1.3
2071E 21.1 $724.3 $52.6 $596.6 $0.0 $0.0 $0.0 $75.2 $0.8
2072E 19.9 $680.9 $49.4 $587.8 $0.0 $0.0 $0.0 $43.7 $0.4
2073E 9.5 $325.0 $23.6 $290.8 $0.0 $839.5 $54.6 ($774.2) ($5.0)
Total 42,995.4 $2,221,095.0 $144,596.4 $803,474.3 $595,727.0 $11,182.6 $727.7 $666,842.4 $247,307.7
PUD
33 |