Casey’s General Stores, Inc. (Nasdaq: CASY) today reported
diluted earnings per share of $1.28 for the second quarter of
fiscal 2018 ended October 31, 2017, compared to $1.44 per
share for the same quarter a year ago. "The Company surpassed the
2,000 store milestone and now has 200 new-store sites either under
agreement or under construction at the end of the quarter,
including its first store in the state of Michigan," said Terry
Handley, President and Chief Executive Officer. "In addition, we
recently began the consultation phase of our digital engagement and
price optimization projects. We continue to make investments to
enhance ongoing operations and support our long-term vision to
create shareholder value."
Fuel - The Company's fiscal 2018 guidance was to increase
same-store gallons sold 1.0% to 2.0% with an average margin of 18.0
to 20.0 cents per gallon. For the quarter, same-store gallons sold
were up 1.9% with an average margin of 19.7 cents per gallon. "The
Company is an industry leader in same-store gallons sold, and
continues to gain market share in this category," said Handley.
"Further, our fuel pricing strategy positioned us to take advantage
of market volatility throughout the quarter to realize a fuel
margin near the top end of our guidance." The Company sold 17.3
million renewable fuel credits for $14.5 million during the second
quarter. Total gallons sold for the quarter were up 5.7% to 561.7
million gallons while gross profit dollars increased 11.7% to
$110.7 million. Year to date, same-store gallons sold were up 1.8%
with an average margin of 19.5 cents per gallon.
Grocery and Other Merchandise - The Company's fiscal 2018
guidance was to increase same-store sales 2.0% to 4.0% with an
average margin of 31.0% to 32.0%. For the quarter, same-store sales
were up 2.5% with an average margin of 32.0%. "Both the quarter and
year-to-date same-store sales and average margin was within our
annual performance guidance," stated Handley. "We continue to gain
market share in this category." For the first quarter, total
grocery and other merchandise revenue increased 5.0% to $572.2
million, and gross profit dollars were up 4.9% to $183.1 million.
Year to date, same-store sales were up 2.8% with an average margin
of 31.9%. Total revenue for the first six months was up 5.3% to
$1.2 billion while total gross profit dollars increased 5.6% to
$373.5 million.
Prepared Food and Fountain - The fiscal 2018 guidance was
to increase same-store sales 4.0% to 6.0% with an average margin of
61.5% to 62.5%. Same-store sales for the quarter were up 2.1% with
an average margin of 61.3%. "Softer traffic in the back half of the
quarter affected overall results in the category," said Handley.
Total prepared food and fountain revenue increased 5.5% to $262.0
million in the second quarter while gross profit dollars grew 2.7%
to $160.5 million. Year to date, total prepared food and fountain
revenue was up 6.5% to $523.8 million, and total gross profit
dollars were up 4.8% to $324.2 million. For the first six months,
same-store sales were up 2.9% with an average margin of 61.9%.
Operating Expenses - Casey's fiscal 2018 guidance was a
9.0% to 11.0% increase in total operating expenses. For the second
quarter, total operating expenses increased 9.4% to $322.9 million.
Year to date, total operating expenses increased 9.7% to $644.2
million. Both quarter-to-date and year-to-date increases were
driven by increases in employee-related costs from operating more
stores and implementing growth programs in more stores compared to
the same time periods last year. In addition, credit card fees and
fuel expenses combined were up $4.1 million for the quarter,
primarily due to higher fuel prices. Store level operating expenses
for open stores not impacted by recent growth programs were up 3.7%
for the quarter. "We're encouraged by the numerous steps we've
taken to further control overall cost increases and will continue
to look for additional ways to drive efficiencies in this area
going forward," added Handley.
Expansion - The Company's fiscal 2018 guidance was to
build or acquire 90 to 120 stores, replace 30 existing locations,
and complete 75 major remodels. At the end of the second quarter,
the Company had built and opened 12 new stores, acquired 14 stores,
completed 14 replacements, and remodeled 28 stores. In addition,
there were 66 new stores, 18 replacement stores, and 14 major
remodel stores under construction. Finally, the Company had 134
sites under agreement for new store construction and 16 acquisition
stores under agreement to purchase. "The acquisition pipeline
continues to expand, which further complements the accelerated
growth in our new store construction activity," said Handley. "The
Company is positioned well to take advantage of a consolidating
market and drive unit growth at faster levels than we have in the
past."
Share Repurchase Program - During the second quarter of
fiscal 2018, the Company repurchased 510,193 shares of its common
stock under its open market share repurchase program for
approximately $55.3 million, or an average price of $108.41 per
share. As of October 31, 2017, the Company had a total
remaining authorized amount for share repurchases of $117.4
million.
Dividend - At its December meeting, the Board of
Directors declared a quarterly dividend of $0.26 per share. The
dividend is payable February 15, 2018 to shareholders of record on
February 1, 2018.
Fiscal 2018 Guidance - Based on the softer traffic
experienced in the second quarter, the Company is revising its
prepared food and fountain same-store sales guidance to 2.0% to
4.0% from 4.0% to 6.0%. There were no other changes to the fiscal
2018 guidance. Below is a summary of the previous and current
fiscal 2018 guidance:
Same-store Sales Average Margin
Previous Current Previous Current Fuel (Gallons and
CPG) 1.0 - 2.0% 1.0 - 2.0% 18.0 - 20.0 18.0 - 20.0 Grocery and
Other Merchandise 2.0 - 4.0% 2.0 - 4.0% 31.0 - 32.0% 31.0 - 32.0%
Prepared Food and Fountain 4.0 - 6.0% 2.0 - 4.0% 61.5 - 62.5% 61.5
- 62.5% Previous Current Operating Expenses 9.0 - 11.0% 9.0 - 11.0%
Depreciation and Amortization 13.0 - 15.0% 13.0 - 15.0% Build or
Acquire 90 - 120 stores 90 - 120 stores Replacements 30 stores 30
stores Major Remodels 75 stores 75 stores
Casey’s General Stores,
Inc.Condensed ConsolidatedStatements of
Income(Dollars in thousands, except share and per share amounts)
(Unaudited)
Three Months EndedOctober 31, Six Months EndedOctober 31,
2017 2016
2017 2016 Total revenue
$ 2,153,745 $ 1,920,055
$ 4,247,484 $
3,890,134 Cost of goods sold (exclusive of depreciation and
amortization, shown separately below)
1,686,088 1,476,537
3,303,130 2,996,821 Operating expenses
322,949
295,289
644,196 587,417 Depreciation and amortization
54,157 48,675
106,526 94,530 Interest, net
12,976 10,075
24,351
20,615 Income before income taxes
77,575 89,479
169,281 190,751 Federal and state
income taxes
28,657 32,299
63,605 66,179 Net income
$ 48,918 $ 57,180
$
105,676 $ 124,572 Net income per common share
Basic
$ 1.29 $ 1.46
$
2.77 $ 3.18 Diluted
$ 1.28
$ 1.44
$ 2.75 $ 3.14
Basic weighted average shares
37,804,649 39,189,804
38,108,105 39,177,746 Plus effect of stock compensation
378,950 472,735
379,802 472,713 Diluted weighted
average shares
38,183,599 39,662,539
38,487,907 39,650,459
Casey’s General Stores,
Inc.Condensed Consolidated Balance Sheets(Dollars in
thousands)(Unaudited)
October 31, 2017 April 30, 2017
Assets Current
assets Cash and cash equivalents
$ 285,185 $ 76,717
Receivables
42,498 43,244 Inventories
241,681 201,644
Prepaid expenses
6,767 9,179 Income tax receivable
97 19,901 Total current assets
576,228 350,685 Other assets, net of
amortization
24,466 23,453 Goodwill
137,319 132,806
Property and equipment, net of accumulated depreciation of
$1,542,953 at October 31, 2017 and $1,496,472 at April 30, 2017
2,682,169 2,513,158 Total assets
$ 3,420,182 $ 3,020,102
Liabilities
and Shareholders’ Equity Current liabilities Notes payable to
bank
$ — $ 900 Current maturities of long-term debt
15,434 15,421 Accounts payable
307,110 293,903
Accrued expenses
145,085 136,322
Total current liabilities
467,629
446,546 Long-term debt, net of current maturities
1,299,626 907,356 Deferred income taxes
461,667
440,124 Deferred compensation
16,102 15,784 Other long-term
liabilities
20,826 19,672 Total
liabilities
2,265,850 1,829,482
Total shareholders’ equity
1,154,332
1,190,620 Total liabilities and shareholders’ equity
$ 3,420,182 $ 3,020,102
Certain statements in this news release, including any
discussion of management expectations for future periods,
constitute "forward-looking statements" within the meaning of the
Private Securities Litigation Reform Act of 1995. Such
forward-looking statements involve known and unknown risks,
uncertainties, and other factors that may cause actual results to
differ materially from future results expressed or implied by those
statements. Casey’s disclaims any intention or obligation to update
or revise forward-looking statements, whether as a result of new
information, future events, or otherwise.
Summary by Category (Amounts in thousands)
Three
months ended 10/31/2017 Fuel
Grocery & OtherMerchandise
Prepared Food& Fountain
Other Total
Revenue $ 1,306,246
$ 572,151 $ 261,998 $
13,350 $ 2,153,745 Revenue less cost of
goods sold (exclusive of depreciation and amortization)
$ 110,686 $ 183,133 $
160,510 $ 13,328 $ 467,657
8.5 % 32.0 % 61.3 %
99.8 % 21.7 % Fuel gallons
561,692 Three months ended 10/31/2016 Revenue $ 1,113,351 $
544,799 $ 248,345 $ 13,560 $ 1,920,055 Revenue less cost of goods
sold (exclusive of depreciation and amortization) $ 99,060 $
174,590 $ 156,329 $ 13,539 $ 443,518 8.9 % 32.0 % 62.9 % 99.8 %
23.1 % Fuel gallons 531,216
Summary by Category
(Amounts in thousands)
Six months ended 10/31/2017 Fuel
Grocery & OtherMerchandise
Prepared Food& Fountain
Other Total
Revenue $ 2,527,231 $
1,169,565 $ 523,838 $ 26,850
$ 4,247,484 Revenue less cost of goods sold
(exclusive of depreciation and amortization) $
219,898 $ 373,497 $ 324,155
$ 26,804 $ 944,354 8.7 %
31.9 % 61.9 % 99.8 %
22.2 % Fuel gallons 1,126,739 Six
months ended 10/31/2016 Revenue $ 2,260,395 $ 1,110,973 $ 492,001 $
26,765 $ 3,890,134 Revenue less cost of goods sold (exclusive of
depreciation and amortization) $ 203,489 $ 353,717 $ 309,381 $
26,726 $ 893,313 9.0 % 31.8 % 62.9 % 99.9 % 23.0 % Fuel gallons
1,067,180
Fuel Gallons Fuel
Margin Same-store Sales (Cents per gallon, excluding
credit card fees) Q1 Q2 Q3 Q4
FiscalYear
Q1 Q2 Q3 Q4
FiscalYear
F2018 1.7 % 1.9 % F2018
19.3
¢
19.7
¢
F2017 3.1 3.7
2.6 % (0.5 )% 2.1
% F2017 19.5 18.6
17.9
¢
17.2
¢
18.4
¢
F2016 3.4 3.3 1.6 4.6 3.0 F2016 17.5 24.7 18.1 17.8 19.6
Grocery & Other Merchandise Grocery & Other
Merchandise Same-store Sales Margin Q1 Q2 Q3 Q4
FiscalYear
Q1 Q2 Q3 Q4
FiscalYear
F2018 3.1 % 2.5 % F2018
31.9 % 32.0 % F2017 4.7 3.1
3.0
% 1.5 % 2.9 % F2017 31.6 32.0
31.1 % 31.1 % 31.5 %
F2016 7.7 6.6 7.7 9.7 7.8 F2016 32.6 31.5 31.2 32.1 31.9
Prepared Food & Fountain Prepared Food &
Fountain Same-store Sales Margin Q1 Q2 Q3 Q4
FiscalYear
Q1 Q2 Q3 Q4
FiscalYear
F2018 3.7 % 2.1 % F2018
62.5 % 61.3 % F2017 5.1 5.1
5.8
% 3.2 % 4.8 % F2017 62.8 62.9
61.7 % 61.7 % 62.3 %
F2016 10.3 9.4 6.0 8.2 8.4 F2016 62.5 63.4 62.0 61.9 62.5
Corporate information is available at this Web site:
http://www.caseys.com. Earnings will be reported during a
conference call on December 12, 2017. The call will be
broadcast live over the Internet at 9:30 a.m. CST via the Press and
Documents section of our Web site and will be available in an
archived format.
View source
version on businesswire.com: http://www.businesswire.com/news/home/20171211006112/en/
Casey’s General Stores, Inc.Bill
Walljasper, 515-965-6505
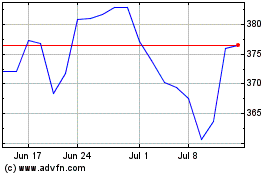
Caseys General Stores (NASDAQ:CASY)
Historical Stock Chart
From Aug 2024 to Sep 2024

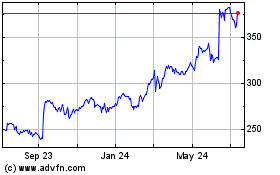
Caseys General Stores (NASDAQ:CASY)
Historical Stock Chart
From Sep 2023 to Sep 2024
