GBP/USD price analysis, April 27, 2022
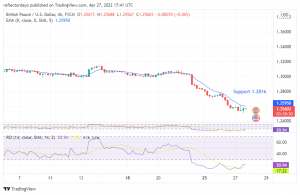
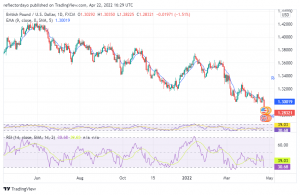
As at the time of writing this analysis, the price action is on a downtrend of 1.28321. It is quite a struggle between GBP/USD and the bear is having the upper hand over the bull.
From the look of things, the price action is beginning to perform slightly below the moving average curve, favouring the bears. This indicates GBP losing against the USD, but a reversal of the trend might take place since the price action still (at some point) crosses the moving average curve.
Resistance levels: 1.31334, 1.31168, 1.30292
Support levels: 1.31638, 1.30894, 1.30018
By the readings of the Relative Strength Index (RSI), we can see the curve performance below 50%, precisely at 30.68%. This is an indication of a down-trend even as the curve points down towards the crossing of the 30% boundary.

If the RSI curve crosses the 30% boundary, the price of GBPUSD may retrace an uptrend either for a short-term or a long-term trend. The behaviour of the Market might be a result of the Russia/Ukraine unrest. This may be creating such an outlook that makes GBPUSD to be trading below its true value. If this happens, a sharp retracement of price action should be expected.
Teach yourself Technical Analysis: Technical Analysis


