


Key Resistance Levels: $1,900, $1,950, $2000
Key Support Levels: $1,750, $1, 700,$1,650
Gold (XAUUSD) Long-term Trend: Bearish
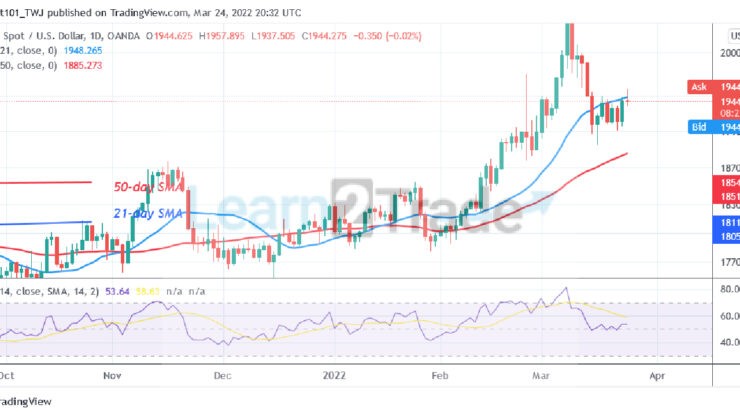
Gold (XAUUSD) has been consolidating above $1,907 as it regains bullish momentum. XAUUSD is trading above the 50-day line moving average but below the 21-day line moving average. The market will trend when the moving average lines are breached. For instance, if the bears break below the 50-day line moving average, the downtrend will resume. The market will decline to the low of $1,844. On the upside, if the bulls break above the 21-day line moving average, Gold will rise to revisit the previous high of $2,040. However, the market will continue to consolidate if the range-bound levels remain unbroken.
Daily Chart Indicators Reading:
Gold is at level 54 of the Relative Strength Index for period 14. It is now in the uptrend zone and capable of rising to the upside. The 21-day SMA and the 50-day SMA are sloping upward indicating the uptrend. The price bars are between the moving averages indicating the range-bound move.
Gold (XAUUSD) Medium-term bias: Bullish
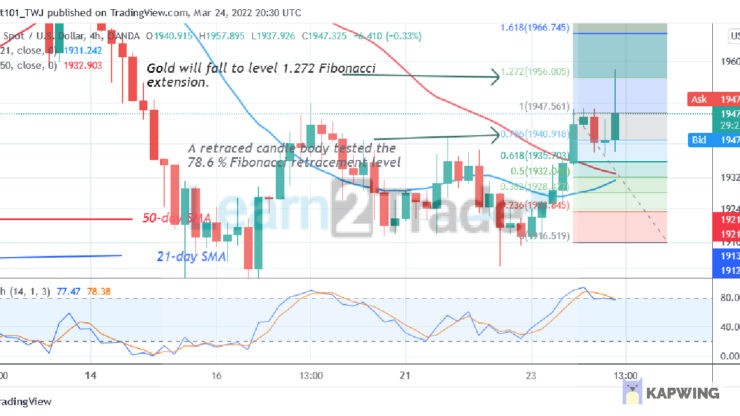
On the 4-hour chart, the Gold price is in an upward move. The uptrend has been stuck below the $1,960 resistance zone. Meanwhile, on March 23 uptrend; a retraced candle body tested the 78.6% Fibonacci retracement level. The retracement indicates that Gold will rise but reverse at level 1.272 Fibonacci extension or $1,956. From the price action, Gold has retested the level 1.272 Fibonacci extension and reversed it.
4-hour Chart Indicators Reading
XAUUSD is above the 80% range of the daily stochastic. Gold is likely to face rejection as the market reaches the overbought region. The 21-day SMA and the 50-day SMA are sloping upward indicating the downtrend.
General Outlook for Gold (XAUUSD)
Gold’s (XAUUSD) price is in a sideways trend as it regains bullish momentum. The uptrend is facing rejection at the $1,960 high. The price indicator has shown that Gold is in the overbought region of the market. There is the possibility of price fall.
Source: https://learn2.trade


