false
0000823768
WASTE MANAGEMENT INC
0000823768
2024-07-24
2024-07-24
iso4217:USD
xbrli:shares
iso4217:USD
xbrli:shares
SECURITIES AND
EXCHANGE COMMISSION
WASHINGTON, DC 20549
FORM 8-K
CURRENT REPORT
Pursuant to Section 13
or 15(d) of the Securities Exchange Act of 1934
Date of Report (Date of earliest event reported):
July 24, 2024
Waste
Management, Inc.
(Exact Name of Registrant as Specified in Charter)
| Delaware |
|
1-12154 |
|
73-1309529 |
(State
or Other Jurisdiction
of Incorporation) |
|
(Commission
File Number) |
|
(IRS
Employer
Identification No.) |
| 800
Capitol Street, Suite
3000, Houston,
Texas |
|
77002 |
| (Address
of Principal Executive Offices) |
|
(Zip
Code) |
Registrant’s Telephone number, including
area code: (713) 512-6200
(Former Name or Former Address, if Changed Since
Last Report)
Check the appropriate box below if the Form 8-K
filing is intended to simultaneously satisfy the filing obligation of the registrant under any of the following provisions:
| ¨ | Written
communications pursuant to Rule 425 under the Securities Act (17 CFR 230.425) |
| ¨ | Soliciting
material pursuant to Rule 14a-12 under the Exchange Act (17 CFR 240.14a-12) |
| ¨ | Pre-commencement
communications pursuant to Rule 14d-2(b) under the Exchange Act (17 CFR 240.14d-2(b)) |
| ¨ | Pre-commencement
communications pursuant to Rule 13e-4(c) under the Exchange Act (17 CFR 240.13e-4(c)) |
Securities registered pursuant to Section 12(b) of
the Act:
| Title of each class |
|
Trading Symbol(s) |
|
Name of each exchange on which registered |
| Common
Stock, $0.01 par value |
|
WM |
|
New
York Stock Exchange |
Indicate
by check mark whether the registrant is an emerging growth company as defined in Rule 405 of the Securities Act of 1933 (§230.405
of this chapter) or Rule 12b-2 of the Securities Exchange Act of 1934 (§240.12b-2 of this chapter).
Emerging growth company
¨
If
an emerging growth company, indicate by check mark if the registrant has elected not to use the extended transition period for
complying with any new or revised financial accounting standards provided pursuant to Section 13(a) of the Exchange Act. ¨
| Item 2.02. | Results of Operations and Financial Condition. |
Waste Management, Inc. (the
“Company”) issued a press release today announcing its financial results for the second quarter of 2024, a copy of which is
furnished as Exhibit 99.1 to this Form 8-K. The Company is conducting an audio webcast to discuss these results beginning at 9:00 a.m.
Central Time on July 25, 2024. Listeners can access the live audio webcast by visiting investors.wm.com and
selecting “Events & Presentations” from the website menu. A replay of the audio webcast will be available at the same location.
On the webcast, management
of the Company is expected to discuss certain non-GAAP financial measures. The Company has provided information regarding its use of non-GAAP
measures and reconciliations of such measures to their most comparable GAAP measures in the notes and tables that accompany the press
release.
| Item 7.01. |
Regulation FD Disclosure. |
In
addition to the financial results press release issued today, the Company also published a supplemental presentation on its website at
investors.wm.com to provide additional information about the strategic rationale for its planned acquisition of Stericycle, Inc., a copy
of which is furnished as Exhibit 99.2 to this Form 8-K.
Item 9.01. Financial Statements and Exhibits.
(d) Exhibits
Exhibit Index
SIGNATURES
Pursuant to the requirements
of the Securities Exchange Act of 1934, the registrant has duly caused this report to be signed on its behalf by the undersigned, hereunto
duly authorized.
| |
WASTE MANAGEMENT, INC. |
| |
|
|
| Date: July 24, 2024 |
By: |
/s/
Charles C. Boettcher |
| |
|
Charles C. Boettcher |
| |
|
Executive Vice President, Corporate Development
and Chief Legal Officer |
EXHIBIT
99.1
For
Immediate Release
WM Announces Second Quarter 2024
Earnings
Robust
Growth in the Collection and Disposal Business Powers Strong Operating EBITDA and Margin
The
Company Closed More than $750 Million of Solid Waste Acquisitions Through July
Houston
— Jul. 24,
2024 — WM (NYSE: WM) today announced financial results
for the quarter ended June 30, 2024.
| |
Three
Months Ended |
|
Three
Months Ended |
| |
June
30, 2024
(in
millions, except per share amounts) |
|
June
30, 2023
(in
millions, except per share amounts) |
| |
|
|
|
| |
As
Reported |
As
Adjusted(a) |
|
As
Reported |
As
Adjusted(a) |
| |
|
|
|
|
|
| Revenue |
$5,402 |
$5,402 |
|
$5,119 |
$5,119 |
| |
|
|
|
|
|
| Income
from Operations |
$1,009 |
$1,075 |
|
$944 |
$946 |
| |
|
|
|
|
|
| Operating
EBITDA(b) |
$1,552 |
$1,618 |
|
$1,465 |
$1,467 |
| |
|
|
|
|
|
| Operating
EBITDA Margin |
28.7% |
30.0% |
|
28.6% |
28.7% |
| |
|
|
|
|
|
| Net
Income(c) |
$680 |
$732 |
|
$615 |
$617 |
| |
|
|
|
|
|
| Diluted
EPS |
$1.69 |
$1.82 |
|
$1.51 |
$1.51 |
“Based
on our great performance to start 2024 and our confidence in the strength of our business, after the first quarter we raised our full-year
outlook for adjusted operating EBITDA and free cash flow by $100 million. Our second quarter results are tracking to this higher trajectory
and reflect continued momentum on our pricing programs and cost optimization efforts in our collection and disposal business,”
said Jim Fish, WM’s President and Chief Executive Officer. “Revenue grew by 5.5% this quarter, and our disciplined focus
on leveraging our people, technology and processes to reduce our cost to serve continued to drive margin expansion. Our adjusted operating
EBITDA increased by 10.3%, and margin expanded by 130 basis points resulting in quarterly margin of 30.0% for the first time ever.”(a)
Fish
continued, “We continue to strategically expand our core collection and disposal operations in North America through targeted acquisitions
in new geographies like Long Island, New York and through tuck-in acquisitions in growth markets in Florida, North Carolina, and Arizona.
Looking forward, we are excited about our planned acquisition of Stericycle, and we are progressing through the customary regulatory
reviews. At the same time, we are making significant strides on our sustainability investments, having opened two upgraded recycling
facilities this quarter. In our renewable energy business, we are scheduled to complete a total of five projects in 2024, with an additional
nine projects currently under construction. The momentum is strong, and we remain focused on execution.”
FOR
MORE
INFORMATION
Waste
Management
Web site
www.wm.com
Analysts
Ed
Egl
713.265.1656
eegl@wm.com
Media
Toni
Werner
media@wm.com
KEY
HIGHLIGHTS FOR THE SECOND QUARTER of 2024
| · | Total
Company revenue grew 5.5%, driven primarily by core price of 6.8% and increases in the value
of the recycled commodities the Company sells.(d) |
| · | Collection
and Disposal yield was 4.6%, and Collection and Disposal volume declined 0.3%.(e) |
| · | Operating
expenses as a percentage of revenue improved 130 basis points to 60.9% compared to prior
year. This improvement was driven by benefits from price and cost optimization efforts. |
| · | SG&A
expenses were 9.3% of revenue, or 9.1% of revenue on an adjusted basis and flat with the
prior year.(a) |
| · | Total
Company adjusted operating EBITDA grew 10.3% to $1.62 billion, and margin expanded 130 basis
points to 30.0% on an adjusted basis.(a) |
| · | Operating
EBITDA in the Company’s Collection and Disposal business grew $200 million to $1.83
billion, and margin expanded to 37.3%. Adjusted operating EBITDA in the Company’s Collection
and Disposal business grew $203 million to $1.84 billion, and margin expanded to 37.3%.(a)
|
| · | Operating
EBITDA in the Recycling Processing & Sales and WM Renewable Energy businesses grew 20.8%,
in line with expectations, driven by higher market prices for recycled and renewable energy
commodities, partially offset by temporary shutdown costs associated with recycling facility
upgrades.(e)(f) |
| · | In
the first half of the year, net cash provided by operating activities increased 21.6% to
$2.52 billion compared to the same period in 2023 driven by the Company’s strong operating
EBITDA growth combined with working capital benefits. |
| · | In
the first half of the year, free cash flow before investments in high-return sustainability
projects grew 41.1% to $1.63 billion. The Company continues to progress its sustainability
growth portfolio with investments in an industry-leading network of renewable natural gas
projects and recycling assets. Total Company free cash flow in the first half of the year,
including these investments, grew 32.3% to $1.24 billion.(a) |
| · | The
Company’s strong first half performance is on track to achieve the increased full-year
outlook provided in April for adjusted operating EBITDA of between $6.375 and $6.525 billion
and for free cash flow including sustainability growth investments of between $2.0 and $2.15
billion.(a)(g) |
| · | In
conjunction with its second quarter earnings materials, the Company has published additional
information elaborating on the strategic rationale and expected financial benefits from its
planned acquisition of Stericycle in a supplemental presentation on our investor website.(h) |
| | | |
| Fish concluded, “We are pleased with the progress we've made on our strategic priorities so far in 2024. Our team continues to exceed the high expectations we have set. With our strong performance in the first half of the year, we are confident that we are on track to meet or exceed the midpoint of our full-year financial outlook that we provided in April.” |
| (a) | The
information labeled as adjusted in this press release, as well as free cash flow, are non-GAAP
measures. Please see “Non-GAAP Financial Measures” below and the reconciliations
in the accompanying schedules for more information. |
| (b) | Management
defines operating EBITDA as GAAP income from operations before depreciation and amortization;
this measure may not be comparable to similarly titled measures reported by other companies. |
| (c) | For
purposes of this press release, all references to “Net income” refer to the financial
statement line item “Net income attributable to Waste Management, Inc.” |
| (d) | Core
price is a performance metric used by management to evaluate the effectiveness of our pricing
strategies; it is not derived from our financial statements and may not be comparable to
measures presented by other companies. Core price is based on certain historical assumptions,
which may differ from actual results, to allow for comparability between reporting periods
and to reveal trends in results over time. |
| (e) | In
the fourth quarter of 2023, the Company updated its reportable segments to enhance transparency
regarding its financial performance and underscore its commitment to sustainability through
substantial planned and ongoing investments in its Recycling Processing and Sales and WM Renewable
Energy businesses. The Company reports through four segments, referred to as (i) Collection
and Disposal – East Tier; (ii) Collection and Disposal – West Tier; (iii) Recycling
Processing and Sales and (iv) WM Renewable Energy. The Company’s East and
West Tiers along with certain ancillary services not managed through our Tier segments form
its “Collection and Disposal” business. |
| (f) | The
Company’s blended average single stream recycled commodity price was about $96 per
ton compared to about $61 per ton in the prior year period, and the full-year expectation
for pricing has increased to approximately $90 per ton from approximately $80 per ton. The
average value of Renewable Fuel Standard credits was $3.11 compared to $2.03 in the prior
year period, and the average natural gas price was $1.64 per MMBtu compared to $2.20 per
MMBtu in the prior year period. The average electricity price was about $64 per megawatt
hour compared to about $62 per megawatt hour in the prior year period. |
| (g) | The
Company's financial outlook includes the impact of the $750 million of closed acquisitions
but excludes any potential impact from its planned acquisition of Stericycle. |
| (h) | The
Company may announce information using SEC filings, press releases, public conference calls,
webcasts, and the investors.wm.com page of its website. It is possible that information posted
on such website (including the supplemental presentation referenced in this press release)
could be deemed to be material information, and management encourages investors, other stakeholders
and the media to review the information posted to its website. Except to the extent explicitly
stated otherwise, documents and information on the Company’s website are not incorporated
herein by reference. |
| |
| |
| The
Company will host a conference call at 10 a.m. ET on July 25, 2024 to discuss the second quarter 2024 results. Information contained
within this press release will be referenced and should be considered in conjunction with the call. |
| |
| Listeners
can access a live audio webcast of the conference call by visiting investors.wm.com and selecting “Events & Presentations”
from the website menu. A replay of the audio webcast will be available at the same location following the conclusion of the call. |
| |
| Conference
call participants should register to obtain their dial in and passcode details. This streamlined process improves security and eliminates
wait times when joining the call. |
| |
| |
| about
wm |
| WM
(WM.com) is North America's leading provider of comprehensive environmental solutions. Previously known as Waste Management
and based in Houston, Texas, WM is driven by commitments to put people first and achieve success with integrity. The company, through
its subsidiaries, provides collection, recycling and disposal services to millions of residential, commercial, industrial and municipal
customers throughout the U.S. and Canada. With innovative infrastructure and capabilities in recycling, organics and renewable energy,
WM provides environmental solutions to and collaborates with its customers in helping them achieve their sustainability goals. WM has
the largest disposal network and collection fleet in North America, is the largest recycler of post-consumer materials and is the
leader in beneficial use of landfill gas, with a growing network of renewable natural gas plants and the most landfill gas-to-electricity
plants in North America. WM's fleet includes more than 12,000 natural gas trucks – the largest heavy-duty natural gas truck
fleet of its kind in North America. To learn more about WM and the company's sustainability progress and solutions, visit Sustainability.WM.com. |
Forward-Looking
Statements
The
Company, from time to time, provides estimates or projections of financial and other data, comments on expectations relating to future
periods and makes statements of opinion, view or belief about current and future events, circumstances or performance. This press release
contains a number of such forward-looking statements, including all statements regarding future performance or financial results of our
business; achievement of financial outlook; growth and margin expansion; drivers of performance, including pricing, cost optimization
and cost reduction and other initiatives; results from acquisitions; consummation of the Stericycle acquisition and obtaining regulatory
approvals; and timing of sustainability investments and project completions and related results. You should view these statements with
caution. They are based on the facts and circumstances known to the Company as of the date the statements are made. These forward-looking
statements are subject to risks and uncertainties that could cause actual results to be materially different from those set forth in
such forward-looking statements, including but not limited to failure to implement our optimization, automation, growth, and cost savings
initiatives and overall business strategy; failure to obtain the results anticipated from strategic initiatives, investments, acquisitions,
including the planned Stericycle acquisition, or new lines of business; failure to identify acquisition targets, consummate and integrate
acquisitions, including our planned integration of Stericycle; our ability to consummate and finance the Stericycle acquisition and achieve
the anticipated benefits therefrom, including cost synergies; legal, regulatory and other matters that may affect the costs and timing
of our ability to complete, integrate and deliver all of the expected benefits of the planned Stericycle acquisition; environmental and
other regulations, including developments related to emerging contaminants, gas emissions, renewable energy, extended producer responsibility
and our natural gas fleet; significant environmental, safety or other incidents resulting in liabilities or brand damage; failure to
obtain and maintain necessary permits due to land scarcity, public opposition or otherwise; diminishing landfill capacity, resulting
in increased costs and the need for disposal alternatives; failure to attract, hire and retain key team members and a high quality workforce;
increases in labor costs due to union organizing activities or changes in wage and labor related regulations; disruption and costs resulting
from severe weather and destructive climate events; failure to achieve our sustainability goals or execute on our sustainability-related
strategy and initiatives, including within planned timelines or anticipated budgets due to disruptions, delays, cost increases or changes
in environmental or tax regulations; focus on, and regulation of, environmental and sustainability-related disclosures, which could lead
to increased costs, risk of non-compliance, brand damage and litigation risk related to our sustainability efforts; macroeconomic conditions,
geopolitical conflict and large-scale market disruption resulting in labor, supply chain and transportation constraints, inflationary
cost pressures and fluctuations in commodity prices, fuel and other energy costs; increased competition; pricing actions; impacts from
international trade restrictions; competitive disposal alternatives, diversion of waste from landfills and declining waste volumes; weakness
in general economic conditions and capital markets, including potential for an economic recession; instability of financial institutions;
adoption of new tax legislation; fuel shortages; failure to develop and protect new technology; failure of technology to perform as expected;
failure to prevent, detect and address cybersecurity incidents or comply with privacy regulations; inability to adapt and manage the
benefits and risks of artificial intelligence; negative outcomes of litigation or governmental proceedings; and decisions or developments
that result in impairment charges. Please also see the Company’s filings with the SEC, including Part I, Item 1A of the Company’s
most recently filed Annual Report on Form 10-K, as updated by subsequent Quarterly Reports on Form 10-Q, for additional information regarding
these and other risks and uncertainties applicable to its business. The Company assumes no obligation to update any forward-looking statement,
including financial estimates and forecasts, whether as a result of future events, circumstances or developments or otherwise.
Non-GAAP
Financial Measures
To
supplement its financial information, the Company has presented, and/or may discuss on the conference call, adjusted earnings per diluted
share, adjusted net income, adjusted income from operations, adjusted operating EBITDA and margin, adjusted SG&A expenses and free
cash flow. All of these items are non-GAAP financial measures, as defined in Regulation G of the Securities Exchange Act of 1934, as
amended. The Company reports its financial results in compliance with GAAP but believes that also discussing non-GAAP measures provides
investors with (i) financial measures the Company uses in the management of its business and (ii) additional, meaningful comparisons
of current results to prior periods’ results by excluding items that the Company does not believe reflect its fundamental business
performance and are not representative or indicative of its results of operations.
In
addition, the Company’s projected future operating EBITDA and margin is anticipated to exclude the effects of other events or circumstances
that are not representative or indicative of the Company’s results of operations. Such excluded items are not currently determinable,
but may be significant, such as asset impairments and one-time items, charges, gains or losses from divestitures or litigation, and other
items. Due to the uncertainty of the likelihood, amount and timing of any such items, the Company does not have
information
available to provide a quantitative reconciliation of such projection to the comparable GAAP measure.
The
Company discusses free cash flow and provides a projection of free cash flow because the Company believes that it is indicative of its
ability to pay its quarterly dividends, repurchase common stock, fund acquisitions and other investments and, in the absence of refinancings,
to repay its debt obligations. Free cash flow is not intended to replace “Net cash provided by operating activities,” which
is the most comparable GAAP measure. The Company believes free cash flow gives investors useful insight into how the Company views its
liquidity, but the use of free cash flow as a liquidity measure has material limitations because it excludes certain expenditures that
are required or that the Company has committed to, such as declared dividend payments and debt service requirements. The Company defines
free cash flow as net cash provided by operating activities, less capital expenditures, plus proceeds from divestitures of businesses
and other assets (net of cash divested); this definition may not be comparable to similarly-titled measures reported by other companies.
The
quantitative reconciliations of non-GAAP measures to the most comparable GAAP measures are included in the accompanying schedules, with
the exception of projected adjusted operating EBITDA and margin. Non-GAAP measures should not be considered a substitute for financial
measures presented in accordance with GAAP.
###
WASTE MANAGEMENT, INC.
CONDENSED CONSOLIDATED STATEMENTS OF OPERATIONS
(In Millions, Except per Share Amounts)
(Unaudited)
| | |
Three Months Ended | | |
Six Months Ended | |
| | |
June 30, | | |
June 30, | |
| | |
2024 | | |
2023 | | |
2024 | | |
2023 | |
| Operating revenues | |
$ | 5,402 | | |
$ | 5,119 | | |
$ | 10,561 | | |
$ | 10,011 | |
| Costs and expenses: | |
| | | |
| | | |
| | | |
| | |
| Operating | |
| 3,291 | | |
| 3,186 | | |
| 6,431 | | |
| 6,272 | |
| Selling, general and administrative | |
| 501 | | |
| 467 | | |
| 992 | | |
| 943 | |
| Depreciation, depletion and amortization | |
| 543 | | |
| 521 | | |
| 1,057 | | |
| 1,026 | |
| Restructuring | |
| — | | |
| 1 | | |
| — | | |
| 4 | |
| (Gain) loss from divestitures, asset impairments and unusual items, net | |
| 58 | | |
| — | | |
| 56 | | |
| (3 | ) |
| | |
| 4,393 | | |
| 4,175 | | |
| 8,536 | | |
| 8,242 | |
| Income from operations | |
| 1,009 | | |
| 944 | | |
| 2,025 | | |
| 1,769 | |
| Other income (expense): | |
| | | |
| | | |
| | | |
| | |
| Interest expense, net | |
| (136 | ) | |
| (125 | ) | |
| (266 | ) | |
| (245 | ) |
| Equity in net income (losses) of unconsolidated entities | |
| 22 | | |
| (12 | ) | |
| 3 | | |
| (23 | ) |
| Other, net | |
| (1 | ) | |
| 2 | | |
| 1 | | |
| 4 | |
| | |
| (115 | ) | |
| (135 | ) | |
| (262 | ) | |
| (264 | ) |
| Income before income taxes | |
| 894 | | |
| 809 | | |
| 1,763 | | |
| 1,505 | |
| Income tax expense | |
| 214 | | |
| 196 | | |
| 376 | | |
| 360 | |
| Consolidated net income | |
| 680 | | |
| 613 | | |
| 1,387 | | |
| 1,145 | |
| Less: Net income (loss) attributable to noncontrolling interests | |
| — | | |
| (2 | ) | |
| (1 | ) | |
| (3 | ) |
| Net income attributable to Waste Management, Inc. | |
$ | 680 | | |
$ | 615 | | |
$ | 1,388 | | |
$ | 1,148 | |
| Basic earnings per common share | |
$ | 1.70 | | |
$ | 1.52 | | |
$ | 3.46 | | |
$ | 2.82 | |
| Diluted earnings per common share | |
$ | 1.69 | | |
$ | 1.51 | | |
$ | 3.44 | | |
$ | 2.81 | |
| Weighted average basic common shares outstanding | |
| 401.3 | | |
| 405.9 | | |
| 401.5 | | |
| 407.4 | |
| Weighted average diluted common shares outstanding | |
| 403.2 | | |
| 407.7 | | |
| 403.3 | | |
| 409.1 | |
WASTE MANAGEMENT, INC.
CONDENSED CONSOLIDATED BALANCE SHEETS
(In Millions)
(Unaudited)
| | |
June 30, | | |
December 31, | |
| | |
2024 | | |
2023 | |
| ASSETS | |
| | | |
| | |
| Current assets: | |
| | | |
| | |
| Cash and cash equivalents | |
$ | 172 | | |
$ | 458 | |
| Receivables, net | |
| 2,980 | | |
| 2,870 | |
| Other | |
| 1,287 | | |
| 476 | |
| Total current assets | |
| 4,439 | | |
| 3,804 | |
| Property and equipment, net | |
| 17,420 | | |
| 16,968 | |
| Goodwill | |
| 9,363 | | |
| 9,254 | |
| Other intangible assets, net | |
| 753 | | |
| 759 | |
| Other | |
| 2,024 | | |
| 2,038 | |
| Total assets | |
$ | 33,999 | | |
$ | 32,823 | |
| LIABILITIES AND EQUITY | |
| | | |
| | |
| Current liabilities: | |
| | | |
| | |
| Accounts payable, accrued liabilities and deferred revenues | |
$ | 3,894 | | |
$ | 3,892 | |
| Current portion of long-term debt | |
| 242 | | |
| 334 | |
| Total current liabilities | |
| 4,136 | | |
| 4,226 | |
| Long-term debt, less current portion | |
| 16,501 | | |
| 15,895 | |
| Other | |
| 5,911 | | |
| 5,806 | |
| Total liabilities | |
| 26,548 | | |
| 25,927 | |
| Equity: | |
| | | |
| | |
| Waste Management, Inc. stockholders’ equity | |
| 7,457 | | |
| 6,903 | |
| Noncontrolling interests | |
| (6 | ) | |
| (7 | ) |
| Total equity | |
| 7,451 | | |
| 6,896 | |
| Total liabilities and equity | |
$ | 33,999 | | |
$ | 32,823 | |
WASTE MANAGEMENT, INC.
CONDENSED CONSOLIDATED STATEMENTS OF CASH
FLOWS
(In Millions)
(Unaudited)
| | |
Six Months Ended | |
| | |
June 30, | |
| | |
2024 | | |
2023 | |
| Cash flows from operating activities: | |
| | | |
| | |
| Consolidated net income | |
$ | 1,387 | | |
$ | 1,145 | |
| Adjustments to reconcile consolidated net income to net cash provided by operating activities: | |
| | | |
| | |
| Depreciation, depletion and amortization | |
| 1,057 | | |
| 1,026 | |
| Other | |
| 166 | | |
| 163 | |
| Change in operating assets and liabilities, net of effects of acquisitions and divestitures | |
| (89 | ) | |
| (260 | ) |
| Net cash provided by operating activities | |
| 2,521 | | |
| 2,074 | |
| Cash flows from investing activities: | |
| | | |
| | |
| Acquisitions of businesses, net of cash acquired | |
| (243 | ) | |
| (118 | ) |
| Capital expenditures | |
| (1,335 | ) | |
| (1,180 | ) |
| Proceeds from divestitures of businesses and other assets, net of cash divested | |
| 58 | | |
| 46 | |
| Other, net | |
| (839 | ) | |
| (87 | ) |
| Net cash used in investing activities | |
| (2,359 | ) | |
| (1,339 | ) |
| Cash flows from financing activities: | |
| | | |
| | |
| New borrowings | |
| 9,180 | | |
| 11,356 | |
| Debt repayments | |
| (8,752 | ) | |
| (11,074 | ) |
| Common stock repurchase program | |
| (262 | ) | |
| (620 | ) |
| Cash dividends | |
| (608 | ) | |
| (572 | ) |
| Exercise of common stock options | |
| 36 | | |
| 25 | |
| Tax payments associated with equity-based compensation transactions | |
| (48 | ) | |
| (28 | ) |
| Other, net | |
| (10 | ) | |
| (6 | ) |
| Net cash used in financing activities | |
| (464 | ) | |
| (919 | ) |
| Effect of exchange rate changes on cash, cash equivalents and restricted cash and cash equivalents | |
| (4 | ) | |
| 2 | |
| (Decrease) increase in cash, cash equivalents and restricted cash and cash equivalents | |
| (306 | ) | |
| (182 | ) |
| Cash, cash equivalents and restricted cash and cash equivalents at beginning of period | |
| 552 | | |
| 445 | |
| Cash, cash equivalents and restricted cash and cash equivalents at end of period | |
$ | 246 | | |
$ | 263 | |
WASTE MANAGEMENT, INC.
SUMMARY DATA SHEET
(In Millions)
(Unaudited)
Operating Revenues by Line of Business
| | |
Three Months Ended | |
| | |
June 30, | |
| | |
2024 | | |
2023 | |
| | |
Gross | | |
Intercompany | | |
Net | | |
Gross | | |
Intercompany | | |
Net | |
| | |
Operating | | |
Operating | | |
Operating | | |
Operating | | |
Operating | | |
Operating | |
| | |
Revenues | | |
Revenues | | |
Revenues | | |
Revenues | | |
Revenues | | |
Revenues | |
| Commercial | |
$ | 1,526 | | |
$ | (196 | ) | |
$ | 1,330 | | |
$ | 1,424 | | |
$ | (168 | ) | |
$ | 1,256 | |
| Industrial | |
| 978 | | |
| (199 | ) | |
| 779 | | |
| 974 | | |
| (192 | ) | |
| 782 | |
| Residential | |
| 886 | | |
| (23 | ) | |
| 863 | | |
| 866 | | |
| (25 | ) | |
| 841 | |
| Other collection | |
| 781 | | |
| (52 | ) | |
| 729 | | |
| 745 | | |
| (56 | ) | |
| 689 | |
| Total collection | |
| 4,171 | | |
| (470 | ) | |
| 3,701 | | |
| 4,009 | | |
| (441 | ) | |
| 3,568 | |
| Landfill | |
| 1,291 | | |
| (418 | ) | |
| 873 | | |
| 1,263 | | |
| (417 | ) | |
| 846 | |
| Transfer | |
| 618 | | |
| (270 | ) | |
| 348 | | |
| 585 | | |
| (265 | ) | |
| 320 | |
| Total Collection and Disposal | |
| 6,080 | | |
| (1,158 | ) | |
| 4,922 | | |
| 5,857 | | |
| (1,123 | ) | |
| 4,734 | |
| Recycling Processing and Sales | |
| 475 | | |
| (70 | ) | |
| 405 | | |
| 394 | | |
| (78 | ) | |
| 316 | |
| WM Renewable Energy | |
| 70 | | |
| (1 | ) | |
| 69 | | |
| 63 | | |
| (1 | ) | |
| 62 | |
| Corporate and Other | |
| 12 | | |
| (6 | ) | |
| 6 | | |
| 14 | | |
| (7 | ) | |
| 7 | |
| Total | |
$ | 6,637 | | |
$ | (1,235 | ) | |
$ | 5,402 | | |
$ | 6,328 | | |
$ | (1,209 | ) | |
$ | 5,119 | |
| | |
Six Months Ended | |
| | |
June 30, | |
| | |
2024 | | |
2023 | |
| | |
Gross | | |
Intercompany | | |
Net | | |
Gross | | |
Intercompany | | |
Net | |
| | |
Operating | | |
Operating | | |
Operating | | |
Operating | | |
Operating | | |
Operating | |
| | |
Revenues | | |
Revenues | | |
Revenues | | |
Revenues | | |
Revenues | | |
Revenues | |
| Commercial | |
$ | 3,027 | | |
$ | (381 | ) | |
$ | 2,646 | | |
$ | 2,836 | | |
$ | (329 | ) | |
$ | 2,507 | |
| Industrial | |
| 1,912 | | |
| (386 | ) | |
| 1,526 | | |
| 1,907 | | |
| (369 | ) | |
| 1,538 | |
| Residential | |
| 1,762 | | |
| (45 | ) | |
| 1,717 | | |
| 1,720 | | |
| (50 | ) | |
| 1,670 | |
| Other collection | |
| 1,532 | | |
| (105 | ) | |
| 1,427 | | |
| 1,434 | | |
| (106 | ) | |
| 1,328 | |
| Total collection | |
| 8,233 | | |
| (917 | ) | |
| 7,316 | | |
| 7,897 | | |
| (854 | ) | |
| 7,043 | |
| Landfill | |
| 2,468 | | |
| (803 | ) | |
| 1,665 | | |
| 2,413 | | |
| (808 | ) | |
| 1,605 | |
| Transfer | |
| 1,178 | | |
| (521 | ) | |
| 657 | | |
| 1,125 | | |
| (516 | ) | |
| 609 | |
| Total Collection and Disposal | |
| 11,879 | | |
| (2,241 | ) | |
| 9,638 | | |
| 11,435 | | |
| (2,178 | ) | |
| 9,257 | |
| Recycling Processing and Sales | |
| 911 | | |
| (138 | ) | |
| 773 | | |
| 768 | | |
| (158 | ) | |
| 610 | |
| WM Renewable Energy | |
| 140 | | |
| (2 | ) | |
| 138 | | |
| 133 | | |
| (2 | ) | |
| 131 | |
| Corporate and Other | |
| 24 | | |
| (12 | ) | |
| 12 | | |
| 26 | | |
| (13 | ) | |
| 13 | |
| Total | |
$ | 12,954 | | |
$ | (2,393 | ) | |
$ | 10,561 | | |
$ | 12,362 | | |
$ | (2,351 | ) | |
$ | 10,011 | |
WASTE MANAGEMENT, INC.
SUMMARY DATA SHEET
(In Millions)
(Unaudited)
Internal Revenue Growth
| |
|
Period-to-Period Change for the |
|
|
|
Period-to-Period Change for the |
|
| |
|
Three Months Ended |
|
|
|
Six Months Ended |
|
| |
|
June 30, 2024 vs. 2023 |
|
|
|
June 30, 2024 vs. 2023 |
|
| |
|
|
|
|
|
As a % of |
|
|
|
|
|
|
As a % of |
|
|
|
|
|
|
|
As a % of |
|
|
|
|
|
|
|
As a % of |
|
| |
|
|
|
|
|
Related |
|
|
|
|
|
|
Total |
|
|
|
|
|
|
|
Related |
|
|
|
|
|
|
|
Total |
|
| |
|
Amount |
|
|
Business(a) |
|
|
Amount |
|
|
Company(b) |
|
|
|
Amount |
|
|
Business(a) |
|
|
|
Amount |
|
|
Company(b) |
|
| Collection and Disposal |
|
$ |
205 |
|
|
4.6 |
% |
|
|
|
|
|
|
|
|
|
$ |
424 |
|
|
4.8 |
% |
|
|
|
|
|
|
|
|
| Recycling Processing and Sales and WM Renewable Energy(c) |
|
|
67 |
|
|
17.3 |
|
|
|
|
|
|
|
|
|
|
|
127 |
|
|
16.6 |
|
|
|
|
|
|
|
|
|
| Energy surcharge and mandated fees(d) |
|
|
(8 |
) |
|
(3.2 |
) |
|
|
|
|
|
|
|
|
|
|
(36 |
) |
|
(7.4 |
) |
|
|
|
|
|
|
|
|
| Total average yield(e) |
|
|
|
|
|
|
|
|
$ |
264 |
|
|
5.2 |
% |
|
|
|
|
|
|
|
|
|
|
$ |
515 |
|
|
5.1 |
% |
| Volume(f) |
|
|
|
|
|
|
|
|
|
5 |
|
|
0.1 |
|
|
|
|
|
|
|
|
|
|
|
|
3 |
|
|
— |
|
| Internal revenue growth |
|
|
|
|
|
|
|
|
|
269 |
|
|
5.3 |
|
|
|
|
|
|
|
|
|
|
|
|
518 |
|
|
5.1 |
|
| Acquisitions |
|
|
|
|
|
|
|
|
|
18 |
|
|
0.3 |
|
|
|
|
|
|
|
|
|
|
|
|
37 |
|
|
0.4 |
|
| Divestitures |
|
|
|
|
|
|
|
|
|
— |
|
|
— |
|
|
|
|
|
|
|
|
|
|
|
|
(1 |
) |
|
— |
|
| Foreign currency translation |
|
|
|
|
|
|
|
|
|
(4 |
) |
|
(0.1 |
) |
|
|
|
|
|
|
|
|
|
|
|
(4 |
) |
|
— |
|
| Total |
|
|
|
|
|
|
|
|
$ |
283 |
|
|
5.5 |
% |
|
|
|
|
|
|
|
|
|
|
$ |
550 |
|
|
5.5 |
% |
| | |
Period-to-Period Change for the | | |
Period-to-Period Change for the | |
| | |
Three Months Ended | | |
Six Months Ended | |
| | |
June 30, 2024 vs. 2023 | | |
June 30, 2024 vs. 2023 | |
| | |
As a % of Related Business(a) | | |
As a % of Related Business(a) | |
| | |
Yield | | |
Volume | | |
Yield | | |
Volume(g) | |
| Commercial | |
| 6.5 | % | |
| 1.3 | % | |
| 6.6 | % | |
| 1.0 | % |
| Industrial | |
| 4.8 | | |
| (4.3 | ) | |
| 5.3 | | |
| (4.1 | ) |
| Residential | |
| 6.5 | | |
| (3.3 | ) | |
| 6.4 | | |
| (3.1 | ) |
| Total collection | |
| 5.7 | | |
| (1.7 | ) | |
| 5.9 | | |
| (1.7 | ) |
| Landfill | |
| 1.4 | | |
| 2.6 | | |
| 1.9 | | |
| 3.0 | |
| Transfer | |
| 4.9 | | |
| 3.6 | | |
| 5.2 | | |
| 3.3 | |
| Total collection and disposal | |
| 4.6 | % | |
| (0.3 | )% | |
| 4.8 | % | |
| — | % |
| (a) | Calculated by dividing the increase or decrease for the current year period by the prior year period’s
related business revenue adjusted to exclude the impacts of divestitures for the current year period. |
| (b) | Calculated by dividing the increase or decrease for the current year period by the prior year
period’s total Company revenue adjusted to exclude the impacts of divestitures for the current year period. |
| (c) | Includes combined impact of commodity price variability in both our Recycling Processing and Sales and
WM Renewable Energy segments, as well as changes in certain recycling fees charged by our collection and disposal operations. |
| (d) | Our energy surcharge was revised in the second quarter of 2023 to incorporate market prices for both diesel
and compressed natural gas (“CNG”). |
| (e) | The amounts reported herein represent the changes in our revenue attributable to average yield for the
total Company. |
| (f) | Includes activities from our Corporate and Other businesses. |
| (g) | Workday adjusted volume impact. |
WASTE MANAGEMENT, INC.
SUMMARY DATA SHEET
(In Millions)
(Unaudited)
Free Cash Flow(a)
| | |
Three Months Ended | | |
Six Months Ended | |
| | |
June 30, | | |
June 30, | |
| | |
2024 | | |
2023 | | |
2024 | | |
2023 | |
| Net cash provided by operating activities | |
$ | 1,154 | | |
$ | 1,030 | | |
$ | 2,521 | | |
$ | 2,074 | |
| Capital expenditures, excluding sustainability growth investments | |
| (445 | ) | |
| (459 | ) | |
| (947 | ) | |
| (963 | ) |
| Proceeds from divestitures of businesses and other assets, net of cash divested | |
| 43 | | |
| 35 | | |
| 58 | | |
| 46 | |
| Free cash flow without sustainability growth investments | |
| 752 | | |
| 606 | | |
| 1,632 | | |
| 1,157 | |
| Capital expenditures - sustainability growth investments | |
| (222 | ) | |
| (61 | ) | |
| (388 | ) | |
| (217 | ) |
| Free cash flow | |
$ | 530 | | |
$ | 545 | | |
$ | 1,244 | | |
$ | 940 | |
| | |
Three Months Ended | | |
Six Months Ended | |
| | |
June 30, | | |
June 30, | |
| | |
2024 | | |
2023 | | |
2024 | | |
2023 | |
| Supplemental Data | |
| | | |
| | | |
| | | |
| | |
| | |
| | | |
| | | |
| | | |
| | |
| Internalization of waste, based on disposal costs | |
| 69.5 | % | |
| 68.8 | % | |
| 68.9 | % | |
| 68.6 | % |
| | |
| | | |
| | | |
| | | |
| | |
| Landfill depletable tons (in millions) | |
| 32.0 | | |
| 31.8 | | |
| 61.0 | | |
| 61.1 | |
| | |
| | | |
| | | |
| | | |
| | |
| Acquisition Summary(b) | |
| | | |
| | | |
| | | |
| | |
| | |
| | | |
| | | |
| | | |
| | |
| Gross annualized revenue acquired | |
$ | 77 | | |
$ | 93 | | |
$ | 78 | | |
$ | 111 | |
| | |
| | | |
| | | |
| | | |
| | |
| Total consideration, net of cash acquired | |
| 237 | | |
| 84 | | |
| 240 | | |
| 118 | |
| | |
| | | |
| | | |
| | | |
| | |
| Cash paid for acquisitions consummated during the period, net of cash acquired | |
| 231 | | |
| 80 | | |
| 233 | | |
| 111 | |
| | |
| | | |
| | | |
| | | |
| | |
| Cash paid for acquisitions including contingent consideration and other items from prior periods, net of cash acquired | |
| 232 | | |
| 84 | | |
| 250 | | |
| 118 | |
Landfill Depletion and Accretion Expenses:
| | |
Three Months Ended | | |
Six Months Ended | |
| | |
June 30, | | |
June 30, | |
| | |
2024 | | |
2023 | | |
2024 | | |
2023 | |
| Landfill depletion expense: | |
| | | |
| | | |
| | | |
| | |
| Cost basis of landfill assets | |
$ | 162 | | |
$ | 156 | | |
$ | 308 | | |
$ | 298 | |
| Asset retirement costs | |
| 39 | | |
| 32 | | |
| 69 | | |
| 68 | |
| Total landfill depletion expense(c) | |
| 201 | | |
| 188 | | |
| 377 | | |
| 366 | |
| Accretion expense | |
| 33 | | |
| 33 | | |
| 66 | | |
| 65 | |
| Landfill depletion and accretion expense | |
$ | 234 | | |
$ | 221 | | |
$ | 443 | | |
$ | 431 | |
| (a) | The summary of free cash flow has been prepared to highlight and facilitate understanding of the principal
cash flow elements. Free cash flow is not a measure of financial performance under generally accepted accounting principles and is not
intended to replace the consolidated statement of cash flows that was prepared in accordance with generally accepted accounting principles. |
| (b) | Represents amounts associated with business acquisitions consummated during the applicable period except
where noted. |
| (c) | For both the second quarter of 2024 and the six months ended June 30, 2024, the increase in landfill depletion
expense was primarily driven by changes in landfill cost estimates at our landfills, partially offset by the permanent closing of a previously
reopened landfill in our East Tier. |
WASTE MANAGEMENT, INC.
RECONCILIATION OF CERTAIN NON-GAAP MEASURES
(In Millions, Except Per Share Amounts)
(Unaudited)
| | |
Three Months Ended June 30, 2024 | |
| | |
Income from | | |
Pre-tax | | |
Tax | | |
Net | | |
Diluted Per | |
| | |
Operations | | |
Income | | |
Expense | | |
Income(a) | | |
Share Amount | |
| As reported amounts | |
$ | 1,009 | | |
$ | 894 | | |
$ | 214 | | |
$ | 680 | | |
$ | 1.69 | |
| Adjustments: | |
| | | |
| | | |
| | | |
| | | |
| | |
| Stericycle transaction costs | |
| 7 | | |
| 7 | | |
| 1 | | |
| 6 | | |
| 0.01 | |
| Collective bargaining agreement costs | |
| 1 | | |
| 1 | | |
| — | | |
| 1 | | |
| — | |
| Loss from divestitures, asset impairments and unusual items, net(c) | |
| 58 | | |
| 58 | | |
| 13 | | |
| 45 | | |
| 0.12 | |
| As adjusted amounts | |
$ | 1,075 | | |
$ | 960 | | |
$ | 228 | (b) | |
$ | 732 | | |
$ | 1.82 | |
| Depreciation, depletion and amortization | |
| 543 | | |
| | | |
| | | |
| | | |
| | |
| Adjusted operating EBITDA | |
$ | 1,618 | | |
| | | |
| | | |
| | | |
| | |
| | |
| | | |
| | | |
| | | |
| | | |
| | |
| Adjusted operating EBITDA margin | |
| 30.0 | % | |
| | | |
| | | |
| | | |
| | |
| | |
Three Months Ended June 30, 2023 | |
| | |
Income from | | |
Pre-tax | | |
Tax | | |
Net | | |
Diluted Per | |
| | |
Operations | | |
Income | | |
Expense | | |
Income(a) | | |
Share Amount | |
| As reported amounts | |
$ | 944 | | |
$ | 809 | | |
$ | 196 | | |
$ | 615 | | |
$ | 1.51 | |
| Adjustments: | |
| | | |
| | | |
| | | |
| | | |
| | |
| Collective bargaining agreement costs | |
| 1 | | |
| 1 | | |
| — | | |
| 1 | | |
| — | |
| Restructuring | |
| 1 | | |
| 1 | | |
| — | | |
| 1 | | |
| — | |
| As adjusted amounts | |
$ | 946 | | |
$ | 811 | | |
$ | 196 | (b) | |
$ | 617 | | |
$ | 1.51 | |
| Depreciation, depletion and amortization | |
| 521 | | |
| | | |
| | | |
| | | |
| | |
| Adjusted operating EBITDA | |
$ | 1,467 | | |
| | | |
| | | |
| | | |
| | |
| | |
| | | |
| | | |
| | | |
| | | |
| | |
| Adjusted operating EBITDA margin | |
| 28.7 | % | |
| | | |
| | | |
| | | |
| | |
| (a) | For purposes of this press release table, all references to “Net income” refer to the financial
statement line item “Net income attributable to Waste Management, Inc.” |
| (b) | The Company calculates its effective tax rate based on actual dollars. When the effective tax rate is
calculated by dividing the Tax Expense amount in the table above by the Pre-tax Income amount, differences occur due to rounding, as these
items have been rounded in millions. The second quarter 2024 and 2023 adjusted effective tax rates were 23.9% and 24.2%, respectively. |
| (c) | Includes net charges primarily relating to an investment in a waste diversion technology business. |
WASTE MANAGEMENT, INC.
RECONCILIATION OF CERTAIN NON-GAAP MEASURES
(In Millions)
(Unaudited)
| | |
Three Months Ended June 30, 2024 | |
| | |
| | |
Recycling | | |
WM | | |
| | |
| |
| | |
Collection | | |
Processing | | |
Renewable | | |
Corporate | | |
| |
| | |
and Disposal | | |
and Sales | | |
Energy | | |
and Other | | |
Total | |
| Operating revenues, as reported | |
$ | 4,922 | | |
$ | 405 | | |
$ | 69 | | |
$ | 6 | | |
$ | 5,402 | |
| | |
| | | |
| | | |
| | | |
| | | |
| | |
| Income from operations, as reported | |
$ | 1,359 | | |
$ | 29 | | |
$ | 18 | | |
$ | (397 | ) | |
$ | 1,009 | |
| Depreciation, depletion and amortization | |
| 475 | | |
| 31 | | |
| 9 | | |
| 28 | | |
| 543 | |
| Operating EBITDA, as reported | |
$ | 1,834 | | |
$ | 60 | | |
$ | 27 | | |
$ | (369 | ) | |
$ | 1,552 | |
| | |
| | | |
| | | |
| | | |
| | | |
| | |
| Adjustments: | |
| | | |
| | | |
| | | |
| | | |
| | |
| Stericycle transaction costs | |
| — | | |
| — | | |
| — | | |
| 7 | | |
| 7 | |
| Collective bargaining agreement costs | |
| 1 | | |
| — | | |
| — | | |
| — | | |
| 1 | |
| Loss from divestitures, asset impairments and unusual items, net(a) | |
| 3 | | |
| — | | |
| — | | |
| 55 | | |
| 58 | |
| | |
| 4 | | |
| — | | |
| — | | |
| 62 | | |
| 66 | |
| Adjusted operating EBITDA | |
$ | 1,838 | | |
$ | 60 | | |
$ | 27 | | |
$ | (307 | ) | |
$ | 1,618 | |
| | |
| | | |
| | | |
| | | |
| | | |
| | |
| Operating EBITDA margin, as reported | |
| 37.3 | % | |
| 14.8 | % | |
| 39.1 | % | |
| N/A | | |
| 28.7 | % |
| Adjusted operating EBITDA margin | |
| 37.3 | % | |
| 14.8 | % | |
| 39.1 | % | |
| N/A | | |
| 30.0 | % |
| | |
Three Months Ended June 30, 2023 | |
| | |
| | |
Recycling | | |
WM | | |
| | |
| |
| | |
Collection | | |
Processing | | |
Renewable | | |
Corporate | | |
| |
| | |
and Disposal | | |
and Sales | | |
Energy | | |
and Other | | |
Total | |
| Operating revenues, as reported | |
$ | 4,734 | | |
$ | 316 | | |
$ | 62 | | |
$ | 7 | | |
$ | 5,119 | |
| | |
| | | |
| | | |
| | | |
| | | |
| | |
| Income from operations, as reported | |
$ | 1,173 | | |
$ | 24 | | |
$ | 14 | | |
$ | (267 | ) | |
$ | 944 | |
| Depreciation, depletion and amortization | |
| 461 | | |
| 25 | | |
| 9 | | |
| 26 | | |
| 521 | |
| Operating EBITDA, as reported | |
$ | 1,634 | | |
$ | 49 | | |
$ | 23 | | |
$ | (241 | ) | |
$ | 1,465 | |
| | |
| | | |
| | | |
| | | |
| | | |
| | |
| Adjustments: | |
| | | |
| | | |
| | | |
| | | |
| | |
| Collective bargaining agreement costs | |
| 1 | | |
| — | | |
| — | | |
| — | | |
| 1 | |
| Restructuring | |
| — | | |
| — | | |
| — | | |
| 1 | | |
| 1 | |
| | |
| 1 | | |
| — | | |
| — | | |
| 1 | | |
| 2 | |
| Adjusted operating EBITDA | |
$ | 1,635 | | |
$ | 49 | | |
$ | 23 | | |
$ | (240 | ) | |
$ | 1,467 | |
| | |
| | | |
| | | |
| | | |
| | | |
| | |
| Operating EBITDA margin, as reported | |
| 34.5 | % | |
| 15.5 | % | |
| 37.1 | % | |
| N/A | | |
| 28.6 | % |
| Adjusted operating EBITDA margin | |
| 34.5 | % | |
| 15.5 | % | |
| 37.1 | % | |
| N/A | | |
| 28.7 | % |
| (a) | Includes net charges primarily relating to an investment in a waste diversion technology business. |
WASTE MANAGEMENT, INC.
RECONCILIATION OF CERTAIN NON-GAAP MEASURES
(In Millions)
(Unaudited)
| | |
Three Months Ended | |
| | |
June 30, 2024 | | |
June 30, 2023 | |
| | |
| | |
As a % of | | |
| | |
As a % of | |
| | |
Amount | | |
Revenues | | |
Amount | | |
Revenues | |
| Adjusted Operating Expenses and Adjusted Operating Expenses Margin | |
| | | |
| | | |
| | | |
| | |
| | |
| | | |
| | | |
| | | |
| | |
| Operating revenues, as reported | |
$ | 5,402 | | |
| | | |
$ | 5,119 | | |
| | |
| | |
| | | |
| | | |
| | | |
| | |
| Operating expenses, as reported | |
$ | 3,291 | | |
| 60.9 | % | |
$ | 3,186 | | |
| 62.2 | % |
| Adjustment: | |
| | | |
| | | |
| | | |
| | |
| Collective bargaining agreement costs | |
| (1 | ) | |
| | | |
| (1 | ) | |
| | |
| Operating expenses, as adjusted | |
$ | 3,290 | | |
| 60.9 | % | |
$ | 3,185 | | |
| 62.2 | % |
| | |
Three Months Ended | |
| | |
June 30, 2024 | | |
June 30, 2023 | |
| | |
| | |
As a % of | | |
| | |
As a % of | |
| | |
Amount | | |
Revenues | | |
Amount | | |
Revenues | |
| Adjusted SG&A Expenses and Adjusted SG&A Expenses Margin | |
| | | |
| | | |
| | | |
| | |
| | |
| | | |
| | | |
| | | |
| | |
| Operating revenues, as reported | |
$ | 5,402 | | |
| | | |
$ | 5,119 | | |
| | |
| | |
| | | |
| | | |
| | | |
| | |
| SG&A expenses, as reported | |
$ | 501 | | |
| 9.3 | % | |
$ | 467 | | |
| 9.1 | % |
| Adjustment: | |
| | | |
| | | |
| | | |
| | |
| Stericycle transaction costs | |
| (7 | ) | |
| | | |
| — | | |
| | |
| SG&A expenses, as adjusted | |
$ | 494 | | |
| 9.1 | % | |
$ | 467 | | |
| 9.1 | % |
| 2024 Projected Free Cash Flow Reconciliation(a) | |
Scenario 1 | | |
Scenario 2 | |
| Net cash provided by operating activities | |
$ | 5,000 | | |
$ | 5,250 | |
| Capital expenditures to support the business | |
| (2,200 | ) | |
| (2,300 | ) |
| Proceeds from divestitures of businesses and other assets, net of cash divested | |
| 50 | | |
| 100 | |
| Free cash flow without sustainability growth investments | |
$ | 2,850 | | |
$ | 3,050 | |
| Capital expenditures - sustainability growth investments | |
| (850 | ) | |
| (900 | ) |
| Free cash flow | |
$ | 2,000 | | |
$ | 2,150 | |
| (a) | The reconciliation includes two scenarios that illustrate our projected free cash flow range for 2024.
The amounts used in the reconciliation are subject to many variables, some of which are not under our control and, therefore, are not
necessarily indicative of actual results. |
WASTE MANAGEMENT, INC.
SUPPLEMENTAL INFORMATION
PROVIDED FOR ILLUSTRATIVE PURPOSES ONLY
(In Millions)
(Unaudited)
Diversity in the structure
of recycling contracts results in different accounting treatment for commodity rebates. In accordance with revenue recognition guidance,
our Company records gross recycling revenue and records rebates paid to customers as cost of goods sold. Other contract structures allow
for netting of rebates against revenue.
Additionally, there are differences
in whether companies adjust for accretion expense in their calculation of EBITDA. Our Company does not adjust for landfill accretion expenses
when calculating operating EBITDA, while other companies do adjust it for the calculation of their EBITDA measure.
The table below illustrates
the impact that differing contract structures and treatment of accretion expense has on the Company’s adjusted operating EBITDA
margin results. This information has been provided to enhance comparability and is not intended to replace or adjust GAAP reported results.
| | |
Three Months Ended | |
| | |
June 30, 2024 | | |
June 30, 2023 | |
| | |
Amount | | |
Change in
Adjusted
Operating
EBITDA Margin | | |
Amount | | |
Change in
Adjusted
Operating
EBITDA Margin | |
| Recycling commodity rebates | |
$ | 212 | | |
| 1.2 | % | |
$ | 149 | | |
| 0.8 | % |
| Accretion expense | |
$ | 33 | | |
| 0.6 | % | |
$ | 33 | | |
| 0.7 | % |
| | |
Six Months Ended | |
| | |
June 30, 2024 | | |
June 30, 2023 | |
| | |
Amount | | |
Change in
Adjusted
Operating
EBITDA Margin | | |
Amount | | |
Change in
Adjusted
Operating
EBITDA Margin | |
| Recycling commodity rebates | |
$ | 403 | | |
| 1.2 | % | |
$ | 290 | | |
| 0.8 | % |
| Accretion expense | |
$ | 66 | | |
| 0.6 | % | |
$ | 65 | | |
| 0.7 | % |
Exhibit 99.2

CONFIDENTIAL AND PROPRIETARY INFORMATION OF WM WM’s Acquisition of Stericycle – Framing the Strategic Rationale Supplemental Presentation July 24, 2024

CONFIDENTIAL AND PROPRIETARY INFORMATION OF WM This presentation contains a number of forward - looking statements related to WM’s planned acquisition of Stericycle, Inc . , including but not limited to all statements regarding timing and approvals of the planned acquisition ; ability to consummate and finance the acquisition ; method of financing the acquisition ; integration of the acquisition ; future operations or benefits ; future capital allocation ; future business and financial performance of WM and Stericycle and the ability of each company to achieve financial guidance and operational targets ; future leverage ratio ; and all outcomes of the proposed acquisition, including synergies, cost savings, impact on earnings, cash flow growth, free cash flow, rate of return on capital, shareholder returns, strength of the balance sheet and credit ratings . You should view these statements with caution . They are based on the facts and circumstances known to the WM as of the date the statements are made . Such statements generally include words such as “expects,” “intends,” “targets,” “estimates,” “will” or similar expressions . These forward - looking statements are subject to risks and uncertainties that could cause actual results to be materially different . Such risks and uncertainties include, but are not limited to, general economic and capital markets conditions ; inability to obtain required regulatory or government approvals or to obtain such approvals on satisfactory conditions ; inability to obtain stockholder approval or satisfy other closing conditions ; inability to obtain financing ; the occurrence of any event, change or other circumstance that could give rise to the termination of the merger agreement ; unexpected costs, charges or expenses ; failure to successfully integrate the acquisition, realize anticipated benefits and synergies or obtain any other results anticipated ; legal, regulatory and other matters that may affect the costs and timing of WM’s ability to complete, integrate and deliver all of the expected benefits of the acquisition, including any proceedings related to the planned acquisition ; impacts of the announcement of the acquisition on Stericycle’s management, key personnel and business ; and other factors that could cause Stericycle’s business and financial results to be materially different than WM has anticipated, such as, without limitation, decreases in the volume of wastes streams managed ; disruptions resulting from deployment of systems ; changing market conditions in the healthcare industry ; competition and demand for services in the regulated waste and secure information destruction industries ; commodity price volatility ; changes in governmental regulation of the collection, transportation, treatment and disposal of regulated waste or the proper handling and protection of personal and confidential information ; the level of government enforcement of regulations governing regulated waste collection and treatment or the proper handling and protection of personal and confidential information ; and the outcome of pending, future or settled litigation or investigations . For further discussion of risks and uncertainties applicable to WM and Stericycle, please see WM’s and Stericycle’s filings with the SEC, including Part I, Item 1 A of each company’s most recently filed Annual Report on Form 10 - K and subsequent reports on Form 10 - Q, which are incorporated herein by reference, and in other documents that WM or Stericycle file or furnish with the SEC . Unless otherwise specified, WM’s expectations, estimates and projections are as of July 24 , 2024 , the date of this presentation, and are subject to change . As noted herein, certain projections are based on Stericycle’s first quarter 2024 Investor Presentation dated April 25 , 2024 . Stericycle has not updated or confirmed its financial outlook since that date . Additional information and cautionary statements about reliance on such projections is also included in such Investor Presentation and available at investors . stericycle . com . Except as required by applicable law, WM assumes no obligation to update any forward - looking statement . 2 Cautionary Statement - Forward - Looking Statements and Projections
CONFIDENTIAL AND PROPRIETARY INFORMATION OF WM WM’s Operating EBITDA and Adjusted Operating EBITDA : This presentation refers to operating EBITDA of WM . WM defines operating EBITDA as GAAP income from operations before depreciation, depletion, and amortization . WM’s operating EBITDA has been, and in the future is expected to be, adjusted to exclude the effects of events or circumstances that are not representative or indicative of the Company’s results of operations . Adjusted operating EBITDA is a non - GAAP measure . Stericycle’s EBITDA and Adjusted EBITDA : This presentation refers to EBITDA and adjusted EBITDA of Stericycle . Stericycle defines EBITDA as GAAP income from operations before depreciation and intangible amortization . Adjusted EBITDA, which excludes the impact of certain items, is a non - GAAP measure . Stericycle’s Free Cash Flow Conversion : This presentation includes free cash flow conversion of Stericycle . Stericycle defines free cash flow as net cash from operating activities less capital expenditures . Free cash flow is a non - GAAP measure . Free cash flow conversion of Stericycle is calculated as free cash flow as a percentage of adjusted EBITDA . Leverage Ratio : All terms used in the calculation of leverage ratio in this presentation are defined in WM’s $ 3 . 5 billion Revolving Credit Agreement filed with the SEC on Form 8 - K on May 10 , 2024 . Each of the definitions provided above may not be comparable to similarly titled measures reported by other companies . Non - GAAP measures are meant to supplement, not replace, comparable GAAP measures . For additional information about WM’s and Stericycle’s use of non - GAAP measures and reconciliations to the most comparable GAAP measures for prior financial results, please see WM’s quarterly earnings results press releases and tables thereto, available at investors . wm . com, and Stericycle’s quarterly earnings results press releases and tables thereto, and Stericycle’s first quarter 2024 Investor Presentation dated April 25 , 2024 , available at investors . stericycle . com . Projected future non - GAAP results are expected to exclude the effects of events or circumstances that management believes are not representative or indicative of future results of operations . Such excluded items are not currently determinable, but may be significant, such as asset impairments and one - time items, charges, gains or losses from divestitures or litigation, and other items . Due to the uncertainty of the likelihood, amount and timing of any such items, WM does not have information available to provide a quantitative reconciliation of non - GAAP projections to the comparable GAAP measure . 3 Cautionary Statement - Non - GAAP Financial Measures
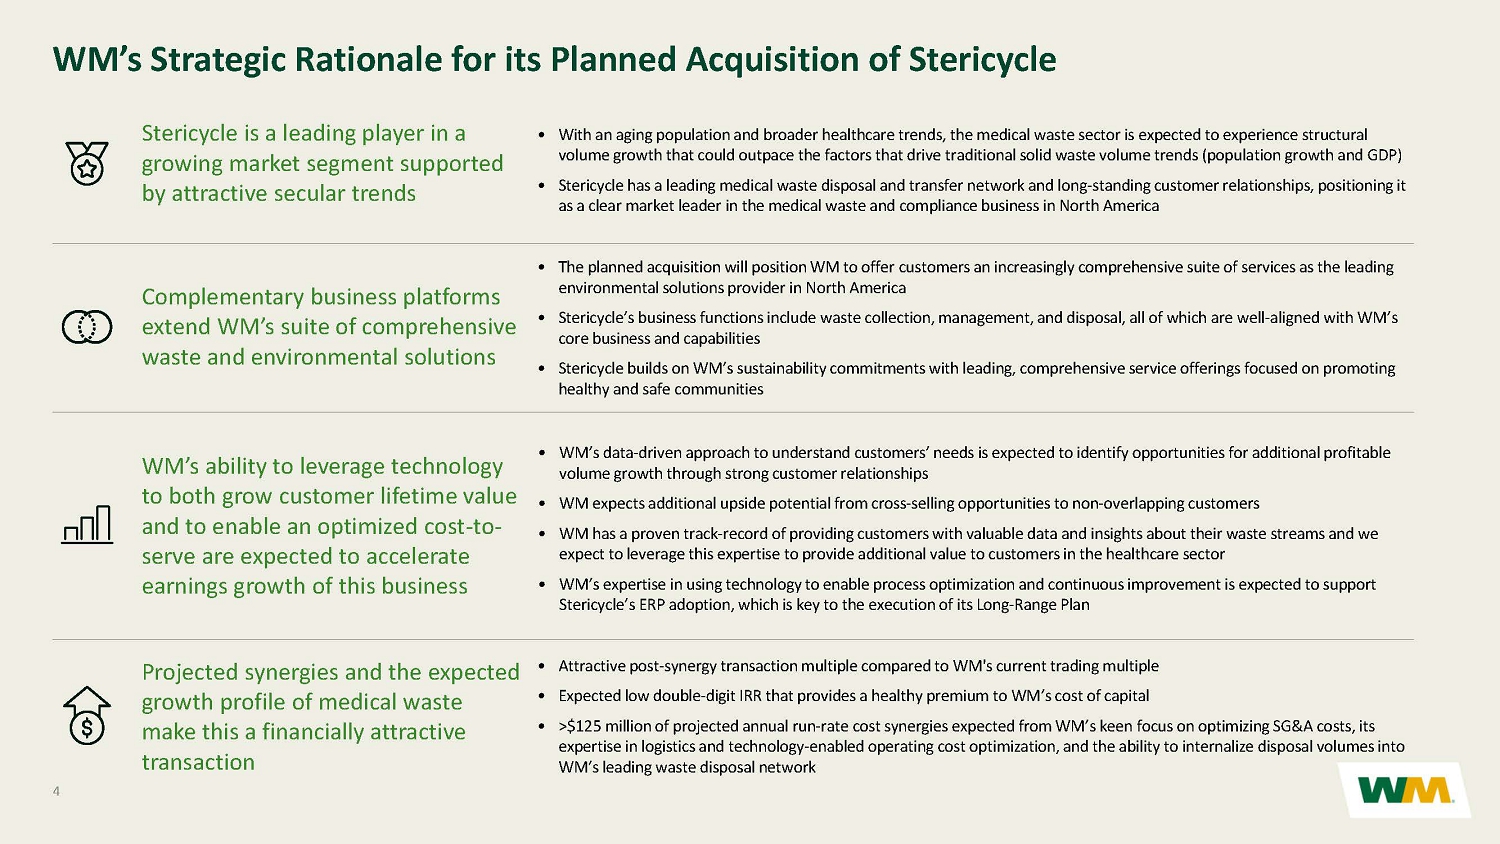
CONFIDENTIAL AND PROPRIETARY INFORMATION OF WM CONFIDENTIAL AND PROPRIETARY INFORMATION OF WM WM’s Strategic Rationale for its Planned Acquisition of Stericycle • With an aging population and broader healthcare trends, the medical waste sector is expected to experience structural volume growth that could outpace the factors that drive traditional solid waste volume trends (population growth and GDP) • Stericycle has a leading medical waste disposal and transfer network and long - standing customer relationships, positioning it as a clear market leader in the medical waste and compliance business in North America Stericycle is a leading player in a growing market segment supported by attractive secular trends • The planned acquisition will position WM to offer customers an increasingly comprehensive suite of services as the leading environmental solutions provider in North America • Stericycle’s business functions include waste collection, management, and disposal, all of which are well - aligned with WM’s core business and capabilities • Stericycle builds on WM’s sustainability commitments with leading, comprehensive service offerings focused on promoting healthy and safe communities Complementary business platforms extend WM’s suite of comprehensive waste and environmental solutions WM’s ability to leverage technology to both grow customer lifetime value and to enable an optimized cost - to - serve are expected to accelerate earnings growth of this business • Attractive post - synergy transaction multiple compared to WM's current trading multiple • Expected low double - digit IRR that provides a healthy premium to WM’s cost of capital • >$125 million of projected annual run - rate cost synergies expected from WM’s keen focus on optimizing SG&A costs, its expertise in logistics and technology - enabled operating cost optimization, and the ability to internalize disposal volumes into WM’s leading waste disposal network Projected synergies and the expected growth profile of medical waste make this a financially attractive transaction 4 • WM’s data - driven approach to understand customers’ needs is expected to identify opportunities for additional profitable volume growth through strong customer relationships • WM expects additional upside potential from cross - selling opportunities to non - overlapping customers • WM has a proven track - record of providing customers with valuable data and insights about their waste streams and we expect to leverage this expertise to provide additional value to customers in the healthcare sector • WM’s expertise in using technology to enable process optimization and continuous improvement is expected to support Stericycle’s ERP adoption, which is key to the execution of its Long - Range Plan
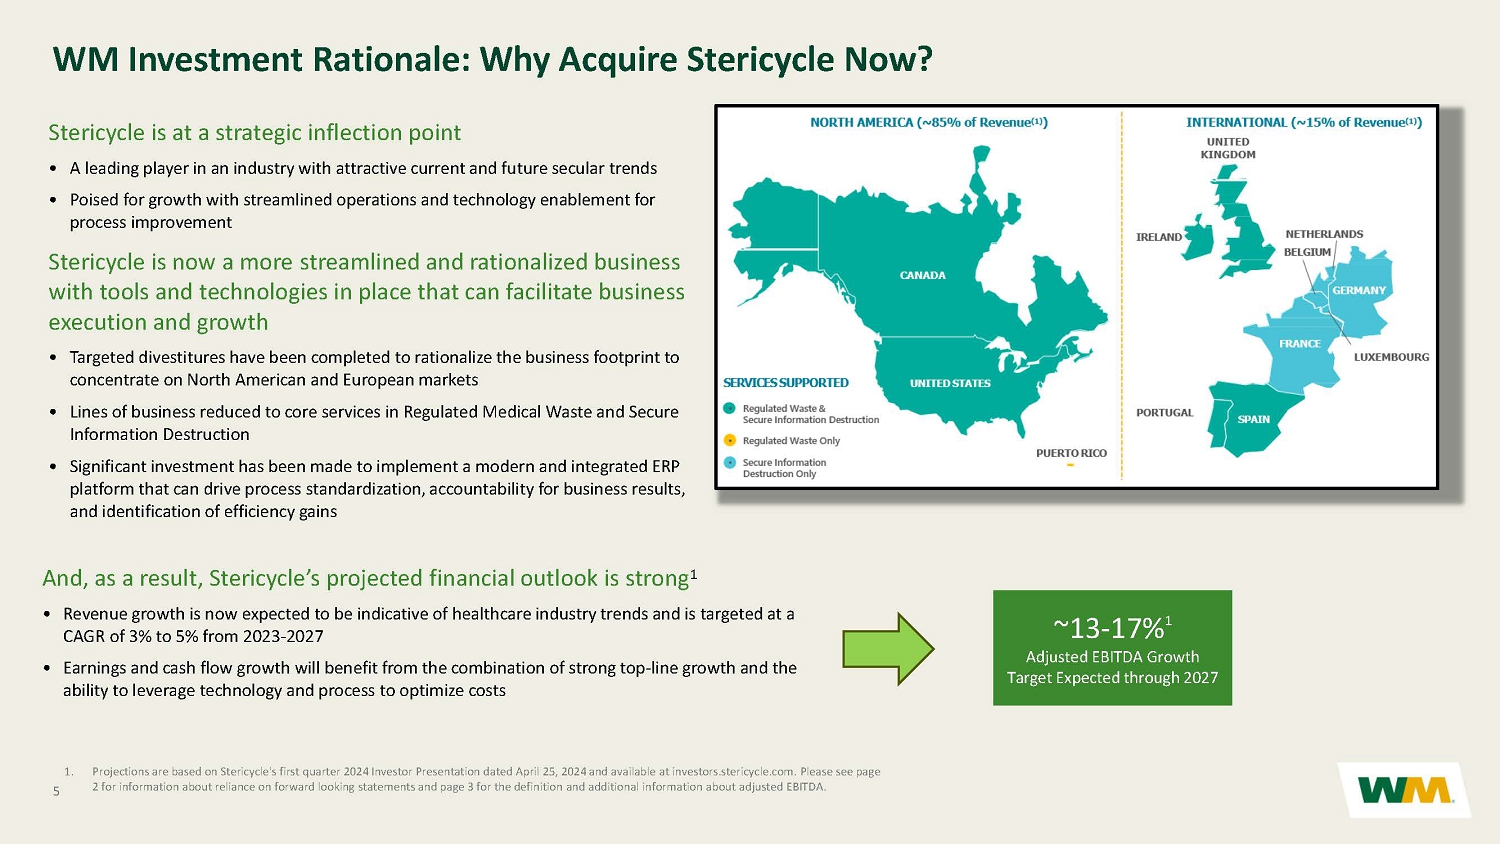
CONFIDENTIAL AND PROPRIETARY INFORMATION OF WM CONFIDENTIAL AND PROPRIETARY INFORMATION OF WM Stericycle is at a strategic inflection point • A leading player in an industry with attractive current and future secular trends • Poised for growth with streamlined operations and technology enablement for process improvement Stericycle is now a more streamlined and rationalized business with tools and technologies in place that can facilitate business execution and growth • Targeted divestitures have been completed to rationalize the business footprint to concentrate on North American and European markets • Lines of business reduced to core services in Regulated Medical Waste and Secure Information Destruction • Significant investment has been made to implement a modern and integrated ERP platform that can drive process standardization, accountability for business results, and identification of efficiency gains 5 WM Investment Rationale: Why Acquire Stericycle Now? ~13 - 17% 1 Adjusted EBITDA Growth Target Expected through 2027 1. Projections are based on Stericycle's first quarter 2024 Investor Presentation dated April 25, 2024 and available at investor s.s tericycle.com. Please see page 2 for information about reliance on forward looking statements and page 3 for the definition and additional information about ad justed EBITDA. And, as a result, Stericycle’s projected financial outlook is strong 1 • Revenue growth is now expected to be indicative of healthcare industry trends and is targeted at a CAGR of 3% to 5% from 2023 - 2027 • Earnings and cash flow growth will benefit from the combination of strong top - line growth and the ability to leverage technology and process to optimize costs

CONFIDENTIAL AND PROPRIETARY INFORMATION OF WM CONFIDENTIAL AND PROPRIETARY INFORMATION OF WM 6 Transaction Summary • WM to pay $62 per share in cash • 24% premium over 60 - day volume weighted average price as of May 23, 2024 • Represents a total enterprise value of $7.2bn, reflecting a post - synergy EBITDA multiple of about 13x Financial Terms • Strengthens WM’s long - term growth potential and sustainability commitments • Expected to be accretive to WM’s operating EBITDA and cash flows within one year of close Financial impact and benefits • The transaction is not subject to a financing condition • WM intends to finance the transaction using a combination of bank debt and senior notes • In the near term, following completion of the transaction, WM expects a leverage ratio of approximately 3.6x • WM expects to achieve a leverage ratio within its targeted range of 2.75x to 3.0x approximately 24 months after closing the t ran saction • Upon achieving its targeted leverage ratio, WM expects to resume share repurchases Balance sheet and financing • Expected to close as early as the fourth quarter of 2024 • Subject to the satisfaction of customary closing conditions, including regulatory approvals and approval by a majority of the ho lders of Stericycle’s outstanding common shares Timing and closing Note: Please see page 3 for definitions and additional information about EBITDA, operating EBITDA, and leverage ratio. The re vis ion in projected leverage from WM’s press release announcing the planned acquisition on June 3, 2024, which indicated a post - close leverage of 3.4x and an 18 - month return to the targeted le verage range, relates to incremental indebtedness incurred to fund a solid waste acquisition completed in July 2024.

CONFIDENTIAL AND PROPRIETARY INFORMATION OF WM 7 Overview of Stericycle Based on Stericycle’s 2023 Form 10 - K and its first quarter 2024 Investor Presentation dated April 25, 2024. Items available at i nvestors.stericycle.com. Additional information and cautionary statements about reliance on projections is included on page 2 and in the referenced St eri cycle Investor Presentation.
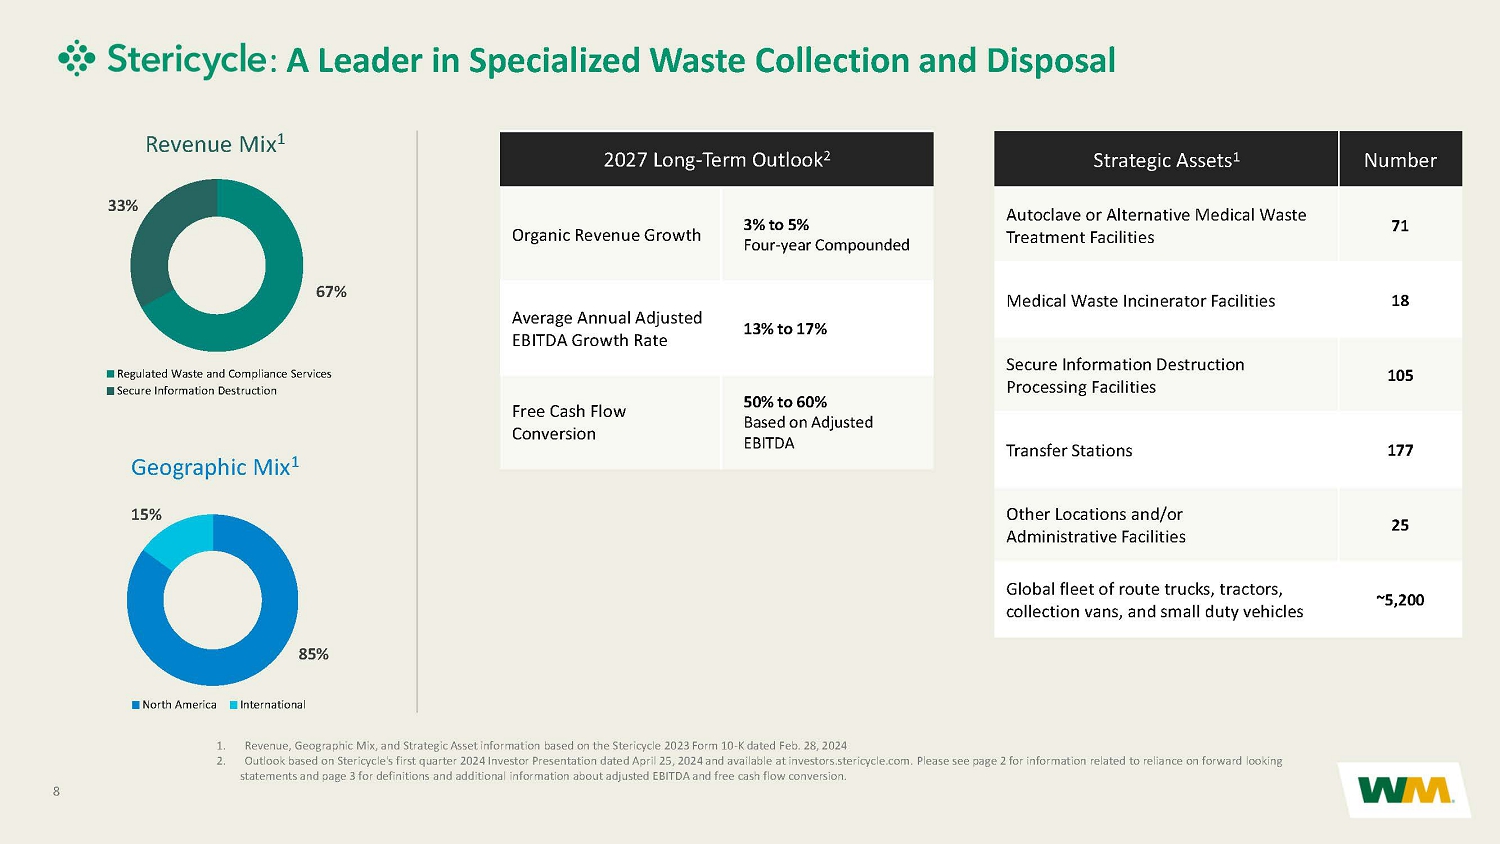
CONFIDENTIAL AND PROPRIETARY INFORMATION OF WM CONFIDENTIAL AND PROPRIETARY INFORMATION OF WM 85% 15% North America International 8 2027 Long - Term Outlook 2 Organic Revenue Growth 3% to 5% Four - year Compounded Average Annual Adjusted EBITDA Growth Rate 13% to 17% Free Cash Flow Conversion 50% to 60% Based on Adjusted EBITDA Strategic Assets 1 Number Autoclave or Alternative Medical Waste Treatment Facilities 71 Medical Waste Incinerator Facilities 18 Secure Information Destruction Processing Facilities 105 Transfer Stations 177 Other Locations and/or Administrative Facilities 25 Global fleet of route trucks, tractors, collection vans, and small duty vehicles ~5,200 Revenue Mix 1 67% 33% Regulated Waste and Compliance Services Secure Information Destruction Geographic Mix 1 : A Leader in Specialized Waste Collection and Disposal 1. Revenue, Geographic Mix, and Strategic Asset information based on the Stericycle 2023 Form 10 - K dated Feb. 28, 2024 2. Outlook based on Stericycle's first quarter 2024 Investor Presentation dated April 25, 2024 and available at investors.steric ycl e.com. Please see page 2 for information related to reliance on forward looking statements and page 3 for definitions and additional information about adjusted EBITDA and free cash flow conversion.
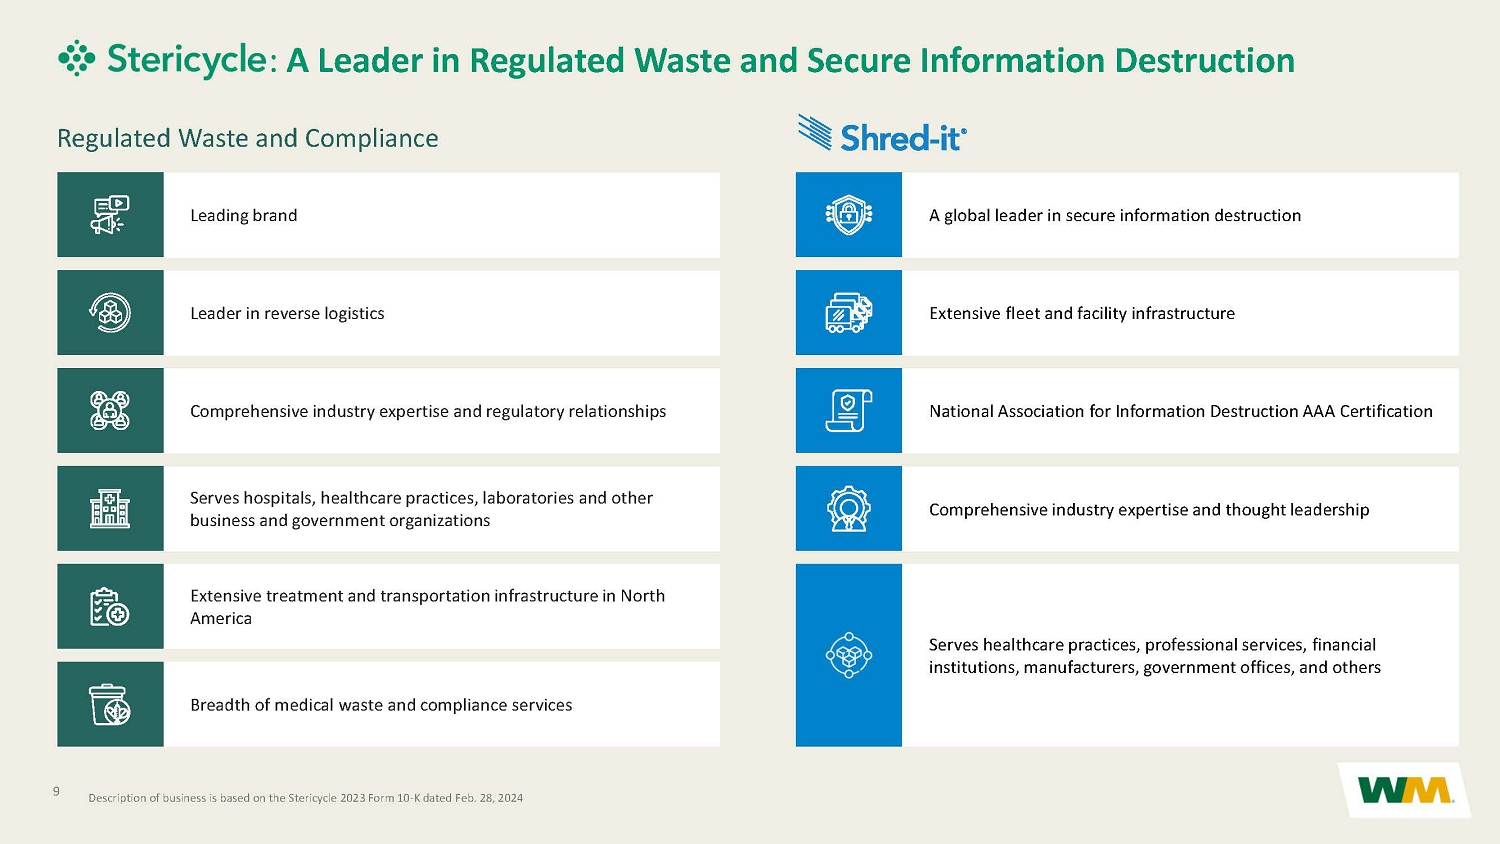
CONFIDENTIAL AND PROPRIETARY INFORMATION OF WM CONFIDENTIAL AND PROPRIETARY INFORMATION OF WM 9 : A Leader in Regulated Waste and Secure Information Destruction Leading brand Leader in reverse logistics Comprehensive industry expertise and regulatory relationships Serves hospitals, healthcare practices, laboratories and other business and government organizations Extensive treatment and transportation infrastructure in North America Breadth of medical waste and compliance services A g lobal leader in secure information destruction National Association for Information Destruction AAA Certification Extensive fleet and facility infrastructure Comprehensive industry expertise and thought leadership Serves healthcare practices, professional services, financial institutions, manufacturers, government offices, and others Regulated Waste and Compliance Description of business is based on the Stericycle 2023 Form 10 - K dated Feb. 28, 2024

CONFIDENTIAL AND PROPRIETARY INFORMATION OF WM 10 Get in touch with us. Ed Egl eegl@wm.com 713.265.1656 Heather Miller hmiller3@wm.com 713.265.1507
v3.24.2
| X |
- DefinitionBoolean flag that is true when the XBRL content amends previously-filed or accepted submission.
| Name: |
dei_AmendmentFlag |
| Namespace Prefix: |
dei_ |
| Data Type: |
xbrli:booleanItemType |
| Balance Type: |
na |
| Period Type: |
duration |
|
| X |
- DefinitionFor the EDGAR submission types of Form 8-K: the date of the report, the date of the earliest event reported; for the EDGAR submission types of Form N-1A: the filing date; for all other submission types: the end of the reporting or transition period. The format of the date is YYYY-MM-DD.
| Name: |
dei_DocumentPeriodEndDate |
| Namespace Prefix: |
dei_ |
| Data Type: |
xbrli:dateItemType |
| Balance Type: |
na |
| Period Type: |
duration |
|
| X |
- DefinitionThe type of document being provided (such as 10-K, 10-Q, 485BPOS, etc). The document type is limited to the same value as the supporting SEC submission type, or the word 'Other'.
| Name: |
dei_DocumentType |
| Namespace Prefix: |
dei_ |
| Data Type: |
dei:submissionTypeItemType |
| Balance Type: |
na |
| Period Type: |
duration |
|
| X |
- DefinitionAddress Line 1 such as Attn, Building Name, Street Name
| Name: |
dei_EntityAddressAddressLine1 |
| Namespace Prefix: |
dei_ |
| Data Type: |
xbrli:normalizedStringItemType |
| Balance Type: |
na |
| Period Type: |
duration |
|
| X |
- DefinitionAddress Line 2 such as Street or Suite number
| Name: |
dei_EntityAddressAddressLine2 |
| Namespace Prefix: |
dei_ |
| Data Type: |
xbrli:normalizedStringItemType |
| Balance Type: |
na |
| Period Type: |
duration |
|
| X |
- Definition
+ References
+ Details
| Name: |
dei_EntityAddressCityOrTown |
| Namespace Prefix: |
dei_ |
| Data Type: |
xbrli:normalizedStringItemType |
| Balance Type: |
na |
| Period Type: |
duration |
|
| X |
- DefinitionCode for the postal or zip code
| Name: |
dei_EntityAddressPostalZipCode |
| Namespace Prefix: |
dei_ |
| Data Type: |
xbrli:normalizedStringItemType |
| Balance Type: |
na |
| Period Type: |
duration |
|
| X |
- DefinitionName of the state or province.
| Name: |
dei_EntityAddressStateOrProvince |
| Namespace Prefix: |
dei_ |
| Data Type: |
dei:stateOrProvinceItemType |
| Balance Type: |
na |
| Period Type: |
duration |
|
| X |
- DefinitionA unique 10-digit SEC-issued value to identify entities that have filed disclosures with the SEC. It is commonly abbreviated as CIK. Reference 1: http://www.xbrl.org/2003/role/presentationRef
-Publisher SEC
-Name Exchange Act
-Number 240
-Section 12
-Subsection b-2
| Name: |
dei_EntityCentralIndexKey |
| Namespace Prefix: |
dei_ |
| Data Type: |
dei:centralIndexKeyItemType |
| Balance Type: |
na |
| Period Type: |
duration |
|
| X |
- DefinitionIndicate if registrant meets the emerging growth company criteria. Reference 1: http://www.xbrl.org/2003/role/presentationRef
-Publisher SEC
-Name Exchange Act
-Number 240
-Section 12
-Subsection b-2
| Name: |
dei_EntityEmergingGrowthCompany |
| Namespace Prefix: |
dei_ |
| Data Type: |
xbrli:booleanItemType |
| Balance Type: |
na |
| Period Type: |
duration |
|
| X |
- DefinitionCommission file number. The field allows up to 17 characters. The prefix may contain 1-3 digits, the sequence number may contain 1-8 digits, the optional suffix may contain 1-4 characters, and the fields are separated with a hyphen.
| Name: |
dei_EntityFileNumber |
| Namespace Prefix: |
dei_ |
| Data Type: |
dei:fileNumberItemType |
| Balance Type: |
na |
| Period Type: |
duration |
|
| X |
- DefinitionTwo-character EDGAR code representing the state or country of incorporation.
| Name: |
dei_EntityIncorporationStateCountryCode |
| Namespace Prefix: |
dei_ |
| Data Type: |
dei:edgarStateCountryItemType |
| Balance Type: |
na |
| Period Type: |
duration |
|
| X |
- DefinitionThe exact name of the entity filing the report as specified in its charter, which is required by forms filed with the SEC. Reference 1: http://www.xbrl.org/2003/role/presentationRef
-Publisher SEC
-Name Exchange Act
-Number 240
-Section 12
-Subsection b-2
| Name: |
dei_EntityRegistrantName |
| Namespace Prefix: |
dei_ |
| Data Type: |
xbrli:normalizedStringItemType |
| Balance Type: |
na |
| Period Type: |
duration |
|
| X |
- DefinitionThe Tax Identification Number (TIN), also known as an Employer Identification Number (EIN), is a unique 9-digit value assigned by the IRS. Reference 1: http://www.xbrl.org/2003/role/presentationRef
-Publisher SEC
-Name Exchange Act
-Number 240
-Section 12
-Subsection b-2
| Name: |
dei_EntityTaxIdentificationNumber |
| Namespace Prefix: |
dei_ |
| Data Type: |
dei:employerIdItemType |
| Balance Type: |
na |
| Period Type: |
duration |
|
| X |
- DefinitionLocal phone number for entity.
| Name: |
dei_LocalPhoneNumber |
| Namespace Prefix: |
dei_ |
| Data Type: |
xbrli:normalizedStringItemType |
| Balance Type: |
na |
| Period Type: |
duration |
|
| X |
- DefinitionBoolean flag that is true when the Form 8-K filing is intended to satisfy the filing obligation of the registrant as pre-commencement communications pursuant to Rule 13e-4(c) under the Exchange Act. Reference 1: http://www.xbrl.org/2003/role/presentationRef
-Publisher SEC
-Name Exchange Act
-Number 240
-Section 13e
-Subsection 4c
| Name: |
dei_PreCommencementIssuerTenderOffer |
| Namespace Prefix: |
dei_ |
| Data Type: |
xbrli:booleanItemType |
| Balance Type: |
na |
| Period Type: |
duration |
|
| X |
- DefinitionBoolean flag that is true when the Form 8-K filing is intended to satisfy the filing obligation of the registrant as pre-commencement communications pursuant to Rule 14d-2(b) under the Exchange Act. Reference 1: http://www.xbrl.org/2003/role/presentationRef
-Publisher SEC
-Name Exchange Act
-Number 240
-Section 14d
-Subsection 2b
| Name: |
dei_PreCommencementTenderOffer |
| Namespace Prefix: |
dei_ |
| Data Type: |
xbrli:booleanItemType |
| Balance Type: |
na |
| Period Type: |
duration |
|
| X |
- DefinitionTitle of a 12(b) registered security. Reference 1: http://www.xbrl.org/2003/role/presentationRef
-Publisher SEC
-Name Exchange Act
-Number 240
-Section 12
-Subsection b
| Name: |
dei_Security12bTitle |
| Namespace Prefix: |
dei_ |
| Data Type: |
dei:securityTitleItemType |
| Balance Type: |
na |
| Period Type: |
duration |
|
| X |
- DefinitionName of the Exchange on which a security is registered. Reference 1: http://www.xbrl.org/2003/role/presentationRef
-Publisher SEC
-Name Exchange Act
-Number 240
-Section 12
-Subsection d1-1
| Name: |
dei_SecurityExchangeName |
| Namespace Prefix: |
dei_ |
| Data Type: |
dei:edgarExchangeCodeItemType |
| Balance Type: |
na |
| Period Type: |
duration |
|
| X |
- DefinitionBoolean flag that is true when the Form 8-K filing is intended to satisfy the filing obligation of the registrant as soliciting material pursuant to Rule 14a-12 under the Exchange Act. Reference 1: http://www.xbrl.org/2003/role/presentationRef
-Publisher SEC
-Name Exchange Act
-Section 14a
-Number 240
-Subsection 12
| Name: |
dei_SolicitingMaterial |
| Namespace Prefix: |
dei_ |
| Data Type: |
xbrli:booleanItemType |
| Balance Type: |
na |
| Period Type: |
duration |
|
| X |
- DefinitionTrading symbol of an instrument as listed on an exchange.
| Name: |
dei_TradingSymbol |
| Namespace Prefix: |
dei_ |
| Data Type: |
dei:tradingSymbolItemType |
| Balance Type: |
na |
| Period Type: |
duration |
|
| X |
- DefinitionBoolean flag that is true when the Form 8-K filing is intended to satisfy the filing obligation of the registrant as written communications pursuant to Rule 425 under the Securities Act. Reference 1: http://www.xbrl.org/2003/role/presentationRef
-Publisher SEC
-Name Securities Act
-Number 230
-Section 425
| Name: |
dei_WrittenCommunications |
| Namespace Prefix: |
dei_ |
| Data Type: |
xbrli:booleanItemType |
| Balance Type: |
na |
| Period Type: |
duration |
|
Waste Management (NYSE:WM)
Historical Stock Chart
From Jun 2024 to Jul 2024

Waste Management (NYSE:WM)
Historical Stock Chart
From Jul 2023 to Jul 2024
