Huntington Beats on Q4 Earnings - Analyst Blog
January 16 2014 - 1:54PM
Zacks
Huntington Bancshares Inc. (HBAN) reported
earnings per share of 18 cents in fourth-quarter 2013, which beat
the Zacks Consensus Estimate by a penny. However, results were
below the prior-year quarter figure of 19 cents.
For 2013, Huntington reported earnings per share of 72 cents, which
came ahead of both the Zacks Consensus Estimate and the prior-year
figure of 71 cents.
However, the marginal earnings beat did little to gain investors’
confidence as the stock slipped 2% in the pre-trading session. A
stagnation in the top line growth due to low rates and weak
consumer confidence in the Midwest is the main concern.
Huntington’s results were driven by lower-than-expected provision
for credit losses and decrease in expenses. However, decline in
revenues due to fall in net interest income and non-interest income
was the headwind.
The company reported net income applicable to shareholders of
$157.8 million in the reported quarter, down 6% from the year-ago
quarter. For 2013, the company reported net income applicable to
shareholders of $638.7 million, dropping 0.4 % year over year.
Performance in Detail
Huntington’s total revenue on a fully taxable-equivalent (FTE)
basis was $685.5 million, down 7% year over year. However, the
revenue figure surpassed the Zacks Consensus Estimate of $679.0
million.
For 2013, Huntington’s total revenue on FTE basis was $2.7 billion,
down 3% year over year. Moreover, the revenue figure surpassed the
Zacks Consensus Estimate of $2,713.0 million.
Huntington’s net interest income (NII) dipped 0.2% from the
prior-year quarter to $438.8 million on FTE basis. This reflected
the impact of a 17-basis point decrease in net interest margin
(NIM).
Huntington’s non-interest income fell 17% year over year to $246.6
million. The decline was primarily due to a decrease in security
gains as well as gain on sale of loans and mortgage banking income.
These were partly offset by increase in service charges on deposit
accounts and electronic banking income.
However, non-interest expenses at Huntington fell 5% year over year
to $446.0 million. The decline was mainly due to fall in other
expense, professional services expenses, marketing expenses,
litigation expense, mortgage repurchases and warranty expense,
deposit and other insurance expenses as well as OREO and
foreclosure expense. These factors were partly offset by rise in
personnel costs and net occupancy costs.
Average loans and leases at Huntington increased 7% year over year
to $43.1 billion. However, average total deposits remained stable
at $46.8 billion.
Credit Quality
Credit quality metrics generally improved in the reported quarter.
Huntington’s provision for credit losses decreased 38% from the
prior-year quarter to $24.3 million due to the continued decline in
classified, criticized and nonaccrual loans.
Net charge-offs (NCOs) were $46.4 million or an annualized 0.43% of
average total loans and leases in the reported quarter, down from
$70.1 million or an annualized 0.69% in the prior-year quarter.
Moreover, the quarter-end allowance for credit losses (ACL) as a
percentage of total loans and leases, decreased to 1.65% from 1.99%
in the prior-year quarter.
Total non-performing assets (NPAs), including non-accrual loans and
leases at Huntington were $352.2 million as of Dec 31, 2013 and
represented 0.82% of related assets. This compared favorably with
$445.8 million or 1.09% of related assets at the prior year
quarter-end.
Capital Ratios
Huntington’s capital ratios were a mixed bag in the quarter. As of
Dec 31, 2013, the tangible common equity to tangible assets ratio
was 8.83%, up 7 bps year over year. Tier 1 common risk-based
capital ratio at the quarter-end was 10.90%, up 42 bps from the
prior-year quarter.
However, regulatory Tier 1 risk-based capital ratio as of Dec 31,
2013 was 12.28%, up from 12.02% as of Dec 31, 2012, due to an
increase in retained earnings, partially offset by the redemption
of qualifying trust preferred securities worth $50 million and
growth in risk-weighted assets.
Outlook
According to management, an improving trend in the Midwest region,
customers on the whole are affected by uncertainties in the larger
economy.
Net interest income is projected to grow modestly over the coming
quarters owing to the expected increase in earning assets (as total
loans will likely grow modestly and investment securities will
increase).
However, the benefits to net interest income are expected to be
mostly offset by persistent pressure on NIM. While the company
maintains a disciplined approach to loan pricing, asset yields
remain under pressure.
Non-interest income is expected to slightly decrease, excluding the
impact of any net MSR activity, due to the anticipated decline in
mortgage banking revenues and the continued refinement of products
under our Fair Play initiative.
Expenses, excluding the one-time items, are expected to remain
stable compared to current levels. Huntington remains committed to
posting positive operating leverage for the full year2014.
NPAs are expected to improve. NCOs are expected to be in the
mid-range of 35 to 55 basis points. The level of provision for
credit losses are expected to be volatile on a quarter-to-quarter
basis.
Our Viewpoint
Huntington has a solid franchise in the Midwest and is focused on
capitalizing on growth opportunities. The Fidelity Bank acquisition
and in-store banking deal bode well for the future. The company’s
capital deployment initiatives are also commendable.
However, a tepid economic recovery, low interest rate environment
and a stringent regulatory environment are headwinds for revenue
growth. Further, with expectations of an expanding expense base, we
remain somewhat skeptical about Huntington’s ability to drive
earnings in the quarters ahead.
Huntington currently carries a Zacks Rank #3 (Hold).
There are some other banks you may want to consider as our model
shows these have the right combination of elements to post an
earnings beat this season:
State Street Corp. (STT) has an earnings ESP of
+1.68% and carries a Zacks Rank #3 (Hold). It is scheduled to
report fourth-quarter results on Jan 24.
The earnings ESP for KeyCorp. (KEY) is +4.17% and
it carries a Zacks Rank #3. The company is expected to release
fourth-quarter results on Jan 23.
The earnings ESP for Fifth Third Bancorp (FITB) is
+2.38% and it has a Zacks Rank #2 (Buy). The company is expected to
release fourth-quarter results on Jan 23.
FIFTH THIRD BK (FITB): Free Stock Analysis Report
HUNTINGTON BANC (HBAN): Free Stock Analysis Report
KEYCORP NEW (KEY): Free Stock Analysis Report
STATE ST CORP (STT): Free Stock Analysis Report
To read this article on Zacks.com click here.
Zacks Investment Research
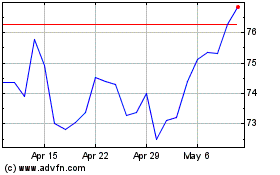
State Street (NYSE:STT)
Historical Stock Chart
From Jun 2024 to Jul 2024

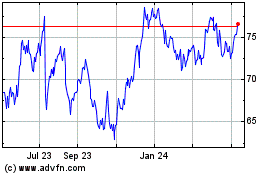
State Street (NYSE:STT)
Historical Stock Chart
From Jul 2023 to Jul 2024
