BB&T Corp.’s (BBT) first-quarter 2012
earnings of 61 cents per share beat the Zacks Consensus Estimate by
4 cents. In addition, the reported earnings significantly outpaced
the prior-year quarter’s earnings of 32 cents.
Better-than-expected quarterly results benefited from higher
revenue and lower provision for covered loans. The quarter also
witnessed improved credit quality and enhanced capital and
profitability ratios. Moreover, accelerating growth in loans and
low-cost deposits were also impressive. However, a rise in
non-interest expenses was the dampener.
Net income available to common shareholders for the quarter was
$431 million, jumping 92% from $225 million reported in the
prior-year quarter.
Quarter in Detail
BB&T reported first-quarter revenue of $2.34 billion, up
14.7% year over year. The improvement in revenue was primarily due
to higher net interest income and increased non-interest income.
Total revenue also surpassed the Zacks Consensus Estimate of $2.22
billion.
Tax-equivalent net interest income grew 11.4% year over year to
$1.47 billion. The year-over-year increase was attributable to
lower funding costs and a rise in earnings assets. However, net
interest margin fell from 4.01% in the prior-year quarter to 3.93%
in the reported quarter.
BB&T’s non-interest income climbed 22% year over year to
$871 million. The increase was mainly the result of higher mortgage
banking income, increased bankcard fees and merchant discounts,
partially offset by lower checkcard fees.
Non-interest expense at BB&T inched up 1.5% year over year
to $1.39 billion. The year-over-year increase was mainly led by
higher loan processing expenses, professional services and software
expenses. Also, there were merger-related and restructuring charges
of $12 million during the quarter.
BB&T’s efficiency ratio improved to 52.0% from 57.1% in the
prior-year quarter. The decrease in efficiency ratio indicates an
improvement in profitability.
Average deposits for the reported quarter climbed 18% year over
year to $124.6 billion. Moreover, average loans held for investment
stood at $107.5 billion, up 4.7% year over year.
Credit Quality
BB&T’s credit quality continued to show improvements. As of
March 31, 2012, total nonperforming assets (NPAs) declined 8%
sequentially and 42% year over year to $2.26 billion due to a $158
million sequential decline in foreclosed property.
This marks the eighth consecutive quarterly decline in NPAs. As
a percentage of total assets, NPAs came in at 1.33%, down from
1.45% as of December 31, 2011 and 2.56% as of March 31, 2011.
The provision for credit losses, excluding covered loans, fell
16.2% from the year-ago quarter. This was due to an improving
credit quality, which resulted in lower provision expense. However,
this increased $62 million on a sequential basis due to lower
reserve release. Net charge-offs (NCOs) were 1.28% of average loans
and leases compared with 1.46% in the prior quarter and 1.65% in
the year-ago quarter.
Profitability Ratios
Profitability metrics showed an improvement during the quarter.
As of March 31, 2012, return on average assets stood at 1.03%
compared with 0.93% reported in the prior quarter and 0.60%
reported in the prior-year quarter. Similarly, return on average
common equity was reported at 9.75%, versus 8.76% in the prior
quarter and 5.48% in the prior-year quarter.
Capital Ratios
BB&T's capital levels have remained strong during the year.
As of March 31, 2012, the Tier 1 risk-based capital ratio and
tangible common equity ratio were 12.7% and 7.1% respectively,
compared with 12.5% and 6.9% as of December 31, 2011 and 12.1% and
7.2% as of March 31, 2011.
BB&T's Tier 1 common capital ratio, under the currently
proposed Basel III capital standards, was 9.2% at March 31, 2012
compared to 8.8% as of December 31, 2011.
Capital Deployment Update
During the quarter, BB&T has announced a 25% hike in its
quarterly dividend. The increased quarterly cash dividend now
stands at 20 cents per share, up 4 cents from 16 cents paid
earlier. The dividend will be paid on May 1, 2012 to shareholders
of record as of the close of business April 9, 2012.
Recent Acquisitions
In April 2012, BB&T announced the accomplishment of the
purchase of Crump Group Inc.’s insurance business. The company, in
particular, acquired the life and property and casualty insurance
operating units of Crump. It, however, excluded Ascensus, the
retirement services business of Crump.
BB&T shelled out $570 million in cash to complete the
purchase. The acquisition is projected to be accretive to the
company’s earnings. It is anticipated to enhance BB&T’s
Insurance annual revenue by approximately $300 million.
The acquisition is a strategic fit, as it would help BB&T
increase its market share in life insurance distribution and
P&C businesses. We believe that the company’s top line will
also get enhanced, as it was otherwise entangled in several
financial reform rules.
Moreover, after its deal to acquire BankAtlantic, a wholly owned
subsidiary of BankAtlantic Bancorp Inc. (BBX), was
opposed in the court, BB&T modified certain terms of the
agreement. Apart from the earlier deal terms, BB&T will also
assume BankAtlantic Bancorp’s obligations related to the
outstanding trust preferred securities (TruPS) that have a balance
of about $285 million.
The BankAtlantic transaction will enable BB&T to boost its
expansion strategy in the Florida region. Moreover, the deal will
add 78 branches to the company’s 64-branch network in this region.
Besides, the substantial increase in BB&T’s market share and
footprints, following the acquisition, would also improve its
revenue stream over the medium term.
Performance of Peers
The first-quarter earnings of State Street
Corp. (STT), one of BB&T’s peers, were below the Zacks
Consensus Estimate. This compared unfavorably with the prior-year
quarter earnings of 88 cents. The year-over-year results were
negatively impacted by lower fee income and a rise in expenses.
However, these were partly offset by higher net interest revenue.
Moreover, capital ratios were stable during the quarter.
However, The Bank of New York Mellon Corp.’s
(BK) first-quarter 2012 earnings per share of 52 cents came
significantly in line with the Zacks Consensus Estimate. This
compares favorably with earnings of 42 cents in the prior
quarter.
Although BNY Mellon’s results benefited from higher fee income
and a rise in net interest margin, these positives were offset by a
reduction in net interest revenue and higher operating expenses.
Moreover, the company’s asset quality continued to show
improvements and the capital ratios remained strong.
Our Viewpoint
The growth story at BB&T is impressive following its organic
expansion as well as acquisitions. The efforts to diversify from a
concentration in real estate lending continues to progress well,
with BB&T reporting an increase in average commercial and
industrial loans, while reducing its other real estate loan
balances.
However, the company has a wide exposure to problem assets. The
current protracted economic recovery and various regulatory issues
also remain the matters of concern.
BB&T currently retains a Zacks #2 Rank, which translates
into a short-term Buy rating. Considering the fundamentals, we also
maintain our long-term Outperform recommendation on the shares.
BB&T CORP (BBT): Free Stock Analysis Report
BANKATLANTIC -A (BBX): Free Stock Analysis Report
BANK OF NY MELL (BK): Free Stock Analysis Report
STATE ST CORP (STT): Free Stock Analysis Report
To read this article on Zacks.com click here.
Zacks Investment Research
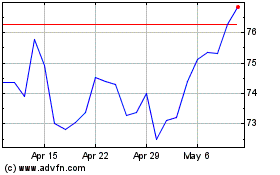
State Street (NYSE:STT)
Historical Stock Chart
From Jun 2024 to Jul 2024

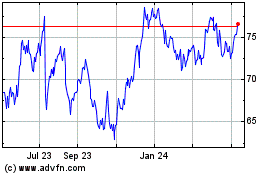
State Street (NYSE:STT)
Historical Stock Chart
From Jul 2023 to Jul 2024
