State Street Launches Turbulence Indices to Assist Institutional Investors with Active Portfolio Management and Diversification
July 28 2010 - 2:00PM
Business Wire
State Street Global Markets, the investment research and trading
arm of State Street Corporation (NYSE:STT), today announced the
launch of its Turbulence Indices, a suite of indices that measure
the unusualness, or turbulence, of market behavior on a daily
basis, which can help investors stress test their investment
strategies, build more versatile portfolios and dynamically scale
risk exposure. State Street’s Turbulence Indices cover US and
European equities, currency, US fixed income and global asset
classes. Each index provides a single, daily measure of turbulence
based on the abnormality of its constituents’ returns on that
day.
Unusualness and abnormality can result from extreme events that
move volatility up or down or from a sudden change in correlation
between assets.1 This can be particularly effective in managing
portfolio risk, because the relative turbulence of a given day can
result from the unusual performance of a single asset or from the
extraordinary interaction between a combination of assets, which
would not appear unusual in isolation.
“One of the most valuable lessons learned over the last few
years of market turbulence is that traditional portfolio
construction techniques cannot comprehensively assess the full
amount of risk inherent in a portfolio,” said Will Kinlaw, managing
director and head of Portfolio and Risk Management Research at
State Street Global Markets. “State Street’s Turbulence Indices go
a step further from traditional volatility measures by identifying
periods in which assumptions about correlations between investments
– as well as their volatilities – should be revisited. The
Turbulence Indices can be used alongside other measures of
volatility to better manage current portfolios and prepare for
additional instability in the market.”
Institutional investors can use the indices to stress test their
current financial models by assessing the performance of the model
under extreme conditions. The indices can also help portfolio
managers to build resilient portfolios that can better withstand
extreme market conditions. Since changing strategies requires a
significant amount of time, using tools like the Turbulence Indices
can help create a more resilient portfolio that can perform well in
stable times and remain solid in volatile times. In addition, asset
managers can use the index to dynamically scale risk exposure.
Standard models do not typically take extended periods of market
turbulence into account and since turbulence has historically
proven to be persistent once it strikes, it is possible to predict
patterns of turbulence and design a strategy to better manage
returns by scaling risk exposure to the affected assets.
“Clients are also able to download our index values and apply
them to their own portfolios to more effectively manage risk,”
continued Kinlaw.
State Street Global Markets’ research team of leading academic
and industry experts is committed to continually advancing the
science, including theory and application of its proprietary
investor behavior research and innovative portfolio and risk
management technologies, to help its customers challenge
conventional thinking, shape ideas, make more informed investment
decisions and deliver measurable results.
About State Street
State Street Corporation (NYSE: STT) is one of the world's
leading providers of financial services to institutional investors
including investment servicing, investment management and
investment research and trading. With $19 trillion in assets under
custody and administration and $1.8 trillion in assets under
management at June 30, 2010, State Street operates in 25 countries
and more than 100 geographic markets worldwide. For more
information, visit State Street’s web site at
www.statestreet.com.
About State Street Global Markets
State Street Global Markets provides specialized research,
trading, securities lending and innovative portfolio strategies to
owners and managers of institutional assets. Its goal is to enhance
and preserve portfolio values through original flow-based research,
proprietary portfolio and risk management technologies, trading
optimization and global connectivity. Its unique position at the
crossroads of the global markets enables its sales and trading
professionals to tap diverse sources of liquidity and provide
cost-effective solutions.
1 “Unusualness” is defined as the covariance-adjusted distance
between that day’s observation, which is comprised of a set of
contemporaneous returns, and the multivariate mean in
multi-dimensional space. Turbulence is defined using this
multivariate distance to quantify unusual patterns of investment
returns.
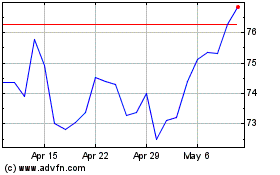
State Street (NYSE:STT)
Historical Stock Chart
From Jun 2024 to Jul 2024

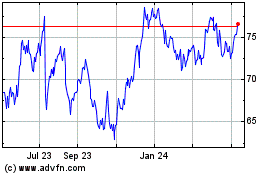
State Street (NYSE:STT)
Historical Stock Chart
From Jul 2023 to Jul 2024
