Today the Board of Directors of Natuzzi S.p.A. (NYSE:NTZ)
announced the first quarter 2010 financial results.
- Total Net Sales of €126.4
million as compared to €111.3 million in 1°Q 2009
- Industrial Margin of €48.7
million as compared to €28.4 million in 1°Q 2009
- Operating Income of €0.5 million
versus an Operating Loss of €16.6 million in 1° Q 2009
- Net Group Loss of €1.3 million
as compared to a Net Group Loss of €10.4 million of 1°Q 2009
- Positive Net Financial Position
of €54.9 million as compared to €58.5 million as of December 31,
2009
Total Net Sales for the first quarter 2010 were €126.4
million with an improvement of 13.6%. Upholstery Net Sales were
€111.3 million with an increase of 14.9% compared to the same
period of 2009. The contribution by Geographic area was the
following: Europe (excluding Italy) 42.4%, Americas 32.3%, Italy
14.1% and Rest of the World 11.2%.
The significant improvement of the Industrial Margin is
fundamentally due to a better product-mix sold, and to a constant
cost control activity, as well as to a positive euro/dollars
exchange rate that affected positively the cost of raw material
purchases.
Transportation costs were negatively influenced by a significant
increase of the freight fares recorded in some transportation
routes since January 2010. All the other SG&A costs slightly
improved as compared to the first quarter of 2009.
As a result of these figures, the Company highlights an
Operating Income of €0.5 million versus an Operating Loss of
€16.6 million in the first quarter of 2009 with a remarkable
improvement with respect to the same period of the previous
year.
Net Group Result shows a reduced loss of €1.3 million,
with respect to a loss of €10.4 million recorded in the same period
of 2009, mainly due to some improving actions obtained at a
production efficiency level.
Net Financial Position as of March 31, 2010 remains
strongly positive for €54.9 million notwithstanding the decrease
compared to December 31, 2009.
Pasquale Natuzzi, Chairman and Chief Executive Officer of
Natuzzi SpA., commented: “In the first quarter of 2010 we finally
recorded a net sales improvement. However, the economic crisis and
the worsening market conditions are not yet over and the Group
order flows for the first months of 2010 with respect to the last
months of 2009 confirm a slow down as compared to the previous
positive trend, even if with diversified trends among the various
brands and geographic areas. We promptly reacted, from a price
point of view, introducing in the Natuzzi Brand new “entry price”
products that could stimulate consumer demand coherently with the
brand positioning. The Italsofa and Editions brands are confirming
the success achieved during the Koln, Milan and High Point fairs
and the enormous potential of this new offer .
Along with these commercial initiatives, we have in progress an
internal restructuring plan that aims at simplifying the management
of company activities, at achieving further cost reductions and
innovation in order to improve the quality of products and customer
service.
We are confident that the strength of our brands and business
model, based on integration between production and distribution,
could help us face the adverse market situation. Furthermore,
thanks to the perseverance, enthusiasm, ethic values, and
commitment of all people working within our Group, we will be able
to achieve our goals in terms of service, quality, competitiveness
and profitability”.
About Natuzzi
Founded in 1959 by Pasquale Natuzzi, Natuzzi S.p.A. designs and
manufactures a broad collection of residential upholstered
furniture. With consolidated revenues of EUR 515.4 million in 2009,
Natuzzi is Italy's largest furniture manufacturer. Natuzzi Group
exports its innovative high-quality sofas and armchairs to 130
markets on five continents under two brands, Natuzzi and Italsofa.
Cutting-edge design, superior Italian craftsmanship and advanced,
vertically integrated manufacturing operations underpin the
Company's market leadership. Natuzzi S.p.A. has been listed on the
New York Stock Exchange since May 1993. The Company is ISO 9001 and
14001 certified.
Tables follows
Natuzzi S.p.A. and Subsidiaries Unaudited Consolidated
Profit & Loss for the quarter ended on March 31, 2010 on the
basis of Italian GAAP (expressed in millions Euro except for
share data)
Three months ended on Change
Percent of Sales 31-mars-10 31-mars-09
% 31-mars-10 31-mars-09 Upholstery net
sales 111.3 96.9 14.9% 88.1% 87.1% Other sales 15.1 14.4 4.9% 11.9%
12.9%
Total Net Sales 126.4 111.3 13.6%
100.0% 100.0% Purchases (54.8) (43.1) 27.1%
-43.4% -38.7% Labor (19.6) (19.9) -1.5% -15.5% -17.9% Third-party
manufacturers (0.9) (1.1) -18.2% -0.7% -1.0% Manufacturing costs
(10.4) (11.6) -10.3% -8.2% -10.4% Net Inventoris 8.0 (7.2) -211.1%
6.3% -6.5%
Cost of Sales (77.7) (82.9)
-6.3% -61.5% -74.5%
Industrial Margin 48.7
28.4 71.5% 38.5% 25.5% Selling
Expenses (37.8) (34.1) 10.9% -29.9% -30.6% of which Transportation
(11.6) (9.1) of which Advertising (6.3) (5.7) G&A Expenses
(10.4) (10.9) -4.6% -8.2% -9.8%
Operating Income/(Loss) 0.5 (16.6)
103.0% 0.4% -14.9% Interest
Income/(Costs), Net (0.4) (0.2) 100.0% -0.3% -0.2% Foreign
Exchange, Net 0.9 6.2 -85.5% 0.7% 5.6% Other Income/(Cost), Net 0.3
1.8 -83.3% 0.2% 1.6%
Earning before Income Taxes 1.3 (8.8)
114.8% 1.0% -7.9% Current taxes (2.6)
(1.5) -2.1% -1.3%
Net
result (1.3) (10.3) 87.4% -1.0%
-9.3% Minority interest 0.0 0.1
Net Group Result (1.3)
(10.4) 87.4% -1.0% -9.3%
Net Group Result per Share
(0.02) (0.19)
Outstanding Shares 54,824,277 54,824,277
Key Figures in U.S.
dollars Three months ended on Change Percent
of Sales (millions)
31-mars-10 31-mars-09
% 31-mars-10 31-mars-09 Total Net
Sales 174.9 154.0
13.6% 100.0%
100.0% Gross Profit 67.4 39.3
71.5%
38.5% 25.5% Operating Income (Loss) 0.7
(23.0)
-103.0% 0.4% -14.9% Net Group
Result (1.8) (14.4)
87.4% -1.0%
-9.3% Net Group Result per Share (0.0) (0.3)
Average exchange rate (U.S.$ per €) 1.3837
UPHOLSTERY NET SALES BREAKDOWN
Geographic
breakdown Net sales million euro Net sales seats
3 months ended on 3 months ended on
31-mars-10 31-mars-09
Change % 31-mars-10 31-mars-09
Change % Americas 36.0
32.3% 29.4 30.3% 22.4% 197,694
42.4% 159,803 38.7% 23.7% Natuzzi 4.4
4.0% 4.0 4.1% 10.0% 11,547 2.5% 11,116 2.7% 3.9% Italsofa 31.6
28.3% 25.4 26.2% 24.4% 186,147 39.9% 148,687 36.0% 25.2%
Europe 47.2 42.4% 46.8 48.3%
0.9% 174,757 37.5% 179,958 43.6%
-2.9% Natuzzi 24.7 22.2% 22.5 23.2% 9.8% 60,103 12.9% 54,130
13.1% 11.0% Italsofa 22.5 20.2% 24.3 25.1% -7.4% 114,654 24.6%
125,828 30.5% -8.9%
Italy (Natuzzi) 15.6
14.1% 12.3 12.7% 26.8% 46,494
10.0% 37,107 9.0% 25.3% Rest
of the world 12.5 11.2% 8.4 8.7%
48.8% 47,368 10.1% 35,917 8.7%
31.9% Natuzzi 7.8 7.0% 5.0 5.2% 56.0% 18,393 3.9% 13,268
9.0% 38.6% Italsofa 4.7 4.2% 3.4 3.5% 38.2% 28,975 6.2% 22,649 5.5%
27.9%
Total 111.3 100.0%
96.9 100.0% 14.9% 466,313 100.0%
412,785 100.0% 13.0%
Brands breakdown Net sales million euro Net sales
seats
3 months ended on 3 months ended
on
31-mars-10
31-mars-09 Change % 31-mars-10
31-mars-09 Change % Natuzzi
52.5 47.2% 43.8 45.2% 19.9%
136,537 29.3% 115,621 28.0%
18.1% Italsofa 58.8 52.8%
53.1 54.8% 10.7% 329,776 70.7%
297,164 72.0% 11.0%
Total 111.3 100.0% 96.9 100.0%
14.9% 466,313 100.0% 412,785
100.0% 13.0% Natuzzi S.p.A. and Subsidiaries
Consolidated Balance Sheets (Expressed in millions of euro)
ASSETS 31-mars-10 31 Dec
09 Current assets: Cash and cash equivalents 64.2
66.3 Marketable debt securities 0.0 0.0 Trade receivables, net 92.9
97.1 Other receivables 56.2 54.4 Inventories 89.5 81.6 Unrealized
foreign exchange gains 0.5 0.3 Prepaid expenses and accrued income
1.2 1.4 Deferred income taxes 0.7 0.7
Total current assets 305.2 301.8
Non current assets: Net property, plant and equipment 193.6
193.8 Other assets 11.8 12.7
Total
current assets 205.4 206.5 TOTAL
ASSETS 510.6 508.3 LIABILITIES
AND SHAREHOLDERS' EQUITY Current
liabilities: Short-term borrowings 2.2 0.8 Current portion of
long-term debt 1.3 1.1 Accounts payable-trade 60.8 66.5 Accounts
payable-other 29.8 29.3 Unrealized foreign exchange losses 1.4 0.4
Accounts payable-shareholders for dividends 0.0 0.0 Income taxes
5.2 3.7 Salaries, wages and related liabilities 14.1 12.5
Total current liabilities 114.8
114.3 Long-term liabilities: Employees'
leaving entitlement 29.3 29.6 Long-term debt 5.8 5.9 Deferred
income for capital grants 10.8 11.2 Other liabilities 18.3 20.4
Total long-term liabilities
64.2 67.1
Minority interest 2.0 1.9
Shareholders' equity: Share capital 54.9 54.9 Reserves 42.8
42.8 Additional paid-in capital 8.3 8.3 Retained earnings 223.6
219.0
Total shareholders' equity
329.6 325.0 TOTAL LIABILITIES AND
SHAREHOLDERS' EQUITY 510.6 508.3 Natuzzi
S.p.A. and Subsidiaries
Consolidated Statements of Cash
Flows (Expressed in million of euro)
31-mars-10 31 Dec 09 Cash flows from
operating activities: Net earnings (loss) (1.3)
(17.7) Adjustments to reconcile net income to net
cash provided by operating activities: Depreciation and
amortization 6.3 26.8 Employees' leaving entitlement (0.3) (2.1)
Deferred income taxes (0.0) 3.7 Minority interest 0.1 0.4 (Gain)
loss on disposal of assets (0.0) (0.1) Unrealized foreign exchange
losses and gains 0.8 (4.4) Deferred income for capital grants (0.2)
(1.0)
Non monetary operating costs 6.6 23.3
Change in assets and liabilities: Receivables, net
4.2 25.7 Inventories (8.0) 10.4 Prepaid expenses and accrued income
0.3 (0.2) Other assets (1.6) (8.2) Accounts payable (5.7) (2.1)
Income taxes 1.4 1.9 Salaries, wages and related liabilities (0.9)
(1.8) Other liabilities 0.2 2.5
Net working capital
(10.1) 28.2 Net cash provided by operating
activities (4.8) 33.8 Cash flows
from investing activities: Property, plant and equipment:
Additions (1.0) (9.1) Disposals 0.0 0.2 Government grants received
Net cash used in investing activities (1.0)
(8.9) Cash flows from financing activities:
Long-term debt: Proceeds 0.6 3.9 Repayments (0.4) (0.7)
Short-term borrowings 1.4 (8.9)
Net cash used in
financing activities 1.6 (5.7) Effect of
translation adjustments on cash 2.1 (0.2)
Increase
(decrease) in cash and cash equivalents (2.1)
19.0 Cash and cash equivalents, beginning of the
year 66.3 47.3 Cash and cash
equivalents, end of the year 64.2 66.3
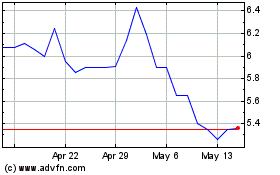
Natuzzi S P A (NYSE:NTZ)
Historical Stock Chart
From Oct 2024 to Nov 2024

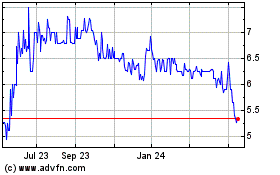
Natuzzi S P A (NYSE:NTZ)
Historical Stock Chart
From Nov 2023 to Nov 2024
