Three Construction ETFs For An Economic Recovery - ETF News And Commentary
February 16 2012 - 6:01AM
Zacks
As more jobs are created and some Americans are beginning to
feel more confident about the economy, stock prices have surged
across the board. While most sectors have benefited from this surge
in optimism, a few of the more cyclical—and heavily beaten
down—corners of the market have seen even more impressive
performances to start the year. No more has this been true than in
the construction segment, as investors have piled into this corner
of the market thanks to solid data, reasonable valuations, and
hopes for greater demand going forward.
These expectations have been further boosted by strong economic
indicators relative to the construction space specifically. Recent
readings on the construction spending front came in well above
expectations in terms of month/month reports, while other metrics
such as housing starts also posted favorable figures. Beyond these
data points, investors have also seen favorable releases regarding
both personal income and the ISM Non-Manufacturing Index, all the
while rates have stayed low, keeping borrowing costs at a minimum
for those looking to expand their operations (read Three Cyclical
ETFs That Are Surging Higher).
As a result of this broadly improving economic environment, low
borrowing costs, and the vast wealth of untapped capital stored up
by many businesses, some are forecasting that a resurgence in the
building sector could have some staying power. This could
especially be true if the trends highlighted above remain strong
and investors continue to pile into highly cyclical industries like
construction for their equity exposure (read Three Industrial ETFs
For A Manufacturing Revival).
In light of this, it may be a good idea to tilt portfolios
towards the building sector, at least in the short-term. While an
investment in an individual stock could be an intriguing idea, some
investors may be better off seeking broad exposure to the sector
via an ETF. For these investors, we have highlighted three
construction ETFs that could be in prime position to benefit from
this positive trend in the construction world, or at least surge if
the economic climate continues to improve as we go further into
2012:
ISE Global Engineering and Construction Index Fund
(FLM)
If investors are looking for a global way to play this trend,
both from an engineering and construction perspective, FLM is tough
to beat. The product tracks the ISE Global Engineering and
construction index which focuses in on firms that are principally
engaged in the production or completion of large civil and capital
projects or any aspect of the engineering process. In order to
weight securities, the fund uses a linear-based cap-weighted method
which stops a few firms from dominating the performance of the
total index. With this strategy, the fund holds just under 70
securities although it does charge investors 70 basis points a year
in fees (read Three Outperforming Active ETFs).
Top holdings for FLM are Vinci SA,
McDermott international
(MDR), and Fluor
Corp (FLR), giving the
fund a heavy tilt towards industrial firms. However, the product
does have a median market cap of just $2.3 billion, suggesting a
smattering of mid and small caps are in the fund. In fact, mid caps
make up a majority of the fund’s assets at close to two-thirds of
the total. In terms of country exposure, U.S. securities make up
about one-quarter of assets while Japan (19.1%), and developed
Europe (44%) make up much of the rest of the fund.
Dynamic Building & Construction Portfolio
(PKB)
If investors are searching for a U.S centric play on the broad
sector, PKB could be the way to go. The PowerShares fund tracks the
Dynamic Building & construction Intellidex which consists of 30
companies in the U.S. from those sectors. The product also utilizes
a more quantitative methodology which looks to evaluate companies
based on a number of investment criteria including growth,
valuation, timeliness, and risk factors. This approach produces a
fund that charges a net expense ratio of 63 basis points a year,
after current fee waivers of 28 basis points (also read Are Telecom
ETFs In Trouble?).
Current top holdings include Vulcan Materials
(VMC), KBR Inc
(KBR), and Home
Depot (HD) suggesting
that while the fund has a heavy tilt towards industrials, consumer
firms make up a decent chunk as well. In fact, industrials make up
about 52% of the fund while consumer discretionary (23.5%) and
materials (19.2%) help to round out the fund from an industry
perspective. For market capitalization exposure, the product has a
definite focus on smaller firms as mid caps make up a plurality at
about 40% of the fund while small and micro make up another 50% of
the product, leaving just 10% for large and giant cap firms. This
suggests that the fund could be more volatile than some in the
sector, pushing standard deviation levels up compared to more large
cap focused funds in the industrial and materials sectors.
Dow Jones U.S. Home Construction Index Fund
(ITB)
For investors searching for more of a housing recovery play, ITB
could be an interesting choice. The product tracks the Dow Jones
U.S. Select Home Construction Index which is a broad benchmark of
firms that includes companies that construct residential homes
including mobile and prefab domiciles. Homebuilders make up roughly
two-thirds of the total exposure, although firms in the building
materials segment occupy another 19.5% while home improvement firms
take up another 9% of total assets (see Five Cheaper ETFs You
Probably Overlooked).
This is in stark contrast to the SPDR S&P
Homebuilders ETF (XHB)
as this product puts less than 30% of its assets in homebuilders,
giving double digit weights to home furnishing retail and home
furnishing manufacturers. As a result, ITB could be more of a pure
play on construction and thus make for an intriguing play for those
focused in on this corner of the market. Total holdings include 27
firms while DR Horton takes the top spot, followed closely by
Lennar Corp and Pulte Group. The product charges 47 basis points a
year in fees but pays out a respectable 65 basis points in
dividends in 30-Day SEC Yield terms.
Want the latest recommendations from Zacks Investment
Research? Today, you can download 7 Best Stocks for the Next 30
Days. Click to get this free report >>
FLUOR CORP-NEW (FLR): Free Stock Analysis Report
HOME DEPOT (HD): Free Stock Analysis Report
KBR INC (KBR): Free Stock Analysis Report
MCDERMOTT INTL (MDR): Free Stock Analysis Report
VULCAN MATLS CO (VMC): Free Stock Analysis Report
To read this article on Zacks.com click here.
Zacks Investment Research
Want the latest recommendations from Zacks Investment Research?
Today, you can download 7 Best Stocks for the Next 30 Days. Click
to get this free report
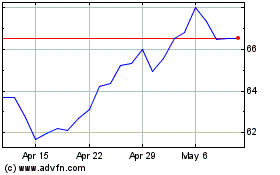
KBR (NYSE:KBR)
Historical Stock Chart
From Apr 2024 to May 2024

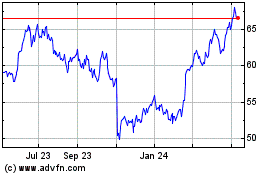
KBR (NYSE:KBR)
Historical Stock Chart
From May 2023 to May 2024
