Kimco Reports Strong, Ups Dividend - Analyst Blog
November 03 2011 - 5:00AM
Zacks
Kimco Realty Corp.
(KIM), a leading real estate investment trust (REIT), reported
third quarter 2011 rental revenues of $216.1 million compared with
$207.2 million in the year-earlier quarter – an increase of 4.3%.
Total revenues for the reported quarter, however, missed the Zacks
Consensus Estimate of $220.0 million.
Kimco reported third quarter 2011
fund from operations (FFO) of $128.2 million or 31 cents per share
compared with $110.5 million or 27 cents in the year-ago period.
Fund from operations, a widely used metric to gauge the performance
of REITs, is obtained after adding depreciation and amortization
and other non-cash expenses to net income.
Excluding certain non-recurring
items, FFO for the reported quarter was $123.7 million or 30 cents
per share compared with $114.5 million or 28 cents in the
year-earlier quarter. The recurring FFO for the quarter was in line
with the Zacks Consensus Estimate.
Overall occupancy in Kimco’s
combined shopping center portfolio was 93.0% at the end of the
quarter, an increase of 10 bps compared with third quarter 2010. In
the U.S. portfolio, occupancy was 92.9% as of September 30, 2011,
an increase of 50 bps compared with the year-ago period. Same-store
net operating income in the combined portfolio increased 3.3%
year-over-year.
During the reported quarter, Kimco
executed a total of 614 leases spanning 1.8 million square feet.
These included 79 new leases in the U.S. same-store portfolio
totaling 374,000 pro-rata square feet and 184 lease renewals and
options for 775,000 pro-rata square feet. In addition, Kimco
executed over 93 new leases totaling 345,000 square feet for spaces
vacant for more than one year. Leasing spreads in the U.S.
portfolio on a pro-rata basis increased 2.7% (cash basis).
The company acquired 4 shopping
centers during the reported quarter for approximately $97.9
million. Subsequent to the quarter-end, Kimco acquired 2 shopping
center properties for an aggregate purchase price of $18.9 million.
At the same time, Kimco sold 10 non-strategic assets spanning
414,000 square feet for $35.9 million. As of September 30, 2011,
the company had a portfolio of 128 non-strategic U.S. shopping
centers totaling 8.6 million square feet with an 82.9% pro-rata
occupancy.
The reported quarter also saw the
company recognizing $8.7 million of fee income related to its
investment management business, including $6.9 million in
management fees and $1.8 million in other ongoing fees. Kimco had
285 properties in investment management funds with 24 institutional
partners at quarter-end.
During the reported quarter, the
company generated $34.4 million of pre-tax earnings from its
structured investments and other non-retail assets, out of which
$15.7 million was recurring in nature. As of September 30, 2011,
Kimco reduced its non-retail assets to approximately $564 million
compared to $1.2 billion at the end of first quarter 2009.
During third quarter 2011, Kimco
increased its quarterly dividend by 5.6% to 19 cents per share. The
company’s consolidated net debt to recurring EBITDA (earnings
before interest, tax, depreciation and amortization) ratio improved
to 6.0x during the quarter from 6.4x in the year-ago quarter.
Subsequent to the quarter-end,
Kimco entered into a new $1.75 billion unsecured U.S. revolving
credit facility that replaced its existing $1.5 billion U.S. and
$250 million Canadian Dollar-denominated revolving credit
facilities. The company had $180.2 million of cash and cash
equivalents at the end of the reported quarter.
For fiscal 2011, the company
narrowed its recurring FFO guidance from the range of $1.17 – $1.21
per share to $1.19 – $1.20. For fiscal 2012, Kimco expects
recurring FFO in the range of $1.22 – $1.26.
We maintain our long-term ‘Neutral’
recommendation on the stock, which presently has a Zacks #3 Rank
translating into a short-term ‘Hold’ rating. We also have a
‘Neutral’ recommendation and a Zacks #3 Rank for CBL &
Associates Properties Inc. (CBL), one of the competitors
of Kimco.
CBL&ASSOC PPTYS (CBL): Free Stock Analysis Report
KIMCO REALTY CO (KIM): Free Stock Analysis Report
Zacks Investment Research
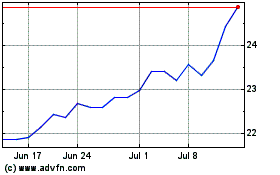
CBL and Associates Prope... (NYSE:CBL)
Historical Stock Chart
From Jun 2024 to Jul 2024

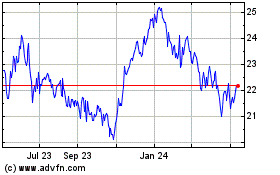
CBL and Associates Prope... (NYSE:CBL)
Historical Stock Chart
From Jul 2023 to Jul 2024
