DineEquity Tops, Lowers Guidance - Analyst Blog
November 11 2011 - 3:45AM
Zacks
DineEquity Inc.
(DIN) reported third quarter adjusted earnings of $1.04 per share,
comfortably beating the Zacks Consensus Estimate 99 cents and the
prior-year earnings of 95 cents. Revenues in the reported quarter
plunged 21.2% year over year to $264.5 million.
Inside the Headline
Numbers
DineEquity operates under
Applebee's Neighborhood Grill & Bar and IHOP brands. Applebee's
domestic system-wide comparable-store sales inched down 0.3% during
the quarter, with franchise same-restaurant sales dipping 0.4% and
company-operated comparable restaurant sales rising 0.1%. Total
comparable-store sales declined for the first time since second
quarter 2010. The downside in Applebee's comparable store sales was
due to lighter traffic, partially offset by an uptick in average
guest check.
The domestic system-wide same-store
sales of IHOP dipped 1.5% during the quarter due to lower
traffic.
Restaurant operating margin at
Applebee's company-operated restaurants dropped 60 basis points
(bps) to 14.2% during the quarter, attributable to higher commodity
costs, and investment in local advertising, which was partially
compensated by refranchising of lower margin restaurants and
slightly lower labor costs.
Store Update
During the third quarter,
DineEquity opened 4 and closed 6 Applebee’s franchised restaurants.
The company also opened 13 IHOP franchised restaurants as well as
one area licensed restaurant and shut down 4 area-licensed units.
At the end of the quarter, DineEquity had 2,010 Applebee’s and 1532
IHOP restaurants.
The company continues to focus on
the franchise business model as it is less capital intensive and
reduces volatility of cash flow. DineEquity also expects to use the
sale proceeds for reducing its debt burden.
Financial
Position
DineEquity ended the reported
quarter with cash and cash equivalents of $53.9 million and
shareholders’ equity of $123.5 million.
The company is in a delevering
mode. It has reduced term loan balances by $110.0 million, retired
$39.8 million of the 9.5% senior notes and $43.3 million of
financing and capital lease obligations for the first nine months
of the year.
The company repurchased 534,101
shares of its common stock in the third quarter for a total of
$21.2 million.
Outlook
The largest full-service restaurant
company in the world expects Applebee's domestic system-wide
comparable-store sales in the range of 1.5% to 2.0% (previously 2%
to 4%) for fiscal 2011. The company also expects domestic
system-wide same-store sales decline of 2% to 2.4% (previously down
2% to up 1%) for IOHP.
For 2011, DineEquity continues to
expect capital expenditure of $26 million but toned down its
expectation for cash from operation to the range of $117–$127
million (earlier $125–$135 million) and free cash flow in the range
of $104–$114 million (earlier $112–$122 million).
Applebee's franchisees plan to open
24 to 28 restaurants by year-end 2011, half of which are expected
in the international market. IHOP franchisees expect to open 55 to
60 restaurants (previously 55-60), mostly in the domestic
market.
Our Take
We expect the estimates to go down
in the coming quarter as the company’s IHOP brand continues to
struggle. Additionally, the company cut down its expectation for
same-restaurant sales, restaurant operating margin as well as cash
flow operating activities. This indicates a tough operating
environment for the company.
However, with about 95% of
restaurants either franchised or soon to be franchised, DineEquity
remains on track to achieve its long-term goal. A share repurchase
program is also in place to boost stockholder value. Besides, the
company is all set to try a robust pipeline for menu for the
remainder of 2011and throughout 2012. Notably, the company either
upgraded or replaced over 90% of the offerings since December
2007.
DineEquity, which competes with
Brinker International Inc. (EAT), currently
retains a Zacks #3 Rank, which translates into a short-term Hold
rating. We are also maintaining our long-term Neutral
recommendation on the stock.
DINEEQUITY INC (DIN): Free Stock Analysis Report
BRINKER INTL (EAT): Free Stock Analysis Report
Zacks Investment Research
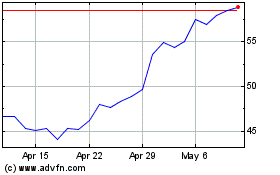
Brinker (NYSE:EAT)
Historical Stock Chart
From May 2024 to Jun 2024

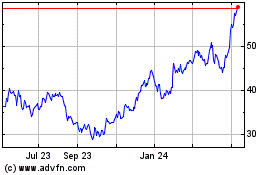
Brinker (NYSE:EAT)
Historical Stock Chart
From Jun 2023 to Jun 2024
