Earnings Preview: Allegheny - Analyst Blog
April 25 2011 - 4:30AM
Zacks
Allegheny Technologies Inc. (ATI) isslated to
release its first quarter 2011 results on Wednesday, April 27,
before the market opens. The current Zacks Consensus Estimate for
the first quarter is 49 cents, representing a significant
annualized growth of 103.13%.
With respect to
earnings surprise, over the trailing four quarters, Alleghenyout
performedthe Zacks Consensus Estimate in the two quarters and
lagged behind in the other two quarters. The average earnings
surprise was a negative 15.42%, implying that the company was
behind the Zacks Consensus Estimate by the same magnitude over the
last four quarters.
Fourth-Quarter Performance
On January 26,
Allegheny reported its results for the fourth quarter of fiscal
2010. In the fourth quarter, Allegheny reported earnings per share
(EPS) of $0.15, missing the Zacks Consensus Estimate of $0.30 and
falling significantly short from last year's $0.36 per share.
Fourth-quarter results were impacted by a $19.5 million LIFO
inventory valuation reserve charge and $20.4 million in start-up
and idle facility costs, which reduced earnings by 26 cents per
share.
For full-year
2010, earnings were $0.82 per share, higher than $0.49 per share in
the year-ago period. This also missed the Zacks Consensus Estimate
of $0.94 per share.
Quarterly
revenues soared 27.2% year over year to $1.04 billion from $815
million on higher shipments and rising raw material prices. Yet
revenues fell short of the Zacks Consensus Estimate at $1.06
billion. Yearly revenues jumped 33% to $4.05 billion from $3.1
billion, beating the Zacks Consensus Estimate of $4.1 billion.
Segment wise,
revenue increases were distinct in the Engineered Products segment
(56%) and in the Flat-Rolled Products segment (34%), while sales in
the Higher Performance Material segment increased modestly
(12%).
Allegheny’s
operating profit declined 25.7% to $88.0 million due to a LIFO
inventory valuation reserve charge of $19.5 million in the fourth
quarter of 2010 compared with a benefit of $43.8 million in the
fourth quarter of 2009. Results were adversely affected by idled
facilities and start-up costs.
For fiscal year
2011, Allegheny expects revenue growth to be in the range of 15% to
20% compared with 2010, and expects segment operating profit to be
approximately 15% of sales. The company targets a minimum of $100
million in new gross cost reductions. Capital expenditures
are forecasted in the range of $300 to $350 million.
Allegheny
expects rising demand in the aerospace market to drive sales going
forward. The company expects the global oil and gas/chemical
process industry to remain strong due to increased demand from
offshore oil and gas projects, large sour gas pipelines,
desalination projects and increasing orders for chemical processing
projects from several parts of the world.
In the
electrical energy market, Allegheny expects demand for
grain-oriented electrical steel for power distribution to remain
essentially flat. The company also expects demand from the
nuclear electrical energy market to remain flat in 2011, although
growth opportunities exist for new nuclear plants under
construction over the next several years.
The medical
market reached a record of nearly 6% of 2010 sales and Allegheny
remains optimistic and expects demand to continue in 2011.
Agreement of Estimate Revisions
In the last 30
days, out of the 8 analysts covering the stock, none increased nor
decreased their EPS estimate for first-quarter 2011. For fiscal
year 2011, in the last 30 days, out of the 7 analysts covering the
stock, 1 analyst raised its EPS estimates, while none decreased the
estimate.
|
Agreement - Estimate
Revisions
|
|
|
Current Qtr
(03/2011)
|
Next Qtr
(06/2011)
|
Current Year
(12/2011)
|
Next Year
(12/2012)
|
|
|
Up Last 7 Days
|
0
|
0
|
0
|
0
|
|
|
Up Last 30 Days
|
0
|
1
|
1
|
1
|
|
|
Down Last 7 Days
|
0
|
0
|
0
|
0
|
|
|
Down Last 30 Days
|
0
|
0
|
0
|
0
|
|
Magnitude of Estimate Revisions
Earnings
estimates for first quarter 2011, in the last 30 days, decreased by
1 cent to $0.49 from $0.50. For fiscal year 2011, earnings
estimates, in the last 30 days, increased by 5 cents to $4.26 from
$4.21.
|
Magnitude - Consensus Estimate
Trend
|
|
|
Current Quarter
(03/2011)
|
Next Quarter
(06/2011)
|
Current Year
(12/2011)
|
Next Year
(12/2012)
|
|
|
Current
|
0.49
|
0.73
|
3.00
|
4.26
|
|
|
7 Days Ago
|
0.50
|
0.74
|
3.00
|
4.24
|
|
|
30 Days Ago
|
0.50
|
0.73
|
2.99
|
4.21
|
|
|
60 Days Ago
|
0.49
|
0.73
|
2.99
|
4.25
|
|
|
90 Days Ago
|
0.52
|
0.67
|
2.83
|
3.88
|
|
Our
Take
Based in
Pittsburgh, PA, Allegheny Technologies Inc. is one of the largest
and most diversified specialty materials producers in the world.
The aerospace market has started recovering, which boosted the
demand for Allegheny’s products.
Allegheny is a
significant supplier to commercial aircraft engine manufacturers
and is also expanding in the commercial airframes market. However,
Allegheny has been battling cost-pressures associated with high raw
material costs by implementing price hikes through surcharges.
Allegheny is
facing an overcapacity of competitive stainless steel. A
significant portion of the sales under the High Performance Metals
segment is attributed to customers in the commercial aerospace
industry. The commercial aerospace industry has historically been
cyclical. Although the aerospace market has shown some improvement
recently, we expect Allegheny to see a slower growth in its High
Performance Segment, which generates a major chunk of revenues.
Moreover, increasing input costs are putting margin pressure on all
domestic steel manufacturers.
The company’s competitors include
Carpenter Technology Corp. (CRS) and Sutor
Technology Group Limited (SUTR).
Currently, Allegheny has a
short-term (1 to 3 months) Zacks #3 Rank ('Hold') and a long-term
Neutral recommendation.
ALLEGHENY TECH (ATI): Free Stock Analysis Report
CARPENTER TECH (CRS): Free Stock Analysis Report
SUTOR TECH GRP (SUTR): Free Stock Analysis Report
Zacks Investment Research
ATI (NYSE:ATI)
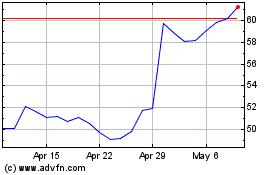
Historical Stock Chart
From May 2024 to Jun 2024

ATI (NYSE:ATI)
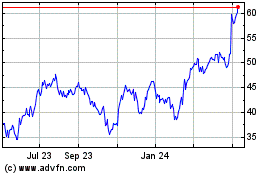
Historical Stock Chart
From Jun 2023 to Jun 2024
