American Eagle 4Q Beats, Sales In Line - Analyst Blog
March 09 2012 - 3:15AM
Zacks
Recently, American Eagle
Outfitters Inc. (AEO) reported its fourth-quarter 2011
earnings of 35 cents per share, beating the Zacks Consensus
Estimate of 34 cents. However, it was lower than the
previous-period earnings of 44 cents per share.
For the full year, the company
reported earnings of 77 cents per share, missing the Zacks
Consensus Estimate of 86 cents and falling below the year-ago
earnings of $1.02 per share.
Sales
During the quarter, American
Eagle’s net sales went up 14% year over year to $1,042.7 million,
almost in line with the Zacks Consensus Estimate of $1,042.0
million. Growth in revenue was driven by a 10% increase in
comparable store sales. During the period, the company’s AE Brand,
aerie and AEO Direct segments reported a growth of 10%, 6% and 18%,
respectively, in comparable store sales.
For fiscal 2011, net sales grew 6%
to $3,159.8 million, almost meeting the Zacks Consensus Estimate of
$3,160.0 million. The company’s comparable store sales for fiscal
2011 grew 3%. Full year online sales at AEO Direct were up 15% to
$385 million.
Quarterly
Review
Lower merchandise margins resulted
in a 1.4% decline in gross profit during the quarter, while gross
margin contracted 530 basis points to 34.1%. The decline in
merchandise margins during the quarter was attributed to increase
in unit costs, mainly due to higher product prices.
In the fourth quarter, selling,
general and administrative (SG&A) expense increased 13.4% to
$220 million, and included a $6 million in executive transition
costs. SG&A expense, as a percentage of sales, were up 10 basis
points to 21.1%, driven by higher variable expense related to the
sales increase and a planned investment in advertising.
Consequently, operating income
declined 40.3% to $80 million from $134 million in the prior-year
period.
Financial
Position
American Eagle ended the year with
cash and cash equivalents of $719.5 million compared with $667.6
million in the year-ago period. For fiscal 2011, cash used for
operating activities came in at $87.4 million.
During fourth-quarter 2011, the
company deployed $3 million toward capital expenditure, bringing
the fiscal year capital spending to $100 million.
During the year, American Eagle
returned value to shareholders by buying back 1.4 million shares
for $15 million. The company also paid cash dividends of $86
million.
Guidance
Looking ahead into 2012, the
company sees a modest rise in sales and slight improvement in
margin. The company expects margins to be pressured in the first
half of fiscal 2012 due to higher product costs, while the lower
product costs are expected to ease pressure on margins in the
second half. The company expects to provide fiscal 2012 earnings
per share guidance with its first quarter results in May.
On the other hand, the company
pointed out that it began the first quarter of fiscal 2012 on a
strong note with positive February comps, which are driven by
well-balanced selling of spring product and clearance. The company
expects first-quarter EPS to come in the range of 8 cents to 10
cents per share, driven by continued margin pressure from product
costs, higher markdowns and the potential for increased promotions.
The current Zacks Consensus Estimate for first-quarter 2012 is 9
cents per share.
Conclusion
We remain impressed with the
company’s continued momentum in denim along with improved
merchandise assortments in the women’s business segment, which will
likely lead to a turnaround in its top line as well as a rebound in
gross margin.
The company operates in a highly
fragmented specialty retail sector and faces intense competition
from other teenage-focused retailers, such as Abercrombie
& Fitch Co. (ANF) and Gap Inc.
(GPS).
We currently have a short-term
Zacks #3 Rank (Hold) and a long-term Outperform recommendation on
the stock.
AMER EAGLE OUTF (AEO): Free Stock Analysis Report
ABERCROMBIE (ANF): Free Stock Analysis Report
GAP INC (GPS): Free Stock Analysis Report
To read this article on Zacks.com click here.
Zacks Investment Research
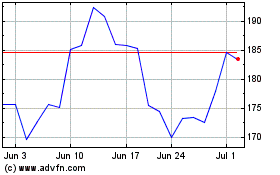
Abercrombie and Fitch (NYSE:ANF)
Historical Stock Chart
From Jun 2024 to Jul 2024

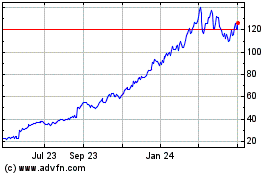
Abercrombie and Fitch (NYSE:ANF)
Historical Stock Chart
From Jul 2023 to Jul 2024
