Steve Madden (Nasdaq: SHOO), a leading designer and marketer of
fashion footwear and accessories for women, men and children, today
announced financial results for the first quarter ended March 31,
2009.
- First quarter net sales
increased 6.9% to $107.4 million.
- Operating margin rose to 9.6% in
the first quarter 2009, compared with operating margin of 2.8% in
the same period of 2008. Operating income for the first quarter of
2008 included a pre-tax charge of $4.9 million related to the
resignation of the Company�s former CEO.
- Net income for the first quarter
was $6.6 million, or $0.37 per diluted share, compared to $2.1
million, or $0.10 per diluted share, in the first quarter of 2008.
Net income for the first quarter of 2008 included the
aforementioned charge totaling $3.0 million post-tax, or $0.15 per
diluted share.
Edward Rosenfeld, Chairman and Chief Executive Officer
commented, "We are very pleased with our first quarter results.
Steve and his team continue to create trend-right footwear and
accessories that resonate with consumers, enabling us to grow sales
and earnings despite the economic headwinds. We are particularly
pleased with the performance of our Steve Madden Womens and Madden
Girl wholesale businesses as well as the strong initial results of
l.e.i at Wal-Mart. Looking ahead, we will continue to focus on
delivering trend-right product at attractive price points while
maintaining disciplined inventory management and expense
controls.�
First Quarter 2009 Results:
First quarter net sales were $107.4 million compared to $100.5
million reported in the comparable period of 2008. Net sales from
the wholesale business grew 7.6% to $81.3 million compared to $75.6
million in the first quarter of 2008, driven by strength in the
Steve Madden Womens and Madden Girl wholesale footwear divisions as
well as the Daniel M. Friedman accessories division. Retail net
sales totaled $26.1 million compared to $25.0 million in the first
quarter of the prior year. Same store sales increased 7.6% in the
first quarter of 2009 compared to a decrease of 3.7% in the first
quarter of 2008.
Gross margin improved to 40.5% as compared to 40.0% in the first
quarter of 2008. For the wholesale business, gross margin was 38.1%
as compared to 37.4% in the prior year's first quarter, with the
increase driven primarily by lower markdown allowances as
sell-through at retail remained strong. Retail gross margin was
flat at 47.8% versus the comparable period last year, with the
benefit of a stronger merchandise assortment offset by the effects
of a highly promotional environment.
Operating expenses as a percent of sales for the first quarter
of 2009 were 33.6% versus 40.5% in the same period of the prior
year. Operating expenses for the first quarter of 2008 included a
$4.9 million pre-tax charge related to the resignation of the
Company�s former CEO mentioned previously. Excluding this charge
operating expenses as a percent of sales were 35.6% for the period.
The 200 basis-point decline in operating expenses was primarily due
to effective cost control initiatives and leverage on the
increasing sales.
Net income for the first quarter of 2009 totaled $6.6 million,
or $0.37 per diluted share as compared to net income of $2.1
million, or $0.10 per diluted share, in the same period of 2008.
Excluding the one-time aforementioned charge, net income for the
first quarter of 2008 was $5.1 million, or $0.25 per diluted
share.
The Company opened one store and closed four stores during the
first quarter of 2009, ending the quarter with 94 retail locations,
including the Internet store.
As of March 31, 2009, cash, cash equivalents and marketable
securities totaled $92.6 million as compared to $55.6 million at
the end of March 31, 2008.
Arvind Dharia, Chief Financial Officer, commented, "We were
pleased with our performance in the first quarter and intend to
continue to focus on maintaining the strength of our balance sheet
and generating strong cash flow."
Company Outlook
The Company updated its fiscal 2009 guidance on April 23, 2009.
For fiscal 2009, the Company expects net sales to range from flat
to a decline of 2% compared to 2008. This guidance incorporates the
shift in the Candies business to a �first-cost� model from a
wholesale model and the shift in the International business to a
wholesale model from a �first-cost� model. Excluding the impact of
these changes, sales are expected to decline 2% to 4% for fiscal
2009. Diluted EPS for fiscal 2009 is expected to be in the range of
$1.85 to $1.95.
Conference Call Information
Interested stockholders are invited to listen to the first
quarter earnings conference call scheduled for today, Tuesday, May
5, 2009, at 8:30 a.m. Eastern Time. The call will be broadcast live
over the Internet and can be accessed by logging onto
http://www.stevemadden.com. An online archive of the broadcast will
be available within one hour of the conclusion of the call and will
be accessible for a period of 30 days following the call.
Additionally, a replay of the call can be accessed by dialing
888-203-1112, passcode 6408740, and will be available until June 5,
2009.
About Steve Madden
Steve Madden designs and markets fashion-forward footwear and
accessories for women, men and children. The shoes and accessories
are sold through company-owned retail stores, department stores,
apparel, footwear, and accessories specialty stores, and online at
http://www.stevemadden.com/. The Company has several licensees for
its brands, including for outerwear, cold weather accessories,
eyewear, hosiery, and bedding and bath products and owns and
operates 94 retail stores, including its online store. The Company
is the licensee for footwear, handbags and belts for Fabulosity,
for footwear for Elizabeth and James and l.e.i. and for handbags
and belts for Betsey Johnson and Daisy Fuentes.
This press release contains forward looking statements as that
term is defined in the federal securities laws. The events
described in forward looking statements contained in this press
release may not occur. Generally these statements relate to
business plans or strategies, projected or anticipated benefits or
other consequences of the Company's plans or strategies, projected
or anticipated benefits from acquisitions to be made by the
Company, or projections involving anticipated revenues, earnings or
other aspects of the Company's operating results. The words "may,"
"will," "expect," "believe," "anticipate," "project," "plan,"
"intend," "estimate," and "continue," and their opposites and
similar expressions are intended to identify forward looking
statements. The Company cautions you that these statements are not
guarantees of future performance or events and are subject to a
number of uncertainties, risks and other influences, many of which
are beyond the Company's control, that may influence the accuracy
of the statements and the projections upon which the statements are
based. Factors which may affect the Company's results include, but
are not limited to, the risks and uncertainties discussed in the
Company's Annual Report on Form 10-K for the year ended December
31, 2008. Any one or more of these uncertainties, risks and other
influences could materially affect the Company's results of
operations and whether forward looking statements made by the
Company ultimately prove to be accurate. The Company's actual
results, performance and achievements could differ materially from
those expressed or implied in these forward looking statements. The
Company undertakes no obligation to publicly update or revise any
forward looking statements, whether from new information, future
events or otherwise.
�
�
CONSOLIDATED STATEMENT OF OPERATIONS (In thousands, except
per share data) - unaudited � � Three Months Ended
Consolidated:
March 31, 2009
March 31, 2008
� Net Sales $ 107,429 $ 100,539 Cost of Sales � 63,942 � 60,324
Gross Profit 43,487 40,215 � Commission and Licensing Fee Income
2,905 3,356 Operating Expenses � 36,088 � 40,734 � Income from
Operations 10,304 2,837 � Interest and Other Income, Net � 396 �
526 Income Before Provision for Income Taxes 10,700 3,363 Provision
for Income Tax � 4,123 � 1,311 Net Income $ 6,577 $ 2,052 � Basic
Income Per Share $ 0.37 $ 0.10 Diluted Income Per Share $ 0.37 $
0.10 � Weighted Average Common Shares Outstanding - Basic 17,889
20,045 Weighted Average Common Shares Outstanding - Diluted 17,972
20,264 �
BALANCE SHEET HIGHLIGHTS
� � March 31, 2009 December 31, 2008 Consolidated Consolidated
(Unaudited) � � Cash and Cash Equivalents $ 63,235 $ 89,588
Investment Securities 29,395 35,224 Total Current Assets 167,081
194,736 Total Assets 254,145 284,693 Advances Payable - Factor -
30,168 Total Current Liabilities 34,061 72,490 Total Stockholder
Equity 214,100 206,242
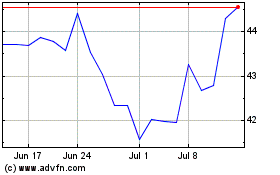
Steven Madden (NASDAQ:SHOO)
Historical Stock Chart
From Jun 2024 to Jul 2024

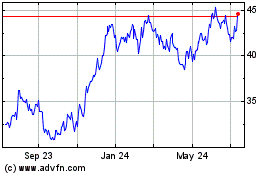
Steven Madden (NASDAQ:SHOO)
Historical Stock Chart
From Jul 2023 to Jul 2024
