Republic First Bancorp, Inc. Reports 46% Increase in Second Quarter
Earnings and Announces 10% Stock Dividend PHILADELPHIA, July 20
/PRNewswire-FirstCall/ -- Republic First Bancorp, Inc.
(NASDAQ:FRBK), (the "Company") the holding company for Republic
First Bank (PA) and First Bank of Delaware (DE), today reported
second quarter 2004 earnings of $1.7 million compared to $1.2
million for the prior year period, an increase of 46%. Year to date
earnings increased to $3.2 million in 2004, compared to $2.4
million, an increase of 31%. Diluted earnings per share for second
quarter 2004 increased to $0.24, from $0.17 in the prior year, an
increase of 41%. Year to date diluted earnings per share increased
to $0.46 compared to $0.37 in the prior year, an increase of 24%.
The improvement in 2004 earnings reflected commercial loan and core
deposit growth, increases in non-interest income and lower loan
loss provisions. Average commercial and construction loans grew 20%
in second quarter 2004 compared to the comparable prior year
period. Average core deposits in those periods grew by
approximately 11%. The Company also announced a 10% stock dividend
to shareholders of record as of August 5, 2004 payable as of August
24, 2004. Share and per share information has not been restated for
this dividend. Chairman Harry Madonna stated, "This stock dividend
reflects continuing improvements in earnings and other measures of
financial performance, and the sustained double-digit growth in
core businesses. We will continue to focus on our carefully
selected niche lines of business, each of which continues to meet
or exceed our current year's budget projections. We look forward to
making continued progress, and further increasing shareholder
value." Total shareholders' equity stood at $59.5 million with a
book value per share of $9.02 at June 30, 2004, based on
outstanding common shares of approximately 6.6 million. As of that
date, the Company continued to be well capitalized. Republic First
Bank (PA) and First Bank of Delaware (DE) are full-service,
state-chartered commercial banks, whose deposits are insured by the
Federal Deposit Insurance Corporation (FDIC). The Banks provide
diversified financial products through their twelve offices located
in Abington, Ardmore, Bala Cynwyd, East Norriton, and Philadelphia,
Pennsylvania and Wilmington, Delaware. The Company may from time to
time make written or oral "forward-looking statements," including
statements contained in the Company's filings with the Securities
and Exchange Commission. These forward-looking statements include
statements with respect to the Company's beliefs, plans,
objectives, goals, expectations, anticipations, estimates, and
intentions that are subject to significant risks and uncertainties
and are subject to change based on various factors, many of which
are beyond the Company's control. The words "may," "could,"
"should," "would," "believe," "anticipate," "estimate," "expect,"
"intend," "plan," and similar expressions are intended to identify
forward- looking statements. All such statements are made in good
faith by the Company pursuant to the "safe harbor" provisions of
the Private Securities Litigation Reform Act of 1995. The Company
does not undertake to update any forward- looking statement,
whether written or oral, that may be made from time to time by or
on behalf of the Company. Republic First Bancorp, Inc. Condensed
Income Statement (Dollar amounts in thousands except per share
data) Three Months Ended Six Months Ended June 30, June 30, 2004
2003 2004 2003 Net Interest Income $4,607 $8,293 $9,928 $17,393
Provision for Loan Losses 62 2,286 873 5,698 Other Income 2,830 497
5,577 1,392 Other Expenses 4,827 4,770 9,807 9,376 Income Taxes 865
583 $1,631 $1,267 Net Income $1,683 $1,151 $3,194 $2,444 Basic EPS
$0.26 $0.18 $0.49 $0.38 Diluted EPS $0.24 $0.17 $0.46 $0.37
Republic First Bancorp, Inc. Condensed Balance Sheet (Dollar
amounts in thousands) Assets June 30 June 30 2004 2003 Federal
Funds Sold and Other Interest Bearing Cash $52,398 $73,014
Investment Securities 64,112 62,589 Commercial and Other Loans
527,052 466,196 Allowance for Loan Losses (8,327) (7,876) Other
Assets 52,824 64,963 Total Assets $688,059 $658,886 Liabilities and
Shareholders' Equity: Transaction Accounts $304,613 $276,553 Time
Deposit Accounts 180,268 186,364 FHLB Advances and Trust Preferred
Securities 131,186 131,000 Other Liabilities 12,522 11,008
Shareholders' Equity 59,470 53,961 Total Liabilities and
Shareholders' Equity $688,059 $658,886 At or For the Three Months
Ended June 30, June 30, Financial Data: 2004 2003 Return on average
assets 0.98 % 0.69 % Return on average equity 11.47 % 8.58 % Share
information: Book value per share $9.02 $8.31 Shares o/s at period
end 6,583,238 6,492,000 Average diluted shares o/s 6,874,585
6,771,000 At or For the Six Months Ended June 30 June 30 Financial
Data: 2004 2003 Return on average assets 0.92 % 0.74 % Return on
average equity 11.03 % 9.26 % (Dollars in thousands except per
share data) Credit Quality Ratios: June 30 Dec. 31 June 30 2004
2003 2003 Non-accrual and loans accruing, but past due 90 days or
more $7,263 $8,611 $8,268 Restructured loans - - - Total
non-performing loans 7,263 8,611 8,268 OREO 207 207 1,015 Total
non-performing assets $7,470 $8,818 $9,283 Non-performing loans as
a percentage of total loans 1.38% 1.76% 1.77% Non-performing assets
as a percentage of total assets 1.08% 1.35% 1.41% Allowance for
loan losses to total loans 1.58% 1.78% 1.68% Allowance for loan
losses to total non-performing loans 114.65% 101.00% 94.96%
(Dollars in thousands ) Quarter to Date Average Balance Sheet Three
months ended Three months ended June 30, 2004 June 30, 2003
Interest-Earning Average Average Assets: Average Yield/ Average
Yield/ Balance Interest Cost Balance Interest Cost Commercial and
Other Loans $516,087 $7,861 6.09 % $463,733 $11,543 9.98 %
Investment Securities 65,764 526 3.20 67,323 746 4.44 Federal Funds
Sold 56,344 148 1.05 84,876 264 1.25 Total Interest- earning Assets
638,195 8,535 5.35 615,932 12,553 8.17 Other Assets 48,352 46,782
Total Assets $686,547 $8,535 $662,714 $12,553 Interest-bearing
Liabilities: Interest-bearing Deposits $381,758 $1,893 2.00 %
$393,198 $2,212 2.26 % Borrowed Funds 131,000 2,035 6.21 131,033
2,048 6.27 Other Liabilities 512,758 3,928 3.06 524,231 4,260 3.26
Non-interest and Interest-bearing Funding 608,984 3,928 2.60
596,167 4,260 2.87 Other Liabilities: 18,869 12,876 Total
Liabilities 627,853 609,043 Shareholders' Equity 58,694 53,671
Total Liabilities & Shareholders' Equity $686,547 $662,714 Net
Interest Income $4,607 $8,293 Interest Rate Spread 2.75 % 5.31 %
Net Interest Margin 2.89 % 5.40 % (Dollars in thousands) Year to
Date Average Balance Sheet Six months ended June 30, 2004 Average
Interest-Earning Assets: Average Yield/ Balance Interest Cost
Commercial and Other Loans $507,254 $16,343 6.44 % Investment
Securities 67,682 1,127 3.33 Federal Funds Sold 68,668 363 1.06
Total Interest-earning Assets 643,604 17,833 5.54
Non-Interest-earning Assets 48,462 Total Assets $692,066 $17,833
Interest-bearing Liabilities: Interest-bearing Deposits $392,949
$3,828 1.95 % Borrowed Funds 132,041 4,077 6.18 Total
Interest-bearing Liabilities 524,990 7,905 3.01 Cost of Funds
622,181 7,905 2.54 Non-Interest-bearing liabilities: 12,156 Total
Liabilities 634,337 Shareholders' Equity 57,729 Total Liabilities
& Shareholders' Equity $692,066 Net Interest Income $9,928
Interest Rate Spread 3.00 % Net Interest Margin 3.09 % Year to Date
Average Balance Sheet Six months ended June 30, 2003 Average
Interest-Earning Assets: Average Yield/ Balance Interest Cost
Commercial and Other Loans $474,606 $23,876 10.14 % Investment
Securities 76,158 1,745 4.58 Federal Funds Sold 76,512 492 1.30
Total Interest-earning Assets 627,276 26,113 8.39
Non-Interest-earning Assets 40,469 Total Assets $667,745 $26,113
Interest-bearing Liabilities: Interest-bearing Deposits $395,898
$4,631 2.36 % Borrowed Funds 132,959 4,089 6.20 Total
Interest-bearing Liabilities 528,857 8,720 3.33 Cost of Funds
603,412 8,720 2.91 Non-Interest-bearing Liabilities: 11,105 Total
Liabilities 614,517 Shareholders' Equity 53,228 Total Liabilities
& Shareholders' Equity $667,745 Net Interest Income $17,393
Interest Rate Spread 5.47 % Net Interest Margin 5.58 % DATASOURCE:
Republic First Bancorp, Inc. CONTACT: Paul Frenkiel, CFO, Republic
First Bancorp, +1-215-735-4422 ext. 255
Copyright
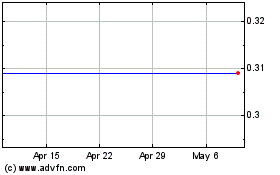
Republic First Bancorp (NASDAQ:FRBK)
Historical Stock Chart
From May 2024 to Jun 2024

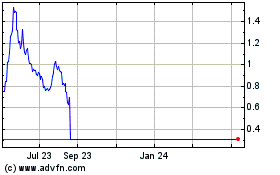
Republic First Bancorp (NASDAQ:FRBK)
Historical Stock Chart
From Jun 2023 to Jun 2024
