United States
Securities and Exchange Commission
Washington, D.C. 20549
FORM 6-K
REPORT OF FOREIGN PRIVATE ISSUER
PURSUANT TO RULE 13a-16 OR 15d-16 UNDER
THE SECURITIES EXCHANGE ACT OF 1934
For the month of August 2023
Commission File Number 132-02847
INTER & Co, INC.
(Exact name of registrant as specified in its charter)
N/A
(Translation of Registrant’s executive offices)
Av Barbacena, 1.219, 22nd Floor
Belo Horizonte, Brazil, ZIP Code 30 190-131
Telephone: +55 (31) 2138-7978
(Address of principal executive office)
Indicate by check mark whether the registrant files or will file annual reports under cover of Form 20-F or Form 40-F.
Form 20-F ☒ Form 40-F ☐
Indicate by check mark if the registrant is submitting the Form 6-K in paper as permitted by Regulation S-T Rule 101(b)(1):
Yes ☐ No ☒
Indicate by check mark if the registrant is submitting the Form 6-K in paper as permitted by Regulation S-T Rule 101(b)(7):
Yes ☐ No ☒
EXHIBIT INDEX
| | | | | | | | |
| Exhibit No. | | Description of Exhibit |
| | |
| 99.1 | | |
| | |
| | |
SIGNATURE
Pursuant to the requirements of the Securities Exchange Act of 1934, the registrant has duly caused this report to be signed on its behalf by the undersigned, thereunto duly authorized.
| | | | | | | | | | | |
| | | |
| INTER & Co, INC. |
| By: | /s/ Santiago Horacio Stel |
| | Name: | Santiago Horacio Stel |
| | Title: | Senior Vice President of Finance and Risks |
Date: August 15, 2023
2Q23
Institutional Presentation
2Q23
Institutional Presentation
August 14th, 2023
INSTITUTIONAL PRESENTATION | 2Q23
This report may contain forward-looking statements regarding Inter, anticipated synergies, growth plans, projected results and future strategies. While these forward-looking statements reflect our Management’s good faith beliefs, they involve known and unknown risks and uncertainties that
Disclaimer
could cause the company’s results or accrued results to differ materially from those anticipated and discussed herein. These statements are not guarantees of future performance. These risks and uncertainties include, but are not limited to, our ability to realize the amount of projected synergies and the projected schedule, in addition to economic, competitive, governmental and technological factors affecting Inter, the markets,products and prices and other factors. In addition, this presentation contains managerial numbers that may differ from those presented in our financial statements. The calculation methodology for these managerial numbers is presented in Inter’s quarterly earnings release.
Statements contained in this report that are not facts or historical information may be forward-looking statements under the terms of the Private Securities Litigation Reform Act of 1995. These forward-looking statements may, among other things, beliefs related to the creation of value and any other statements regarding Inter. In some cases, terms such as “estimate”, “project”, “predict”, “plan”, “believe”, “can”, “expectation”, “anticipate”, “intend”, “aimed”, “potential”, “may”, “will/shall” and similar terms, or the negative of these expressions, may identify forward looking statements.
These forward-looking statements are based on Inter's expectations and beliefs about future events and involve risks and uncertainties that could cause actual results to differ materially from current ones. Any forward-looking statement made by us in this document is based only on information currently available to us and speaks only as of the date on which it is made. We undertake no obligation to publicly update any forward-looking statement, whether written or oral, that may be made from time to time, whether as a result of new information, future developments or otherwise. For additional information that about factors that may lead to results that are different from our estimates, please refer to sections “Cautionary Statement Concerning Forward-Looking Statements” and “Risk Factors” of Inter&Co Annual Report on Form 20-F.
The numbers for our key metrics (Unit Economics), which include active users, as average revenue per active client (ARPAC), cost to serve (CTS), are calculated using Inter’s internal data. Although we believe these metrics are based on reasonable estimates, but there are challenges inherent in measuring the use of our business. In addition, we continually seek to improve our estimates, which may change due to improvements or changes in methodology, in processes for calculating these metrics and, from time to time, we may discover inaccuracies and make adjustments to improve accuracy, including adjustments that may result in recalculating our historical metrics.
About Non-IFRS Financial Measures
To supplement the financial measures presented in this press release and related conference call, presentation, or webcast in accordance with IFRS, Inter&Co also presents non-IFRS measures of financial performance, as highlighted throughout the documents. The non-IFRS Financial Measures include, among others: Adjusted Net Income, Cost to Serve, Cost of Funding, Efficiency Ratio, Underwriting, NPL > 90 days, NPL 15 to 90 days, NPLand Stage 3 Formation, Cost of Risk, Coverage Ratio, Funding, All-in Cost of Funding, Gross Merchandise Volume (GMV), Premiuns, Net Inflows, Global Services Deposits and Investments, Fee Income Ratio, Client Acquisition Cost, Cards+PIX TPV, Gross ARPAC, Net ARPAC, Marginal NIM 1.0, Marginal NIM 2.0, Net Interest Margin IEP + Non-int. CC Receivables (1.0), Net Interest Margin IEP (2.0), Cost-to-Serve.
A “non-IFRS financial measure” refers to a numerical measure of Inter&Co’s historical or financial position that either excludes or includes amountsthat are not normally excluded or included in the most directly comparable measure calculated and presented in accordance with IFRS in Inter&Co’s financial statements.
Inter&Co provides certain non-IFRS measures as additional information relating to its operating results as a complement to results provided in accordance with IFRS. The non-IFRS financial information presented herein should be considered together with, and not as a substitute for or superior to, the financial information presented in accordance with IFRS. There are significant limitations associated with the use of non-IFRS financial measures. Further, these measures may differ from the non-IFRS information, even where similarly titled, used by other companies and therefore should not be used to compare Inter&Co’s performance to that of other companies.
Agenda
1.
Company Overview
2.
Competitive Advantages
3.
Business Verticals
4.
Lending and Financing
5.
Financials
6.
ESG Updates
Agenda
1.
Company Overview
2.
Competitive Advantages
3.
Business Verticals
4.
Lending and Financing
5.
Financials
6.
ESG Updates
Agenda
1.
Company Overview
2.
Competitive Advantages
3.
Business Verticals
4.
Lending and Financing
5.
Financials
6.
ESG Updates Branch-Based Distribution High Distribution Costs Substantial Carbon Emissions Travel Costs To Costumers Long Waiting Lines Overcharged Customers Bank Statement Emission Fees Wire Transfers Investments Fees Loans Rates Legacy Technology
Multiple Apps Banking Account Credit Card Trading & Investments No Cashback No E-commerce Pushing Bad Products 100% Digital Reaching Many Communities Environmentally Friendly Digital Costumer Service Cloud Based Servers Free Digital Account No Transfer Fees Commission Free Trading Loans Rates Payroll: no middleman (“pastinhas”) Insurance: no intermediaries Investments: no IFAs
Shop: no MDRs Win-Win Model Note 1: In comparison to traditional banks business model.
INSTITUTIONAL PRESENTATION | 2Q23
Combining innovative technology with traditional bank strength
Mission
Empower People to ManageTheir Finances & Daily Activities
Simple
Engaging Innovative
100% Digital
Seamlessly
Integrated Full Banking Licensed Wide Range of Products Robust Credit Underwriting Strong Deposit Franchise High Standards of Corporate Governance Low-Cost Structure Broad Digital Ecosystem Focus on UX Highly Scalable Architecture Innovation Driven Culture Traditional Banks Tech Companies
Our strong product rollout to attract new clients Phase One:
Traditional Bank Phase Two: Digital Account Phase Three: Super App Phase Four: US Expansion Corporate Milestones Intermedium was founded Full Banking License Digital Account Rebranding: Banco Inter Migration to AWS SME Payroll Real Estate Insurance Invest Debit and Credit Cards Marketplace FGTS Loans Global Account Inter Loop M&A 2Q19 1Q21 1Q21 2Q21
8.5 10.2 IPO 1st Follow-on 2nd Follow-on 3rd Follow-on Nasdaq Listing 2Q21 4Q21 1Q23 22.8 24.7 26.3 27.8 1994 SME Payroll
2008 Real Estate Insurance 2015 Invest Debit and Credit Cards 2017 2018 Marketplace FGTS Loans 18.6 20.7 Global Account Inter Loop
1999 2001 2007 2012 2013 2016 3Q19 1Q22 16.3 1Q22 2Q23 M&A M&A M&A M&A 12.0 13.9 M&A M&A 2Q19 1Q21 1Q21 2Q21
8.5 10.2 2Q21 4Q21 1Q23
Unlocking the potential value from our strong customer foundation
Strong Market Share at the Beginning of the Journey, with Significant Upside as Our Client Base Matures
1 .04 % 1 .06 % 13.1% 1 .04 % 1 .02 % 1 .04 % 1 .04 % 1 .04 % 1 .04 % 1 .04 % 1 .0 % 1 .02 % 1 .02 % 1 .0 % 7.9% 1 .02 % 1 .0 % 1 .02 %
1 .02 % 8 .0% 1 .0 % 1 .0 % 1 .0 % 8 .0% 8 .0% 6 .0% 8 .0% 6 .0% 4.8% 8 .0% 8 .0% 6 .0% 6 .0% 6 .0% 4 .0% 2 .0% 4 .0% 2 .0% 2.3% 4 .0%
1.5% 4 .0% 2 .0% 1.0% 4 .0% 2 .0% 0.1% 0 .0% 0 .0% Bank Account PIX 0 .0% FGTS Inter 0 .0% Credit 0 .0% Payroll 0 .0% FX Penetration1
+300 bps Transactions2 +24 bps Loans3 +462 bps Shop4 CLIENT JOURNEY +23 bps Cards Loans5 +17 bps Loans6 +9 bps Flows7 Higher ARPAC Note: All market share and market share gains are comparisons between 2Q23 and 2Q22, except when said otherwise. Note 1:. Market data from Brazilian Central Bank. Number of Individuals with current relationships with the National Financial System, counted only once, even if they have relationships with more than one institution. Note 2: Market data from Brazilian Central Bank comparing number of transactions between 2Q23 and 2Q23, Note 3: Internal Estimates Total FGTS Loans in 2Q23 and 2Q22 based on public government figures. Note 4: Internal Estimates for Total Brazilian e-Commerce GMV for 2022 and 2021. Note 5:Total credit card loan portfolio according to Banco Central do Brasil data in 2Q23 and 2Q22. Note 6: Total payroll loan portfolio according to Banco Central do Brasil data in 2Q23 and 2Q22. Inter excluding FGTS loans. Note 7: FX Transactions in Brazil. Data from Brazilian Central Bank.
Company Overview Competitive Advantages Business Verticals Lending and Financing Financials ESG Updates Appendix 8
Significant addressable credit market to explore Total Loan Portfolio in Brazil In R$ Billion Total Addressable Brazilian Credit Market
R$ 5.0 Tn Total Banking Account Penetration in Brazil1 In Million, June/23 Individuals with Bank Account in Brazil R$ 1.0 Tn
Overdraft + Others R$ 0.1 Tn R$ 1.9 Tn R$ 2.1 Tn Others R$ 0.6 Tn 192 mm Brazil 13.1% ↑ 300 bps YoY Credit Card R$ 0.5 Tn Companies with Bank Account in Brazil 18.6 mm Brazil Agribusiness R$ 0.5 Tn 9.0% ↑ 100 bps YoY Sources: Banco Central do Brazil, ABECIP and Inter. Note 1:. Market data from Brazilian Central Bank. Number of Individuals and Companies with current relationships with the National Financial System, counted only once, even if they have relationships with more than one institution. Company Overview Competitive Advantages
Business Verticals Lending and Financing Financials ESG Updates Appendix 9
Agenda
1. Company Overview
2. Competitive Advantages
3. Business Verticals
4. Lending and Financing
5. Financials
6. ESG Updates
1 2 3 4 5 High growth platform Uniquely high fee income revenue Best-in-class funding base Strongly capitalized balance sheet Underleveraged clients % Company Overview Competitive Advantages Business Verticals Lending and Financing Financials
ESG Updates Appendix 11Significant competitive advantages
Significant competitive advantages Company Overview Competitive Advantages Business Verticals Lending and Financing Financials ESG Updates Appendix 12 INSTITUTIONAL PRESENTATION | 2Q23 High growth platform 1 70% 65% 74% 75% 65% 64% 65% 67% 69% 70% 30% 35%
26% 25% 35% 36% 35% 33% 31% 30% 417 467 607 731 834 877 850 1,002 1,024 1,150 544 636 837 1,100 1,281 1,461 1,540 1,704 1,800 1,939 0
5 0 10 0 0 15 0 0 2 00 1Q21 2Q21 3Q21 4Q21 1Q22 2Q22 3Q22 4Q22 1Q23 2Q23 Net Fee Revenue Net Interest Revenue Total Net Revenue
Total Gross Revenue Uniquely high fee income revenue 2 70% 30% NII Fees1 Revenue In R$ Million 2Q23 Net Revenue Breakdown In %
Median of Incumbent Banks Median of Digital Banks ~25% Fees1 ~75% NII ~87% NII ~13% Fees1 +12% Average Quarterly Growth Source: Peers
Significant competitive advantages Company Overview Competitive Advantages Business Verticals Lending and Financing Financials ESG Updates Appendix 13 INSTITUTIONAL PRESENTATION | 2Q23 Best-in-class funding base 3 Strongly capitalized balance sheet 4 Underleveraged clients
5 63% ~75% ~85% Inter Median of Incubent Banks Median of Digital Banks 5 0.0 % 5 5.0 % 6 0.0 % 6 5.0 % 7 0.0 % 7 5.0 % 8 0.0 % 8 5.0 % 9 0.0 % 9 5.0 % 1 0 .0% Cost of Funding In % of CDI 22.8% 14.9% 14.7% 13.5% 12.6% 11.8% Inter Bank 1 Bank 2 Bank 3 Bank 4 Bank 5 Tier-I Ratio1 In % ~2x Latest Tier-I of Brazil’s 5 Largest Banks1 991 716 1,540 5,093 6,011 7,733 9,018 0 1000 2000 3000 4000 5000 6000
7000 8000 9000 10000 Inter Digital Bank 1 Digital Bank 2 Digital Bank 3 Incumbent Bank 1 Incumbent Bank 2 Incumbent Bank 3 Loan Balance per Total Client In R$, per total client ~6x Lower than Peers Peer Median 5,552 ~0.8x Source: Peers figures according to the competitors’ latest available IFRS financial statements and other public documents. Note 1: Tier 1 ratio according to latest available BACEN GAAP financial statements and other public documents. Note 2: Demand Deposits and Time Deposits. Peer Median 3,041 ~3x Lower than Peers
Clients Deposits2 per Total Client In R$, per total client 763 1,008 1,649 4,432 6,017 7,348 0 2000 4000 6000 8000 10000 Inter Digital
Bank 2 Digital Bank 1 Digital Bank 3 Incumbent Bank 1 Incumbent Bank 3 Incumbent
Agenda
1. Company Overview
2. Competitive Advantages
3. Business Verticals
4. Lending and Financing
5. Financials
6. ESG Updates
Highly effective strategy with our verticals as the pillars Company Overview Competitive Advantages Business Verticals Lending and Financing Financials ESG Updates Appendix 15 INSTITUTIONAL PRESENTATION | 2Q23 Integrated business model Build Client Base & Funding
Grow Monetization & Activation Expand Gaining Market Share BANKING & SPENDING CREDIT SHOP INSURANCE INVEST GLOBAL LOYALTY / Engagement
/ Cross Selling / ARPAC Bringing even more: Possible new revenue stream Highly effective strategy with our verticals as the pillars
Company Overview Competitive Advantages Business Verticals Lending and Financing Financials ESG Updates Appendix 15 INSTITUTIONAL PRESENTATION | 2Q23 Integrated
Banking & Spending: Building a strong client base Digital Account Deposits Debit & Credit Cards Pix Wire Transfers Digital Wallets
& many more... Note 1: Total Brazilian market total payment volume of cards according to Abecs. The base of our financial ecosystem
A full licensed bank Attracting new costumers With a wide range of day-to-day services Payments To build strong engagement In order to explore our cross-selling capabilities Primary Bank Relationship In % of Active Clients Company Overview Competitive Advantages Business Verticals Lending and Financing Financials ESG Updates Appendix 16 Checking Account INSTITUTIONAL PRESENTATION | 2Q23 2Q23
1Q18 + 197 BN Cards + PIX TPV (R$) 2Q23 2.2 % Cards TPV Market Share1 2Q23
Credit: Robust income stream Note 1: Internal Estimates Total FGTS Loans in 2Q23 and 2Q22 based on public government figures. Note 2: Market data from Banco Central do Brasil. Supply chain Credit card receivables Receivables Credit Cards Loans Payroll Loans FGTS Loans
Real Estate Home Equity Auto Loans Working Capital & many more... Overdraft Offering a wide range of credit options With growing client adoption Generating great outcomes for Inter 2Q23 Highlights 0.1 0.2 0.4 0.6 0.8 1.0 1.3 0.0 0.2 0.4 0.6 0.8 1.0 1.2 1.4 4Q21 1Q22 2Q22 3Q22 4Q22 1Q23 2Q23 Active Credit Clients In Million Company Overview Competitive Advantages Business Verticals Lending and Financing Financials ESG Updates Appendix 17 26.5 BN Gross Loan Portfolio (R$) 33% YoY ↑ 9.5 % NIM 2.0 – IEP Only 140 bps YoY ↑ 4.8 % FGTS Loans
Market Share1 462 bps YoY ↑ 1.5 % Credit Cards Loans Market Share2
Inter Shop & Commerce Plus: Engaging clients in the App Inter Shop Revenue & Take Rate In R$ Million and % 30 44 48 59 54 67 99 113 102
112 95 104 2 5.0 4 5. 0 6 5. 0 8 5. 0 10 5. 0 12 5.0 Shopping (Marketplace) Giftcard Car Tag Travel ShellBox Food & Duo Gourmet
Inter Cel & Top Up & many more… To offer a complete suite of products and services Note 1: Number of transactions through Inter Shop during the quarter. Company Overview Competitive Advantages Business Verticals Lending and Financing Financials ESG Updates Appendix 18
INSTITUTIONAL PRESENTATION | 2Q23 + 2.7 MM Active Clients 2Q23 9.3 MM Products Sold (Units)1 2Q23 Partnering with the best brands and retailers in Brazil and across the world 2.8% 4.4% 5.1% 5.9% 6.5% 8.9% 9.4% 11.4% 10.9% 11.2% 11.4% 13.8% 0. 0% 2. 0% 4. 0% 6. 0% 8. 0%
10. 0% 12. 0% 14. 0% 16. 0% 1Q22 2Q22 3Q22 4Q22 1Q23 2Q23 Net Take Rate
Insurance: Exploring one of Latin America’s most complete insurance portfolio Full range of insurance products Company Overview Competitive Advantages Business Verticals Lending and Financing Financials ESG Updates Appendix 19 INSTITUTIONAL PRESENTATION | 2Q23 Pet
Life Travel Telemedicine Auto Cards Income Dental Home & assistance Consortium 3rd parties Auto Credit Generating a scalable operation and bringing solid business results Accelerated by data analytics, customer journey triggers and cross-selling + + Propensity algorithms for
hyper-personalization Behavioral journeys, based on customer usage In-app cross-selling opportunities
Investments: Capitalizing on synergistic opportunities 2Q23 Highlights: R$ 7.5bn 3rd party fixed income R$ 43mm net revenue
AuC and Active Clients In R$ Billion and Million 58.1 54.6 62.3 66.7 68.0 76.8 2.0 2.2 2.4 2.8 3.3 3.6 -1.0 -0. 5 0. 0 0. 5 1.0
1.5 2. 0 2. 5 3. 0 3. 5 4. 0 40.0 50.0 60.0 70.0 80.0 90.0 100.0 110.0 120.0 1Q22 2Q22 3Q22 4Q22 1Q23 2Q23 AuC Active Investments Clients
And important results for Inter & many more... Home Broker Private Pension Fund Fixed Income Investment Funds Crypto Government Bonds
Equity research CDB mais limite Product Rollout Company Overview Competitive Advantages Business Verticals Lending and Financing Financials ESG Updates Appendix 20 Inter Invest Model A digital experience Delivered 100% via B2C Bypassing the FA channel To create savings for our customers ü Cashback rewards ü Commission free trading ü Low-cost funds And important results for Inter 2Q23 Highlights:
R$ 7.5bn 3rd party fixed income R$ 43mm net revenue
Keeping our innovative DNA with a prudent approach in the US Product Rollout Pipeline Remittances Gift Cards Global
Account Lending Product Rollout Pipeline Investments Broker Dealer Single App Credit Card Global Services Clients1 In Thousand AuC & Deposits in US Dollars In USD Million Debit Card Assets under Custody4 Deposit balance3 Securities5 Real estate fund 50 141 501 1,127
1,447 1,782 1Q22 2Q22 3Q22 4Q22 1Q23 2Q23 E-Commerce Full Platform Investment Advisory Buy Now Pay Later 1Q22 2Q22 3Q22 4Q22 1Q23 2Q23 1Q22 2Q22 3Q22 4Q22 1Q23 2Q23 Note 1: Includes Brazilian Global Account clients, US clients and International Investors. Note 2: Source: Panrotas.com.br. Note 3: Amount included in Demand Deposit balance on IFRS Financial Statement. Note 4: Assets under APEX Custody. Note 5: Securities under APEX Custody.
New rewards program to drive synergies across business verticals Introducing our New Rewards Program More Options for Clients Earn points:
Credit Card Bills “Conta com Pontos” Missions Acompliments + 3MM Clients in 2 months Burn points: Cashback Extra Cashback in Inter Shop Credit Card Bill Discount Airline Miles Investments Connecting all verticals Before Only Cashback Now Cashback + Multiple Options
Unlocking Significant Results for Inter Company Overview Competitive Advantages Business Verticals Lending and Financing Financials
ESG Updates Appendix 2222
Agenda
1. Company Overview
2. Competitive Advantages
3. Business Verticals
4. Lending and Financing
5. Financials
6. ESG Updates
ROE-driven loan portfolio growth
Gross Loan Portfolio
In R$ Billion 4.8 16% 10% 21% 8.8 17.5 2% 17.2 27% 24.5 8% 19.9 2% 19.5 30% 2% 15% 1%
21% 25.1 26.5> 70% collateralized portfolio2
Continuous focus towards repricing 2019 2020 2021 2022 2Q22 1Q23 2Q23
Breakdown of loan portfolio growth 2Q23 Gross Loan Portfolio Growth and Balance In % QoQ and in R$ Billion 26.2% R$ 1.3 Bn
• Strong growth in FGTS and Home Equity, higher ROE products 8.8% 6. % % 2.0% 0 0% 2.0% 5.6% R$ 7.7 Bn 5.2% R$ 5.2 Bn 3.4%
2.8% 5.4% 2.8% Total Loan Portfolio Growth 0.0% 0.0% FGTS Home Equity1 Highest ROE Loans Credit Card 0.0 0. Real Estate Payroll
SMBs Antecip. of CC Rec. Note 1: Home Equity includes both business and individuals’ portfolio. Company Overview Competitive Advantages
Business Verticals Lending and Financing Financials ESG Updates Appendix 2255
Provisioning level maintaining stable coverage ratio Cost of Risk1 In % Coverage Ratio In % 126% 129% 141% 132% 131% 130%
• Stable coverage ratio 4.9% 5.2% 5.2% 4.8% 4.8% 5.1% 5.0% 4.5% 6.5% 6.0% 5.6% 6.2% 2.1% 1.1%
1.9% 1.0% 1.1% 1.1% 1Q22 2Q22 3Q22 4Q22 1Q23 2Q23 1Q22 2Q22 3Q22 4Q22 1Q23 2Q23 Cost of Risk (Excl. Antic. Of C.C. Receiva bles) Cost of Risk Cost of risk (Excluding Credit Cards) Note: All definitions are in the Glossary section of this Institutional Presentation. Note 1: 1Q22: managerial number, excluding non-recurrent provision. Company Overview Competitive Advantages Business Verticals Lending and Financing Financials ESG Updates Appendix 2266
Strengthening retail deposit franchise with cost-efficient funding at scale Funding In R$ Billion % YoY % QoQ 67.2% 64.5% 67.5% 61.9% 61.2% 65.0% 63.3% -7 .0 % 2.1 p.p. -1.7 p.p. 6 .05 % All-In Cost of Funding as % of CDI 29.8 30.8 33.3 5%; 1.6
6 .0 % +45 29% +14% +8%
+6% Total Other1 +13.2 million clients 6.4
6%; 0.4 27%; 1.7 14.2 21.9 25.9 +15% +6% +52% +11% +20% +6% Securities Issued Time
Deposits2 Transactional Accounts Balance3
trusting Inter with their deposits 2019 2020 2021 2022 2Q22 1Q23 2Q23
Note 1: Includes saving deposits and creditors by resources to release. Note 2: Excluding Conta com Pontos correspondent balance. Note 3: Includes Conta com Pontos correspondent balance and demand deposits. Company Overview Competitive Advantages Business Verticals Lending and Financing Financials ESG Updates Appendix 2277
Agenda
1. Company Overview
2. Competitive Advantages
3. Business Verticals
4. Lending and Financing
5. Financials
6. ESG Updates
What are our drivers for value creation? High Fee Income Increasing NIM Active Client Growth 35. 0% Fee Income Ratio1
% of Total Net Revenue ~20% Bigger than 10 .0 % 9.5 % NIM In % 8.7% 9.5% 15.0 14.0 Active Clients In Million 12.6 13.5 14.5 30 .0 % 25. 0% 20 .0 % 30% Incumbent Banks ~25% ~125% Bigger than Digital Banks 9.0 % 8 .5 % 8 .0 % 7 .5% 7 .0 % 8.0% 8.1% 6.9% 7.0% 7.4% 6.4% 8.4% 7.2% 7.4% 8.1% 13.0 12.0 11.0 10.0 9.0 10.7 9.6 11.6 15. 0% 10. 0% ~13% 6.5 % 6.0 % 5 .5 % 5 .0 % NIM 2.0 - IEP Only NIM 1.0 - IEP + Non-int CC Receiva bles 8.0 7.0 6.0 Inter Median of Incumbent Banks Median of Digital Banks 1Q22 2Q22 3Q22 4Q22 1Q23 2Q23 1Q22 2Q22 3Q22 4Q22 1Q23 2Q23 Unlocking Significant Earnings Potential through Strategic Value Drivers Note 1: Peers figures according to the peers’ IFRS financial statements as of 1Q23 and other public documents. Company Overview Competitive Advantages Business Verticals Lending and Financing Financials ESG Updates Appendix 29
Accelerating revenues with balanced mix of NII and fees Revenue In R$ Million 636 544 837 1,100 731
25% 1,540
1,461 1,281 834 877 850
35% 36% 35% 1,800 1,704 1,002 1,024 33% 31% 1,939 1,150
30% % YoY +33% +31% +10% % QoQ
+8% +12% +11% • Reacceleration of fee revenue across business lines• Strong NII growth given repricing and better loan mix 467
417 30% 35% 70% 65% 26% 74% 75% 65% 64% 65% 67% 69% 70% +43% +13% Acceleration 1Q21 2Q21 3Q21 4Q21 1Q22 2Q22 3Q22 4Q22 1Q23 2Q23 Net Interest Income Net Fee Revenue Total Net Revenue Total Gross Revenue Company Overview
Competitive Advantages Business Verticals Lending and Financing Financials ESG Updates Appendix 3300
Combining fee revenue growth with efficiency initiatives to achieve excellence
Net Fee Revenue and SG&A Evolution In R$ Millions % YoY % QoQ 42% 41% 52% 57% 50% 48% 685 52% 60% + 9.6 p.p. + 5.0 p.p.
Net Fee Revenue ÷ SG&A Peers Net Fee Revenue ÷ SG&A
~35% Median of 391 387 0 0 165 159 603 30% 183 558 557 290 316 592 295 327 313 596 575 348 +3% -3% +10% +11% SG&A
Net Fee Revenue Digital Banks ~65% Median of Incumbent Banks - 2Q21 3Q21 4Q21 1Q22 2Q22 3Q22 4Q22 1Q23 2Q23 Source: Peers figures according to the competitors’ latest available IFRS financial statements and other public documents. Company Overview Competitive Advantages Business Verticals Lending and Financing Financials ESG Updates Appendix 31
Boosting employee productivity to improve efficiency Active Clients per Employee1 In Thousand + 0.7 4.2 Cost-to-Serve In R$, monthly
Headcount optimization from 4.1k in December to 3.4k in June + 0.2 2.3 + 0.1 2.5 2.6 + 0.3 2.9 + 0.2 + 0.4 3.1 3.5 21.2 17.5
-20% YoY 17.1 15.7 15.8 13.8 12.5 0. 5 4Q21 1Q22 2Q22 3Q22 4Q22 1Q23 2Q23 4Q21 1Q22 2Q22 3Q22 4Q22 1Q23 2Q23 Note 1: Including interns. Company Overview Competitive Advantages Business Verticals Lending and Financing Financials
ESG Updates Appendix 3322
Strong NIM expansion, reaching highest levels in multiple years 1 Conversion to Market 2 Ongoing Repricing 3 Loan Mix Change 4 Evolution into 2H23 10. 0% 9. 0% 8. 0% 7. 0% 6.4% 7.3% 8.1% 8.3% 8.0% 8.1%
7.2% 7.3% 6.9% 7.0% 6.4% 7.4% 7.2% 8.4% 8.7%
7.4% 9.5% 8.1% Conta com Pontos
full implementation 6. 0% 5. 0% Scale New Products Overdraft, BNPL, Auto 4. 0% 3. 0% 2. 0% SELIC decrease downward trend
1.0 % 0. 0% 2Q213Q21 4Q21 1Q22 2Q22 3Q22 4Q22 1Q23 2Q23 NIM 1.0 - IEP + Non-int. CC Receivables (%) NIM 2. 0 - IEP Only (%) Company Overview Competitive Advantages Business Verticals Lending and Financing Financials ESG Updates Appendix 33
Meaningful improvements in operational leverage Revenue vs. Expenses In %, index in a 100 basis Efficiency Ratio
In % 88% 114 119 117 120 115 163 137 140 117 108 158 127 Net revenue1 Personnel Expenses 64% 72% 49% 68% 43% 75% 73% 48% 42%
62% 40% 53% Total 99 95 96 Personnel + 32% Administrative 100 89 89 86 80 87 89 88 92 Administrative Expenses
Administrative 80 Expenses 22% 19% 21% 22% 26% 18% 17% Eff. Ratio Personnel Eff. Ratio
7 0 4Q21 1Q22 2Q22 3Q22 4Q22 1Q23 2Q23 4Q21 1Q22 2Q22 3Q22 4Q22 1Q23 2Q23
Record low efficiency ratio, proving that we are doing even more with less
Note: All definitions are in the Glossary section of this Institutional Presentation. Note 1: Net revenue = net revenue - tax expenses.
Company Overview Competitive Advantages Business Verticals Lending and Financing Financials ESG Updates Appendix 34
Sequential expansion of gross profit per client ARPAC and CTS Evolution In R$, Monthly 46 47 46 47 46 46
44 32 32 28 28 37 34 34 32 29 31 29 32 32 16 17 1Q21 2Q21 3Q21 4Q21 1Q22 2Q22 3Q22 4Q22 1Q23 2Q23 Gross Profit per Active Client (Net of Cost of Funding) 1 Gross Profit per Active Client (Gross of Cost of Funding)2
ARPAC Gross of Cost of Funding 3 ARPAC Net of Cost of Funding 4 Cost-to-serve5 Improvement Note 1: Gross Profit per Active Client (Net of Cost of Funding) = ARPAC Gross of Cost of Funding – Cost-to-serve. Note 2: Gross Profit per Active Client (Net of Cost of Funding) = ARPAC Net of Cost of Funding – Cost-to-serve. Note 3: ARPAC Gross of Cost of Funding = [((Interest income + (revenue from services and commissions − Cashback expenses – Inter rewards expense) + Income from securities and derivatives + Other revenue) ÷ 3] ÷ (Average of the last 2 quarters Active Clients). Note 4: ARPAC Net of Cost of Funding = [(((Interest income + (revenue from services and commissions − Cashback expenses – Inter rewards expense) + Income from securities + Net gains (losses) from derivatives + Other revenue) - Interest expenses) ÷ 3] ÷ (Average of the last 2 quarters Active Clients). Note 5: Cost-to-serve = [(Personnel Expenses + Administrative Expenses – Client Acquisition Cost) ÷ 3] ÷ Average Active Clients. Company Overview Competitive Advantages Business Verticals Lending and Financing Financials ESG Updates Appendix 35
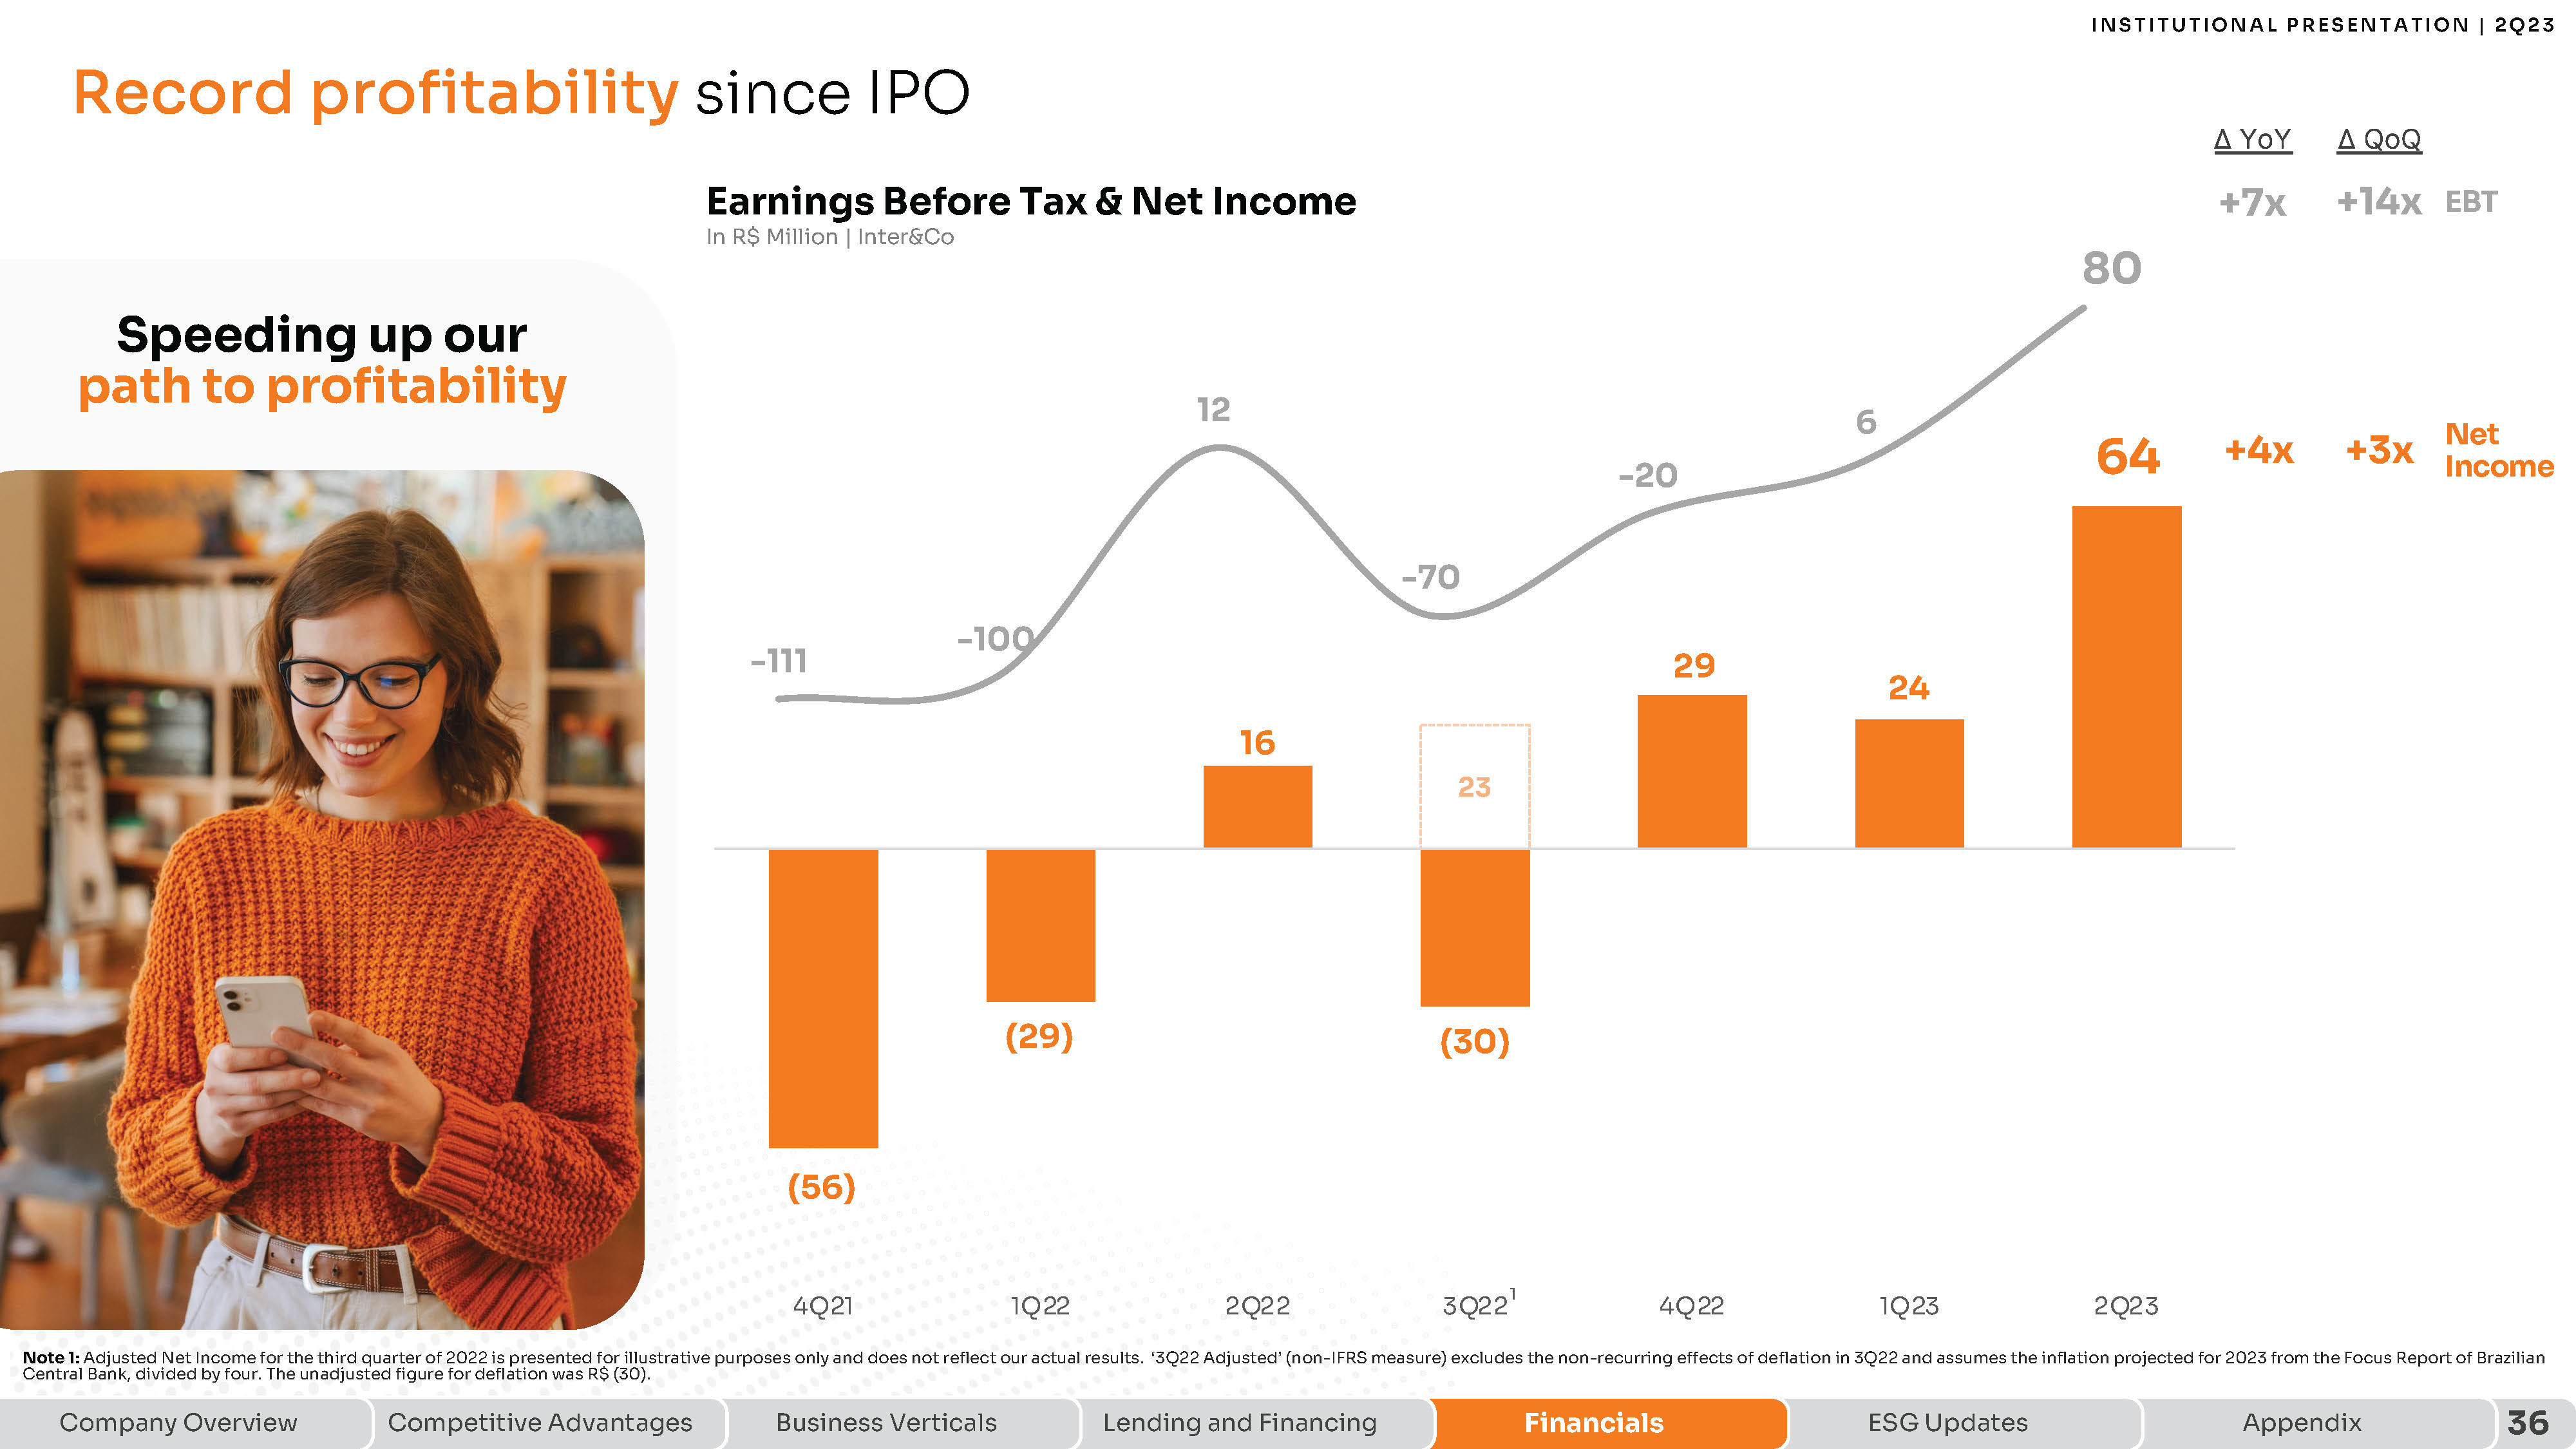
Record profitability since IPO
Earnings Before Tax & Net Income
In R$ Million | Inter&Co
Δ YoY +7x 80 Δ QoQ +14x EBT Speeding up our path to profitability 12 6 -20 64 +4x +3x Net Income -111 -100 -70
16 29 24 (29) (30) (56) 4Q21 1Q22 2Q22 3Q221 4Q22 1Q23 2Q23 Note 1: Adjusted Net Income for the third quarter of 2022 is presented for illustrative purposes only and does not reflect our actual results. ‘3Q22 Adjusted’ (non-IFRS measure) excludes the non-recurring effects of deflation in 3Q22 and assumes the inflation projected for 2023 from the Focus Report of Brazilian Central Bank, divided by four. The unadjusted figure for deflation was R$ (30). Company Overview Competitive Advantages Business Verticals
Lending and Financing Financials ESG Updates Appendix 3366
Agenda
1. Company Overview
2. Competitive Advantages
3. Business Verticals
4. Lending and Financing
5. Financials
6. ESG Updates
Improvements and ESG initiatives High corporate governance levels Improvements in Eco-Efficiency • Two-layer regulatory governance (SEC and CVM) • Creation of Audit Committee IN STITUTIO N A L P RESEN TA TIO N | 2 Q 2 3 • Inclusion of explicit Inter&Co Tag Along rights Rating Evolution • Sequentially upgraded on both MSCI and CDP ESG Rating MSCI CDP -96% -95% Water consumption
per client1 Carbon footprint per client1 B BB BBB C B- -95% Energy consumption per client1 Oct/19 Sep/20 Jun/22 ESG Initiatives 2021 2022 Option for clients to donate their Cashback Vida Sustentável app section Employee Volunteering
84% +90% 2021 2022 f our energy matrix comes from renewable sources Note 1: When compared with traditional Brazilian banks Company Overview Competitive Advantages Business Verticals Lending and Financing Financials ESG Updates Appendix 38
Appendix
Glossary of operational definitions
Active clients: We define an active client as a customer at any given date that was the source of any amount of revenue for us in the preceding three months, or/and a customer that used products in the preceding three months. For Inter insurance, we calculate the number of active clients for our insurance brokerage vertical as the number of beneficiaries of insurance policies effective as of a particular date. For Inter Invest, we calculate the number of active clients as the number of individual accounts that have invested on our platform over the applicable period. Active clients per employee: Number of active clients at the end of the quarter Total number of employees at the end of the quarter, including interns
Client acquisition cost (CAC): The average cost to add a client to the platform, considering operating expenses for opening an account, such as onboarding personnel, embossing and sending cards and digital marketing expenses with a focus on client acquisition, divided by the number of accounts opened in the quarter.
Gross merchandise volume (GMV): Gross merchandise value, or GMV, for a given period as the total value of all sales made or initiated through our Inter Shop & Commerce Plus platform managed by Inter Shop & Commerce Plus.
Activity Rate: Number of active clients at the end of the quarter Total number of clients at the end of the quarter
Gross take rate: Inter Shop gross revenue GMV
Card+PIX TPV: PIX, debit and credit cards and withdrawal transacted volumes of a given period. PIX is a Central Bank of Brazil solution to bring instant payments among banks and financial institutions in Brazil.
Net take rate: Inter Shop net revenue GMV
Card+PIX TPV per active client: Card+PIX TPV for a given period divided by the number of active clients as of the last day of the period.
Primary Banking Relationship: A client who has 50% or more of their income after tax for that period flowing to their bank account with us during the month. Company Overview Competitive Advantages Business Verticals Lending and Financing Financials ESG Updates Appendix 40
Glossary of financial measures reconciliation
Administrative efficiency ratio: Administrative expenses
Card fee revenue: It is part of the “Revenue from services and commission” and “Other revenue” on IFRS Income Statement.
Net Interest Income + Net result from services and comissions + Other revenue − Tax expense
Annualized interest rates: Yearly rate calculated by multiplying the quarterly interest by four, over the average portfolio of the last two quarters. All-in loans rate considers Real Estate, Payroll +FGTS, SMBs, Credit Card, excluding non-interest earnings credit card receivables, and Anticipation of Credit Card Receivables.
Anticipation of credit card receivables: Disclosed in note 9.a of the Financial Statements, line " "Loans to financial institutions”.
Cost of funding: Cost of risk: Interest expenses × 4 Average of last 2 quarters Interest bearing liabilities (demand deposits, time deposits, savings deposits, creditors by resources to release and securities issued)
Impairment losses on `inancial assets × 4 Average of last 2 quarters of Loans and advances to customers ARPAC gross of interest expenses:
(Interest income + (Revenue from services and comissions − Cashback − Inter rewards) + Income from securities and derivarives + Other revenue) ÷ 3 Average of the last 2 quarters Active Clients ARPAC net of interest expenses:
Cost of risk excluding anticipation of credit card receivables: Impairment losses on `inancial assets × 4 Average of last 2 quarters of Loans and advances to customers excluding anticipation of credit card receivables (Revenue − Interest expenses) ÷ 3 Average of the last 2 quarters Active Clients Cost of risk excluding credit card: Impairment losses on `inancial assets × 4
Average of last 2 quarters of Loans and advances to customers excluding credit card ARPAC per quarterly cohort: Total Gross revenue net of interest expenses in a given cohort divided by the average number of active clients in the current and previous periods1. Cohort is defined as the period in which the client started his relationship with Inter. 1 - Average number of active clients in the current and previous periods: For the first period, is used the total number of active clients in the end of the period.
Assets under custody (AuC): We calculate assets under custody, or AUC, at a given date as the market value of all retail clients’ assets invested through our investment platform as of that same date. We believe that AUC, as it reflects the total volume of assets invested in our investment platform without accounting for our operational efficiency, provides us useful insight on the appeal of our platform. We use this metric to monitor the size of our investment platform.
Cost-to-serve (CTS): (Personnel Expense + Administrative Expenses
− Total CAC) ÷ 3 Average of the last 2 quarters Active Clients
Company Overview Competitive Advantages Business Verticals Lending and Financing Financials
ESG Updates Appendix 41
Glossary of financial measures reconciliation Coverage ratio: Provision for expected credit loss Overdue higher than 90 days
Net interest income: Interest Income + Interest Expenses + Income from securities and derivatives
Earning portfolio (IEP): Earnings Portfolio includes “Amounts due from financial institutions” + “Loans and advances to customers” + “Securities” + “Derivatives” from the IFRS Balance Sheet. Net revenue: Net interest income + Net result from services and commissions + Other revenue Efficiency ratio: Personnel expense + Administrative expenses + Depreciation and amortization Net Interest Income + Net result from services and comissions + Other revenue − Tax expense NIM 1.0 – IEP + Non-interest Credit Cards Receivables: Net interest income x 4 Average of 2 Last Quarters Earning Portfolio (Loans to `inancial institutions + Securities + Derivatives + Net loans and advances to customers Fee income ratio: NIM 2.0 – IEP Only: Net interest income x 4 Net result from services and commissions + Other revenue Net Interest Income + Net result from services and comissions + Other revenue − Tax expense Average of 2 Last Quarters Earning Portfolio − Non − interest − Bearing Credit Cards Receivables (Amounts due from `inancial institutions + Securities + Derivatives + Net loans and advances to customers – Credit card transactor portfolio) Funding: Demand Deposits + Time Deposits + Securities Issued + Savings Deposits + Creditors by Resources to Release NPL 15 to 90 days: Gross loan portfolio: Net fee income: Loans and Advance to Customers + Loans to `inancial institutions Net result from services and commissions + Other revenue NPL > 90 days: Overdue 15 to 90 days Loans and Advance to Costumers + Loans to `inancial institutions Overdue higher than 90 days Loans and Advance to Costumers + Loans to `inancial institutions Company Overview Competitive Advantages Business Verticals Lending and Financing Financials ESG Updates Appendix 42
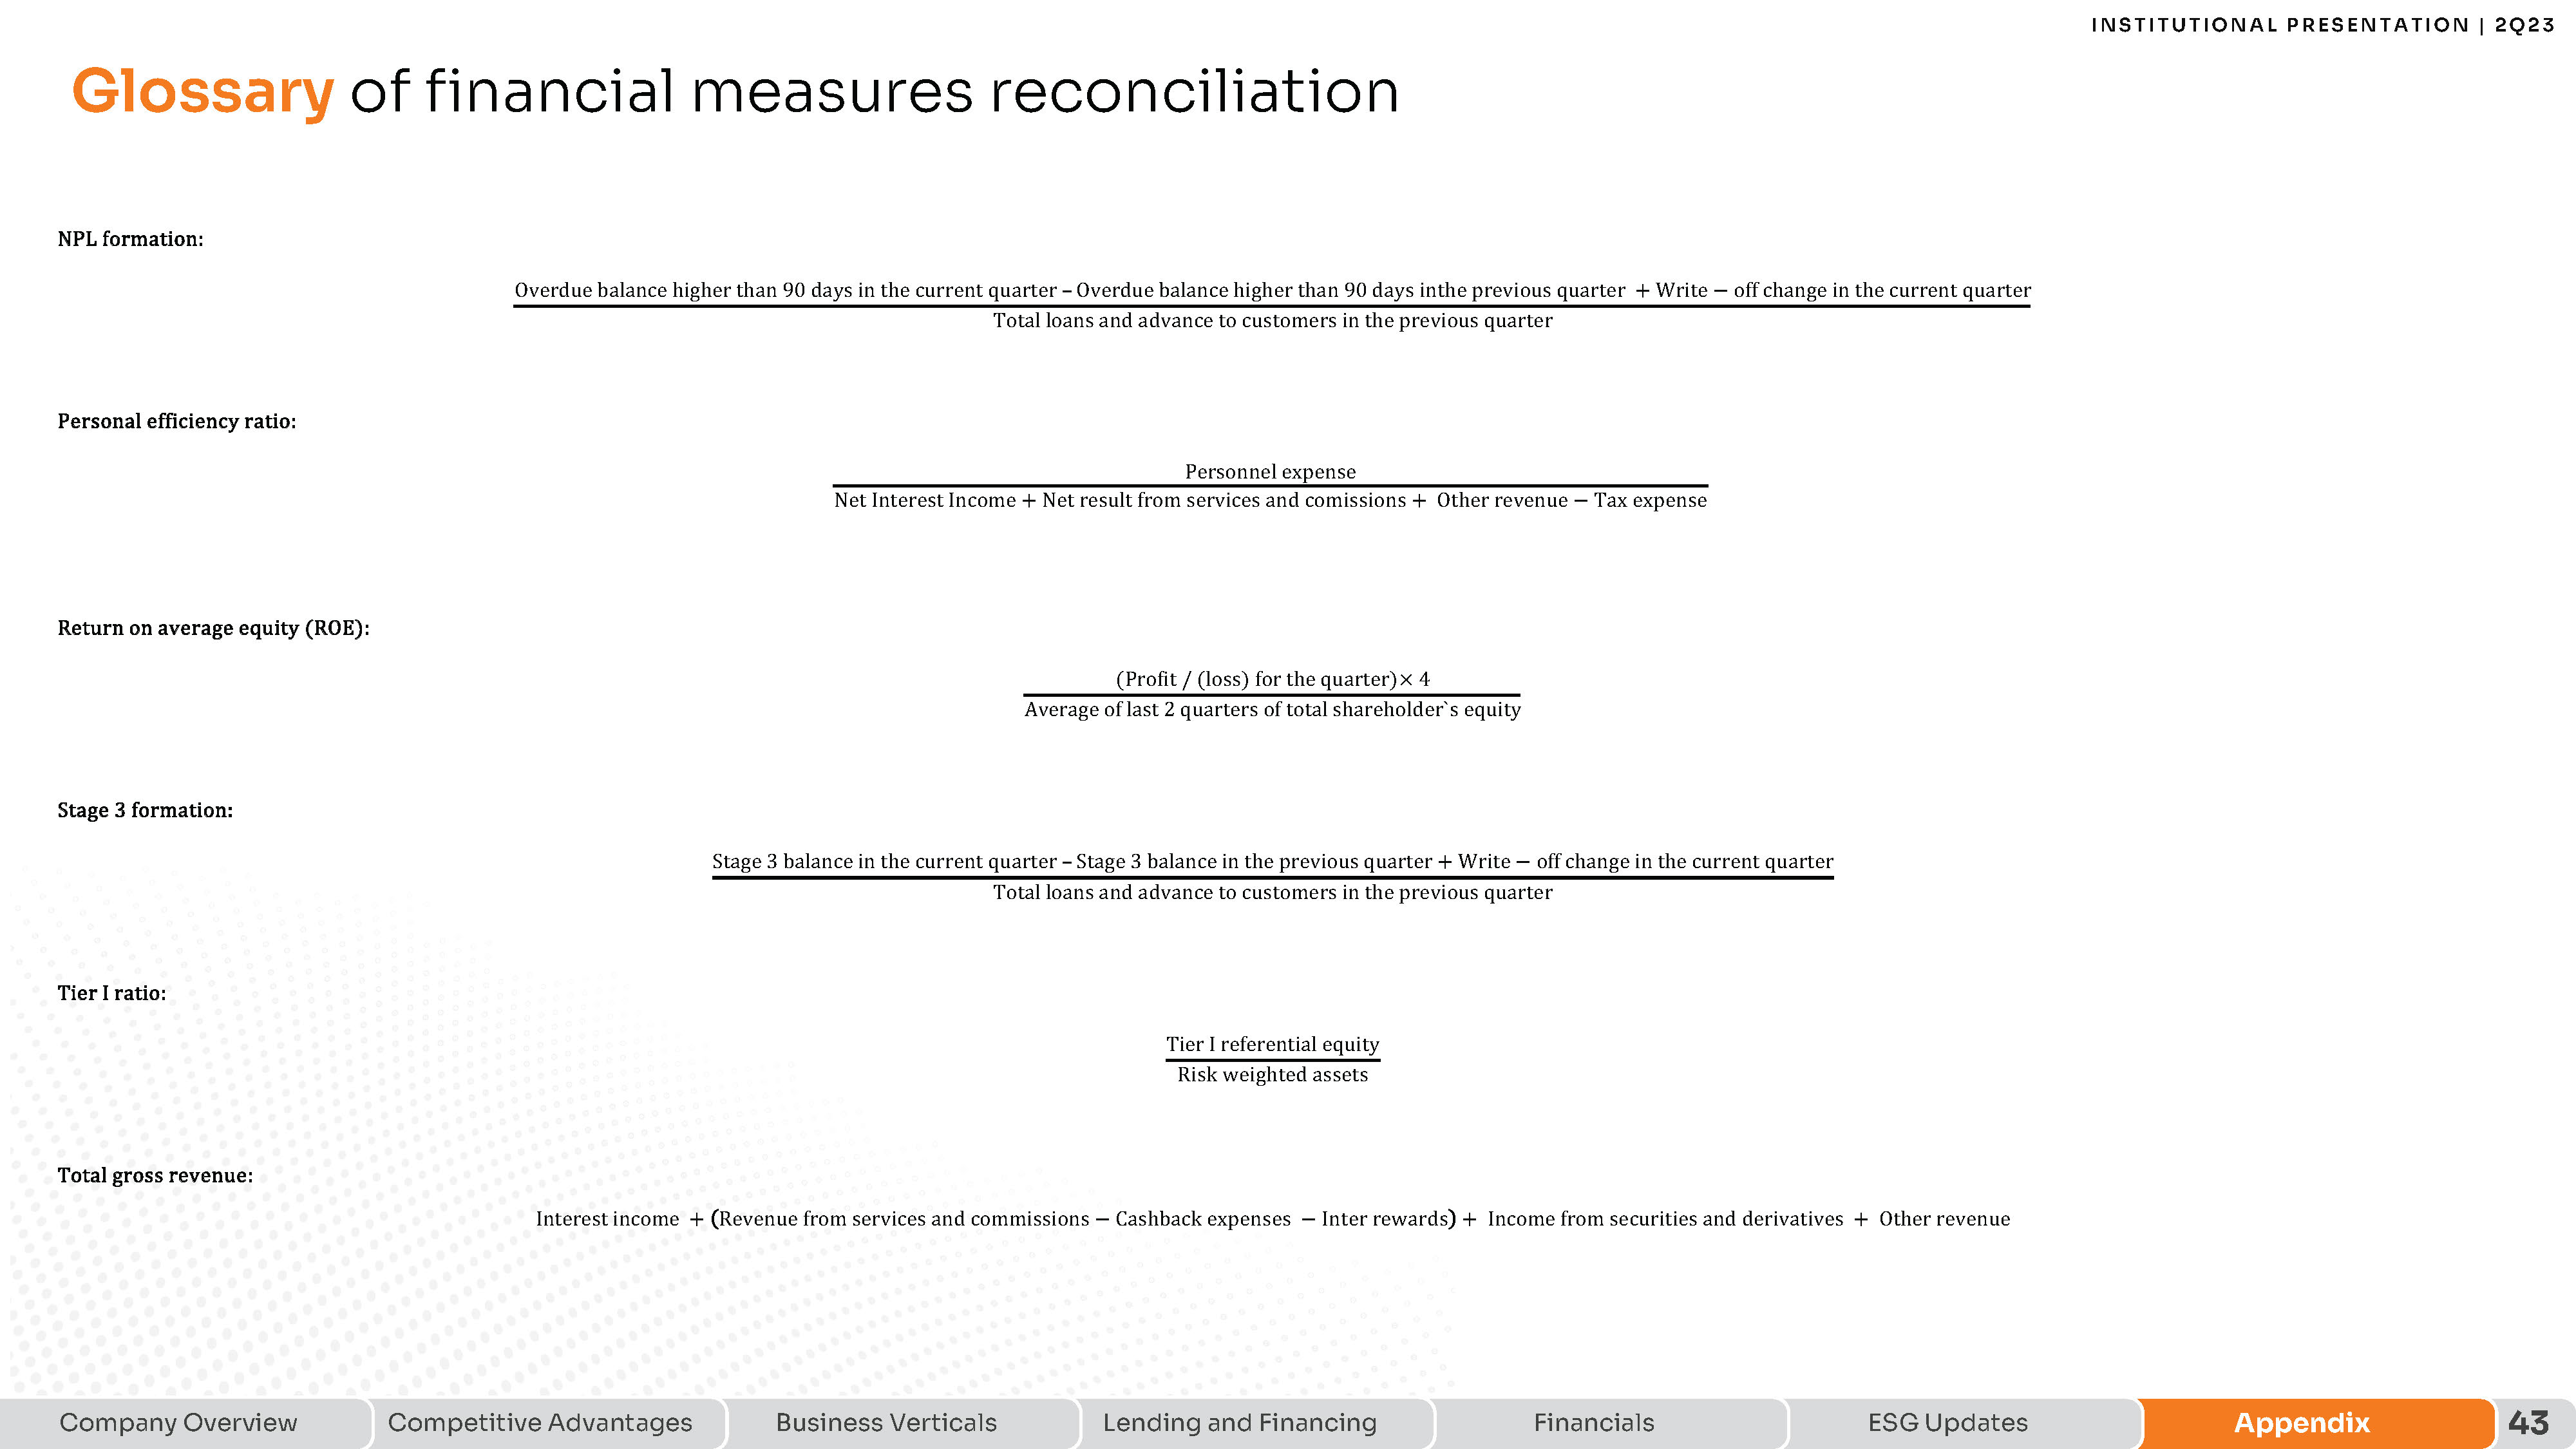
Glossary of financial measures reconciliation NPL formation: Overdue balance higher than 90 days in the current quarter – Overdue balance higher than 90 days inthe previous quarter + Write − off change in the current quarter Total loans and advance to customers in the previous quarter Personal efficiency ratio: Personnel expense Net Interest Income + Net result from services and comissions + Other revenue − Tax expense Return on average equity (ROE): (Pro`it / (loss) for the quarter)× 4 Average of last 2 quarters of total shareholder`s equity
Stage 3 formation: Stage 3 balance in the current quarter – Stage 3 balance in the previous quarter + Write − off change in the current quarter Total loans and advance to customers in the previous quarter Tier I ratio: Tier I referential equity Risk weighted assets Total gross revenue: Interest income + Revenue from services and commissions − Cashback expenses − Inter rewards + Income from securities and derivatives + Other revenue Company Overview Competitive Advantages Business Verticals Lending and Financing Financials ESG Updates Appendix 43
Inter (NASDAQ:INTR)
Historical Stock Chart
From Apr 2024 to May 2024

Inter (NASDAQ:INTR)
Historical Stock Chart
From May 2023 to May 2024
