Energy Recovery, Inc. (Nasdaq:ERII), a global leading provider of
ultra efficient energy recovery products and technology for
seawater desalination, announced today the results of its third
quarter ended September 30, 2008. In the third quarter of 2008, ERI
achieved net revenue of $9.0 million, exceeding the Company�s
guidance of $6.8 million to $7.2 million. Year to date 2008 net
revenue was $30.1 million, which represented an increase of 40%
over net revenue of $21.6 million for the nine months ended
September 30, 2007. ERI reported net income of $623 thousand, or
$0.01 per diluted share, for the three months ended September 30,
2008 compared to $2.4 million, or $0.06 per diluted share, for the
same period last year. Year to date net income was $3.4 million, or
$0.07 per diluted share, compared to $3.1 million, or $0.08 per
diluted share, for the same period last year. In July 2008, ERI
sold an aggregate of 16,100,000 shares of its common stock in its
initial public offering (�IPO�) at $8.50 per share, including the
underwriters� over-allotment option. Of the shares sold in the
offering, 10,178,566 shares were sold by the Company and 5,921,434
shares were sold by selling stockholders. ERI received net proceeds
of approximately $76.8 million from the IPO, after deducting
underwriting discounts and commissions and direct expenses. The
financial effect of the IPO is reflected in the Company�s third
quarter financial results. �We exceeded our sales forecast in the
third quarter due to stronger than expected demand from our OEM
customer group whose projects are under 50,000 cubic meters per
day,� said GG Pique, President and CEO of Energy Recovery, Inc. �We
continue to see strong demand among both our large EPC customers as
well as our OEM customers as reflected in our fourth quarter
guidance. Our fourth quarter alone is expected to exceed our total
annual revenue in 2006.� ERI provides the following guidance for
the fourth quarter of 2008 and the full year (in thousands, except
per share data): � Q4 2008 � Full Year 2008 � Estimated net revenue
$20.0 to $22.0 million $50.0 to $52.0 million � Estimated net
income $3.4 to $4.1 million $6.8 to 7.5 million � Estimated
earnings per diluted share $0.07 to $0.08 $0.14 to $0.16 Forward
Looking Statements This press release includes �forward-looking
statements" within the meaning of Section 27A of the Securities Act
of 1933, as amended, and Section 21E of the Securities Exchange Act
of 1934, as amended. Such forward-looking statements include
statements regarding the Company�s ability to achieve certain
levels of revenue and earnings in the fourth quarter and full year
for 2008, the Company�s ability to successfully implement its
strategic initiatives and the Company�s position in the
desalination industry. Because such forward-looking statements
involve risks and uncertainties, the Company's actual results may
differ materially from those projected in such forward-looking
statements. Factors that could cause actual results to differ
materially include, but are not limited to, cyclical nature of sea
water reverse osmosis plants, delays or postponements in the
construction of desalination plants, the ability of our customer to
obtain financing for the construction of their plants, the ability
of our customers to obtain other key components of a plant, delays
in governmental approvals, changes in customers� budgets for
desalination plans and the timing of their purchasing decision,
interruption in the supply of key production components such as
ceramic parts, shipping delays, and other risks detailed in the
Company's filings with the Securities and Exchange Commission
(�SEC�). All forward-looking statements are made as of today, and
the Company assumes no obligation to update such statements. For
more details relating to the risks and uncertainties that could
cause actual results to differ materially from those anticipated in
our forward-looking statements, please refer to the Company's SEC
filings. Conference Call to Discuss Third Quarter 2008 Results The
conference call scheduled today at 1:30 p.m. PDT will be in a
"listen-only" mode for all participants other than the investment
professionals who regularly follow the Company. The toll-free phone
number for the call is 800-951-9235 or 706-758-9752 and the access
code is 68565515. Callers should dial in approximately 15 minutes
prior to the scheduled start time. A telephonic replay will be
available at 800-642-1687 or 706-645-9291, Access Code: 68565515,
from 5:30 p.m. PDT on Tuesday, November 11, 2008 to 8:59 p.m. PDT
on Tuesday, November 24, 2008. Investors may also access the live
call or the replay over the internet at www.streetevents.com;
www.earnings.com and www.energyrecovery.com. The replay will be
available approximately three hours after the live call concludes.
About ERI� Energy Recovery, Inc. (ERI) is a leading manufacturer of
energy recovery devices, which significantly reduce energy
consumption and help make desalination affordable. ERI�s PX
Pressure Exchanger� technology (PX�) is a rotary positive
displacement pump that recovers energy from the high pressure
reject stream of seawater reverse osmosis systems at up to 98%
efficiency with no downtime or scheduled maintenance. The Company
has research, development and manufacturing facilities in San
Leandro, California as well as direct sales offices and technical
support centers in key desalination hubs such as Madrid, UAE,
Shanghai and Florida. ERI service representatives are based in
Algeria, Australia, China, India, Korea, Mexico, Taiwan and the
Caribbean. For more information on ERI and PX technology, please
visit www.energyrecovery.com. ENERGY RECOVERY, INC. CONDENSED
CONSOLIDATED STATEMENTS OF OPERATIONS (in thousands, except per
share data) (unaudited) � � � � Three Months Ended Nine Months
Ended September 30, September 30, � 2008 � � 2007 � � 2008 � � 2007
� Net revenue $ 9,044 $ 10,978 $ 30,125 $ 21,569 Cost of revenue
(1) � 3,497 � � 4,096 � � 11,122 � � 8,524 � Gross profit 5,547
6,882 19,003 13,045 Operating expenses: Sales and marketing (1)
1,467 1,372 4,263 3,787 General and administrative (1) 2,696 1,053
8,211 2,786 Research and development (1) � 678 � � 392 � � 1,723 �
� 1,221 � Total operating expenses � 4,841 � � 2,817 � � 14,197 � �
7,794 � Income from operations 706 4,065 4,806 5,251 Other income
(expense): Interest expense (17 ) (17 ) (62 ) (42 ) Interest and
other income � 217 � � 85 � � 841 � � 121 � Income before provision
for income taxes 906 4,133 5,585 5,330 Provision for income taxes �
283 � � 1,736 � � 2,186 � � 2,238 � Net income $ 623 � $ 2,397 � $
3,399 � $ 3,092 � Earnings per share: Basic $ 0.01 � $ 0.06 � $
0.08 � $ 0.08 � Diluted $ 0.01 � $ 0.06 � $ 0.07 � $ 0.08 � Number
of shares used in per share calculations: Basic � 49,646 � � 39,631
� � 43,114 � � 38,821 � Diluted � 52,396 � � 42,080 � � 45,647 � �
41,192 � � � (1) Includes stock-based compensation expense as
follows: � Three Months Ended Nine Months Ended September 30,
September 30, � 2008 � � 2007 � � 2008 � � 2007 � Cost of revenue $
34 $ 30 $ 65 $ 80 Sales and marketing 122 95 224 263 General and
administrative 149 92 290 280 Research and development � 52 � � 38
� � 97 � � 108 � Total stock-based compensation $ 357 � $ 255 � $
676 � $ 731 � ENERGY RECOVERY, INC. CONDENSED CONSOLIDATED BALANCE
SHEETS (in thousands, except share data) (unaudited) � � September
30, December 31, � 2008 � � 2007 � ASSETS Current assets: Cash and
cash equivalents $ 79,821 $ 240 Restricted cash - 366 Accounts
receivable, net of allowance for doubtful accounts of $76 and $121
at September 30, 2008 and December 31, 2007, respectively 13,333
12,849 Unbilled receivables, current 3,576 1,733 Notes receivable
from stockholders - 20 Inventories 9,779 4,791 Deferred tax assets,
net 1,052 1,052 Prepaid expenses and other current assets � 3,060 �
� 369 � Total current assets 110,621 21,420 Unbilled receivables,
non-current 119 2,457 Restricted cash, non-current - 1,221 Property
and equipment, net 1,694 1,671 Intangible assets, net 323 345
Deferred tax assets, non-current, net 148 148 Other assets,
non-current � 51 � � 42 � Total assets $ 112,956 � $ 27,304 �
LIABILITIES AND STOCKHOLDERS' EQUITY Current liabilities: Accounts
payable $ 2,090 $ 1,697 Accrued expenses and other current
liabilities 4,613 1,868 Liability for early exercise of stock
options - 20 Income taxes payable 540 1,154 Accrued warranty
reserve 248 868 Deferred revenue 594 488 Customer deposits 2,739
318 Current portion of long-term debt 172 172 Current portion of
capital lease obligations � 36 � � 38 � Total current liabilities
11,032 6,623 Long-term debt 428 557 Capital lease obligations,
non-current � 36 � � 63 � Total liabilities � 11,496 � � 7,243 �
Commitments and contingencies Stockholders' equity Preferred stock,
$0.001 par value; 10,000,000 shares authorized; no shares issued or
outstanding - - Common stock, $0.001 par value; 200,000,000 shares
authorized; 50,008,118 and 39,777,446 shares issued and outstanding
at September 30, 2008 and December 31, 2007, respectively 50 40
Additional paid-in capital 98,250 20,762 Notes receivable from
stockholders (307 ) (835 ) Accumulated other comprehensive loss (31
) (5 ) Retained earnings � 3,498 � � 99 � Total stockholders'
equity � 101,460 � � 20,061 � Total liabilities and stockholders'
equity $ 112,956 � $ 27,304 � ENERGY RECOVERY, INC. CONDENSED
CONSOLIDATED STATEMENTS OF CASH FLOWS (in thousands) (unaudited) �
� Nine Months Ended September 30, � 2008 � � 2007 � Cash Flows From
Operating Activities Net income $ 3,399 $ 3,092 Adjustments to
reconcile net income to net cash from operating activities:
Depreciation and amortization 378 222 Interest accrued on notes
receivables from stockholders (12 ) (23 ) Stock-based compensation
676 731 Gain on foreign currency transactions (383 ) - Provision
for doubtful accounts 6 (13 ) Provision for warranty claims (531 )
31 Provision for excess or obsolete inventory 29 - Changes in
operating assets and liabilities: Accounts receivable (107 ) 883
Unbilled receivables 495 (3,396 ) Inventories (5,017 ) (2,439 )
Prepaid and other assets (2,700 ) (105 ) Accounts payable 393 451
Accrued expenses and other liabilities 2,653 118 Income taxes
payable (614 ) 142 Deferred revenue 106 237 Customer deposits �
2,421 � � 52 � Net cash provided by (used in) operating activities
� 1,192 � � (17 ) Cash Flows From Investing Activities Capital
expenditures (376 ) (884 ) Restricted cash 1,587 (33 ) Other � (1 )
� (45 ) Net cash provided by (used in) investing activities � 1,210
� � (962 ) Cash Flows From Financing Activities Proceeds from
long-term debt - 639 Repayment of long-term debt (129 ) (44 )
Repayments of revolving note, net - (438 ) Repayment of capital
lease obligation (28 ) (30 ) Net proceeds from issuance of common
stock 76,808 5,119 Repayment of notes receivables from stockholders
560 23 Other short term financing activities � (6 ) � (129 ) Net
cash provided by (used in) financing activities � 77,205 � � 5,140
� Effect of exchange rate differences on cash and cash equivalents
� (26 ) � 3 � Net change in cash and cash equivalents 79,581 4,164
Cash and cash equivalents, beginning of period � 240 � � 42 � Cash
and cash equivalents, end of period $ 79,821 � $ 4,206 �
Supplemental disclosure of cash flow information Cash paid for
interest $ 60 � $ 39 � Cash paid for income taxes $ 4,706 � $ 2,120
� Supplemental disclosure of non-cash transactions Issuance of
common stock in exchange for notes receivable from stockholders $
20 � $ 6 �
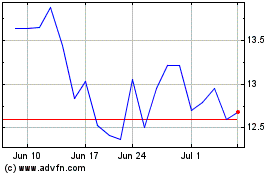
Energy Recovery (NASDAQ:ERII)
Historical Stock Chart
From May 2024 to Jun 2024

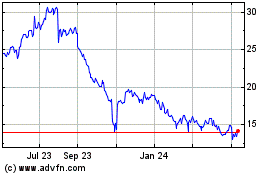
Energy Recovery (NASDAQ:ERII)
Historical Stock Chart
From Jun 2023 to Jun 2024
