Cintas' EPS Beats, Raises Outlook - Analyst Blog
July 20 2011 - 7:15AM
Zacks
Cintas Corporation
(CTAS) recently reported its fiscal 2011 earnings results,
delivering an EPS of 49 cents versus 36 cents during the
year-earlier quarter, representing a substantial increase of 36.0%
and outshining the Zacks Consensus Estimates of 44 cents.
For fiscal year the company
reported an EPS of $1.68 versus $1.40 during the prior-year,
representing an increase of 20.0%.
Total revenue in the quarter
increased 11.3% to $1,012.2 billion from $909.4 million in the
year-ago quarter, striding ahead of the Zacks Consensus Estimate of
$988.0 million. For fiscal 2011, the company reported total revenue
of $3.81 billion versus $3.55 billion in the prior-year. The
improvement in the revenue is mainly attributable to the increase
in volumes and continued momentum in all the company’s
segments.
Costs and
Margins
Cintas reported cost of sales of
$579.0 million during the quarter versus $523.9 million in the
year-ago quarter. Gross margin during the quarter increased 40
basis points year over year to 42.8%. Selling general and
administrative expenses increased 6.0% on a year-over-year basis to
$304.2 million.
Operating income during the quarter
increased $26.9% substantially to $128.9 million. Net income of the
company increased 27.6% on a year-over-year basis to $70.8 million
in the quarter. Consequently, net margins also increased 90 basis
points year over year to 7.0%.
Cintas reported cost of sales of
$2.20 billion during the fiscal 2011 versus $2.05 billion in the
prior-year. However, gross margin remained flat at 42.2% from the
prior-year levels. Selling, general and administrative
expenses increased 7.6% on a year-over-year basis to $1.17
billion.
Operating income during the fiscal
2011 increased 12.7% substantially to $440.3 million. Net income of
the company increased 14.5% on a year-over-year basis to $247.0
million in the quarter. Consequently, net margins also increased 40
basis points year over year to 6.5%.
Segmental
Analysis
Rental uniform and ancillary
products: The segment reported revenue of $711.9 million in the
quarter compared with $647.7 million in the year-ago quarter.
For full year the segment reported
total revenue of $2.69 billion versus $2.57 billion during the
prior-year.
Uniform Direct Sales: Total revenue
during the quarter amounted to $109.0 million versus $103.2 million
in the year-ago quarter.
For fiscal 2011, the segment earned
total revenue of $419.2 million compared with $386.4 million during
fiscal 2010.
First Aid, Safety and Fire
Protection: Total revenue in the quarter amounted to $99.6 million
versus $87.9 million during the year-earlier quarter.
For the full year, the segment
reported total revenue of $377.7 million versus $21.5 million in
the fiscal 2010.
Document Management: The segment
reported total revenue of $91.5 million versus $70.7 million in the
year-earlier quarter.
For the full year the segment
earned total revenue of $321.2 million versus $253.0 million in the
prior-year.
Financial
Position
As of May 31, 2011 cash and cash
equivalent amounted to $438.1 million versus $411.3 million as of
May 31, 2010.
Cash flow at the end of fiscal 2011
was $340.9 million versus $565.6 million at the end of fiscal 2010.
Capital expenditure increased to $182.6 million at the end of
fiscal 2011 from $111.1 million at the end of fiscal 2010. Free
cash flow during the same period was $158.3 million compared with
$454.6 million during the prior-year same period.
As of May 31, 2011, the
debt-to-capitalization ratio declined to 35.8% from 23.7% as of May
31, 2010.
During the fourth quarter, the
company purchased 15.8 million shares of its common stock for $500
million, at an average price of $31.65 per share. However, during
the fiscal 2011, the company purchased a total of 23.4 million
shares for $702.0 million at an average price of $30.00 per
share.
Outlook
Share repurchase along with easy
debt financing is likely to create future opportunities and enhance
the company’s value in the long term. The company now guides higher
revenue for fiscal 2012 in the range of $4.0 billion to $4.1
billion; while the full year earnings are projected in the range of
$1.97-$2.05 per share. The guidance is based on the assumption
of an improving economy and employment levels in the coming
year.
Cincinnati, Ohio-based Cintas
Corporation designs, manufactures and implements corporate identity
uniform programs, and provides entrance mats, restroom supplies,
promotional products, and first aid and safety products for
approximately 800,000 businesses. Cintas competes with
G&K Services Inc. (GKSR) and privately-held
Alsco Inc. and ARAMARK Corporation. Cintas currently retains a
Zacks #4 Rank (short-term Sell rating).
CINTAS CORP (CTAS): Free Stock Analysis Report
G&K SVCS A (GKSR): Free Stock Analysis Report
Zacks Investment Research
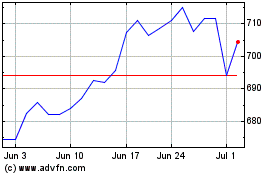
Cintas (NASDAQ:CTAS)
Historical Stock Chart
From May 2024 to Jun 2024

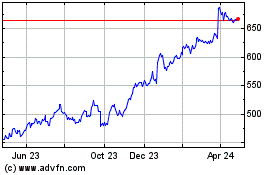
Cintas (NASDAQ:CTAS)
Historical Stock Chart
From Jun 2023 to Jun 2024
